
Earned Run Average (ERA) and its derivative, ERA+ are, unquestionably, the go to stats for evaluating pitcher performance. Seldom mentioned is Run Average, or RA. Yet, when the runs are tallied at the end of the game, it doesn’t matter whether some are earned and some not; they all count the same.
So, why don’t we pay more attention to Run Average? The conventional answer to this question is that so-called unearned runs are not the pitcher’s fault. All the blame rests solely on the defense. But, is this really true? Let’s find out!
Let’s start with trends in errors and unearned runs. Here are the AL and NL results, with each plot point in the scatter diagram representing a singles team’s result for a given season.
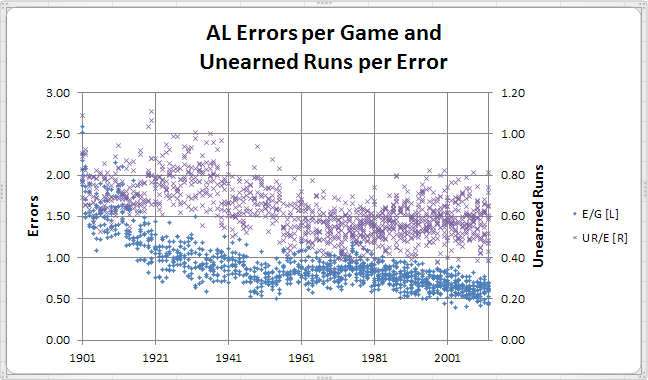
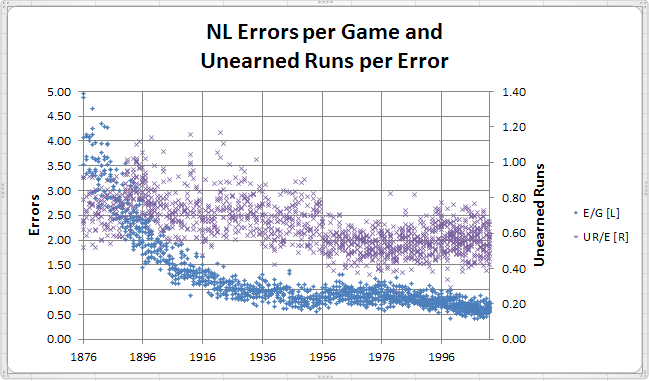 So, as we would expect, errors and the runs supposedly resulting from them have both declined over the years as improvements have occurred in equipment and playing conditions.
However, since about the 1960s, these factors have been pretty constant with most teams in the range of 0.5 to 1 error per game, and 0.4 to 0.8 unearned runs per error.
So that’s unearned runs. What about the rest of the runs, the so-called earned ones?
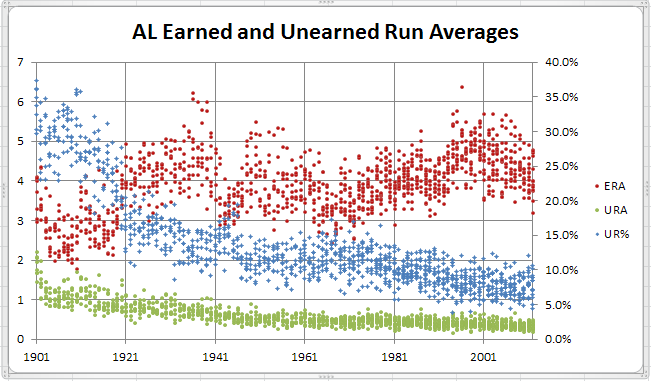
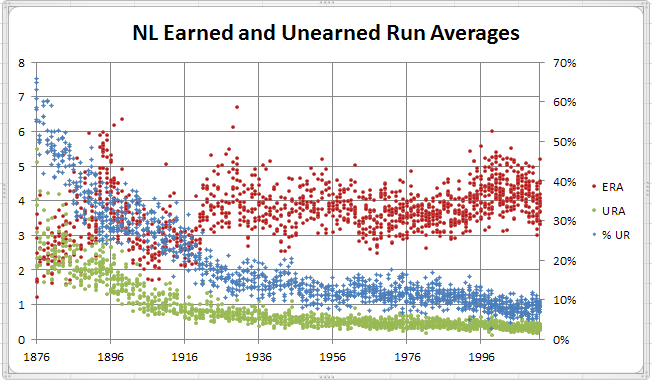
So, while ERA has bounced around over time, URA and UR% (% of all runs allowed that are unearned) have both declined steadily, albeit at very slow rate since the 1960s.
Probably nothing too unexpected up to this point. So, let’s look a bit closer at Unearned Runs per Game (UR/G), and per Error (UR/E), and see to what degree these may be related to pitching or to defense. I will use data since 1961 since most of the game improvements resulting in reduced errors have been in place since that time.
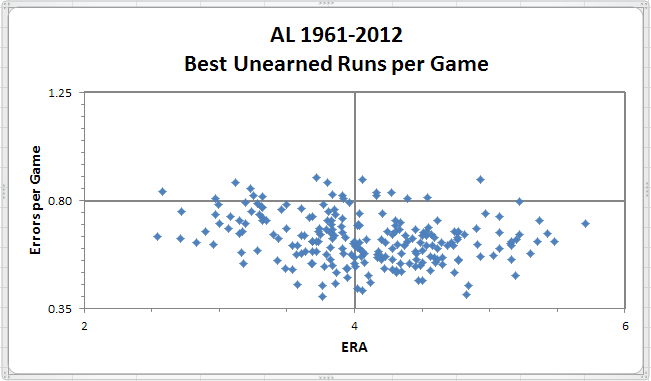
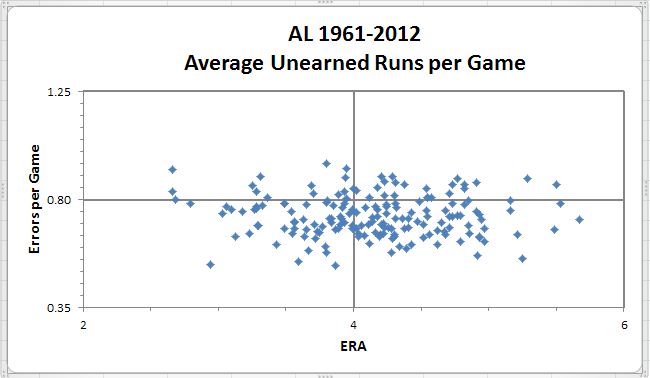
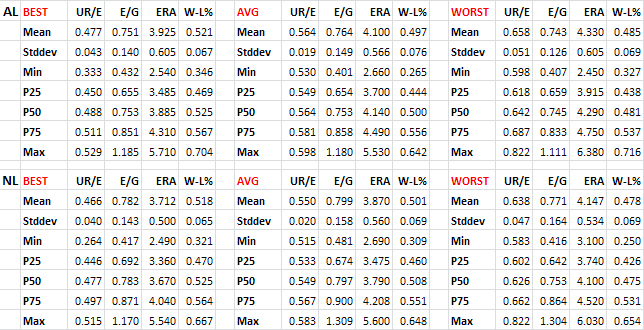
To do this, I’m grouping the team data for both UR/G and UR/E into Best, Average and Worst. In essence, I’m just sorting the team data points from lowest to highest by these variables and then splitting into 3 equal-sized groups.
Let’s start with UR/G. The three groups look like this.
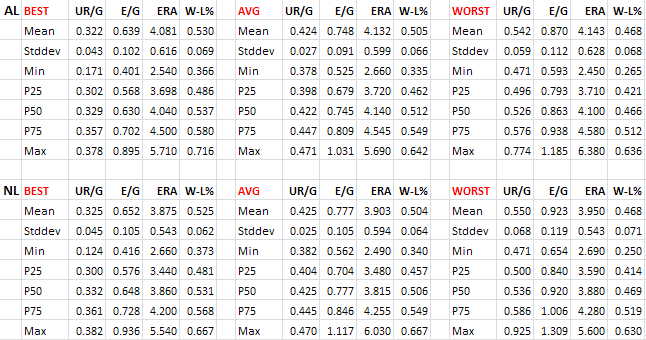
So, as we might expect, as teams allow more unearned runs per game, their W-L% declines (just as it would if more earned runs per game were allowed). But are more unearned runs allowed because of defense or pitching (or both)? Probably much easier to see visually. First the AL data.
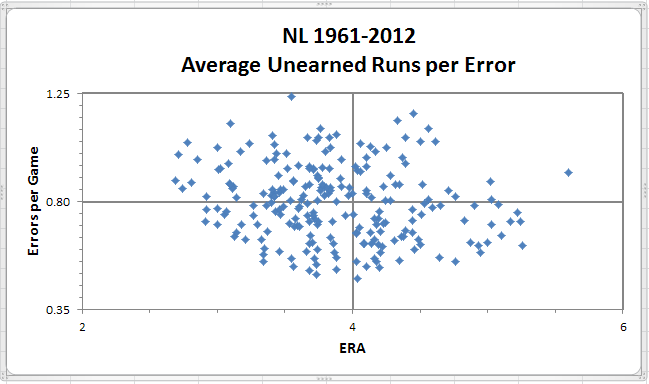
Now for the NL.
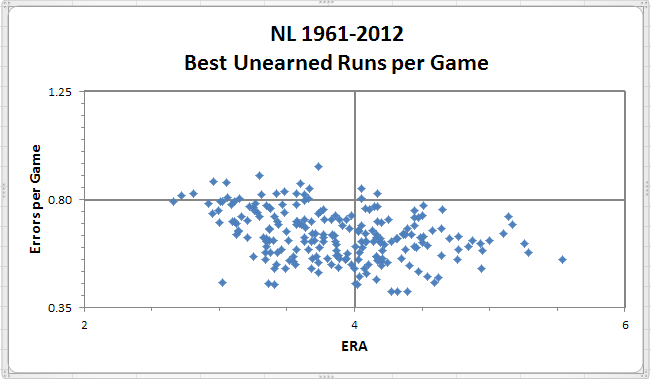
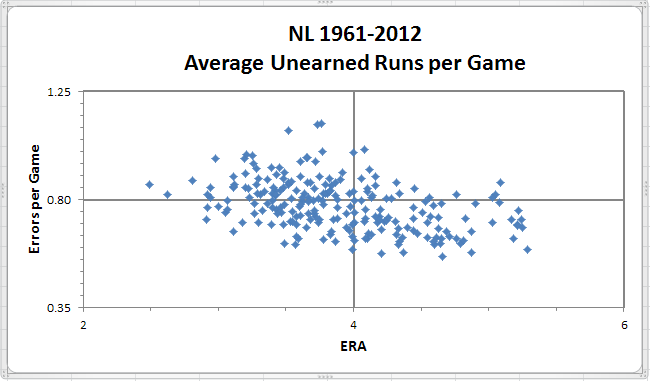
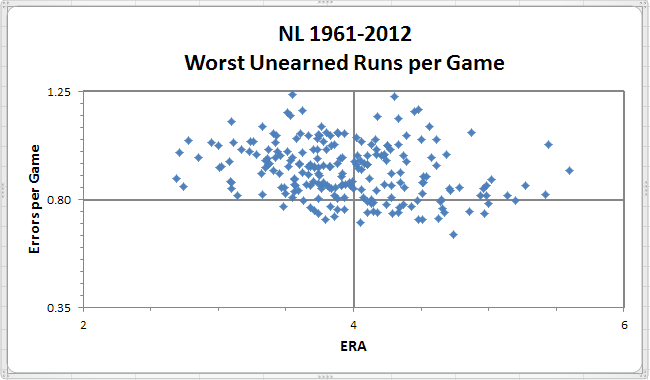
These are team data, one data point for each team/season since 1961. The coordinates of each data point are team ERA for the horizontal x-axis and errors per game for the vertical y-axis. Thus, better pitching teams will be found on the left side of the chart and better fielding teams on the lower portion. The best teams should be in the bottom left quadrant and the worst in the top right, with the split personality teams in the other two quadrants.
So, what are we seeing? These charts seems to be telling us that pitching has absolutely nothing to do with allowing unearned runs. Why? Well, the swarm of bees that comprise our data points is moving up the chart from bottom to top as we look at the best, average and worst teams in allowing unearned runs per game. There is very little discernible left-to-right (or right-to-left) movement in the swarm that would indicate dependence on pitching quality. But, is that a valid conclusion?
No, it’s probably not a valid conclusion that pitching has nothing to do with a team’s capabilities in preventing unearned runs from scoring. Why these data appear to suggest that that might be the case is likely due to the dependence of unearned runs on errors. That is, regardless of how good or bad a team’s pitching is, if the defense doesn’t make any errors, there won’t be any unearned runs scoring.
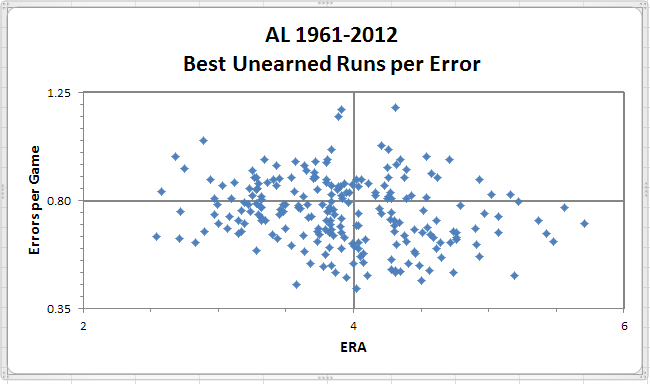
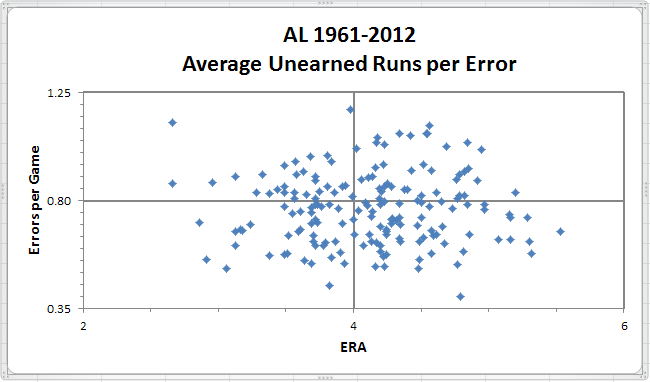
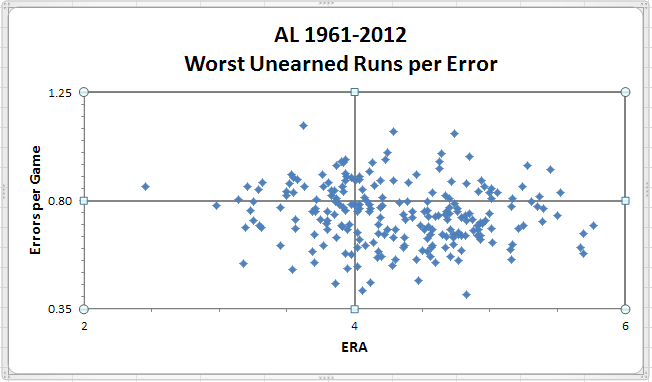
So, perhaps, instead of looking at unearned runs per game, we should really focus in on just the games where errors are committed. Here are the data for unearned runs per error (UR/E) split into Best, Average and Worst groups.
As expected, winning percentage improves as fewer unearned runs per error are allowed, but not by as much as was the case for unearned runs per game. What does this look like visually? First, for the AL.
And, for the NL.
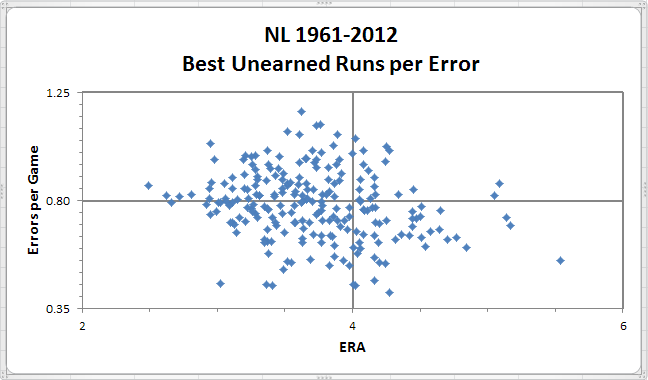
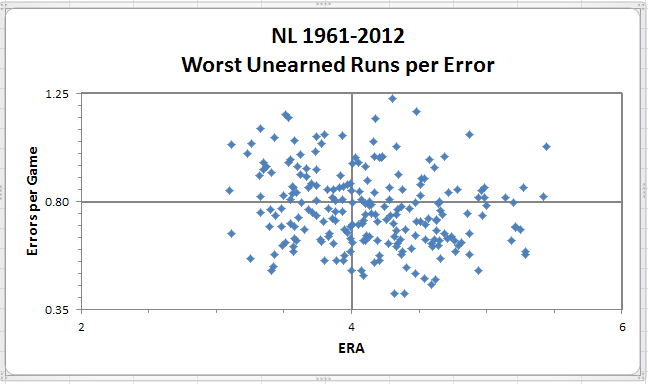
First off, the bee swarm is clearly more dispersed than with UR/G. Why is that? Mainly, it’s because not all errors are created equally. Errors may result in extra bases, extra outs, neither or both. Thus:
1. no extra outs, no extra bases. Example: dropped foul fly with bases empty and batter later retired
2. no extra outs, extra bases. Example: catcher throws ball into CF on stolen base attempt
3. extra out, no extra bases (other than batter). Example: booted grounder with bases empty
4. extra out and extra bases. Example: shortstop fields routine grounder and throws into dugout
In addition, the last 3 types have variants with runs scoring or not scoring on the play, such runs being (or becoming, based on future events) earned or unearned, but which cannot be defensed owing to their concurrence with the error event. Similarly, other runs (which, again, may be earned or unearned) may result subsequent to the play on which an error occurred, these being runs which could be defensed because they resulted indirectly from the error being committed.
But, I digress. The foregoing is an explanation for greater dispersion of these data compared to the UR/G data. However, the basic relationship of more errors = more unearned runs still holds.
So, what do these bee swarms tell us. Interestingly, they tell us pretty much the opposite story from the UR/G data. The movement of the swarm is primarily on the horizontal axis indicating that teams that have better pitching will allow fewer unearned runs per error, regardless of the defense behind them. That too makes sense since pitchers who are better at preventing earned runs from scoring will probably also do well at preventing unearned runs from scoring.
So what have we learned? Essentially, preventing runs from scoring, whether earned or unearned, is about good defense and good pitching (sorry if you read all this way expecting some totally non-intuitive conclusion). That being said, more focus on a pitcher’s run average is definitely warranted, particularly in view of the UR/E data.
While fun, this macro-level analysis has been just that:
- very high-level and visually based;
- using imperfect data (ERA, Errors) without context adjustment;
- and hoping that some general relationships can be inferred despite the limitations of the data and the analysis approach
In future installments, I hope to move on to identifying pitchers who perform better than others at preventing unearned runs. Just the other day, Adam identified one such pitcher in his post on Rick Reuschel.
In closing, here are the games with the most unearned runs scoring when no earned runs are allowed.
| Rk | Date | Tm | Opp | Rslt | IP | H | R | ER | BB | SO | HR | WP | BF |
|---|---|---|---|---|---|---|---|---|---|---|---|---|---|
| 1 | 1985-07-27 (1) | HOU | NYM | L 4-16 | 8.0 | 15 | 16 | 0 | 3 | 4 | 1 | 1 | 45 |
| 2 | 1990-07-22 | MIN | NYY | L 6-10 | 9.0 | 10 | 10 | 0 | 3 | 2 | 1 | 0 | 40 |
| 3 | 1945-09-10 (1) | CHW | WSH | L 4-10 | 8.0 | 11 | 10 | 0 | 4 | 1 | 0 | 0 | 41 |
| 4 | 1945-06-07 | BRO | NYG | L 5-10 | 8.0 | 7 | 10 | 0 | 7 | 4 | 0 | 3 | 44 |
| 5 | 1985-08-11 | OAK | SEA | L 6-9 | 8.0 | 13 | 9 | 0 | 3 | 2 | 0 | 3 | 42 |
| 6 | 1945-08-19 (2) | WSH | CLE | L 3-9 | 8.0 | 8 | 9 | 0 | 6 | 6 | 0 | 0 | 40 |
| 7 | 1932-06-07 | DET | NYY | L 2-9 | 9.0 | 8 | 9 | 0 | 6 | 5 | 0 | 1 | 43 |
| 8 | 1917-05-07 | PHA | NYY | L 4-9 | 9.0 | 7 | 9 | 0 | 5 | 4 | 1 | 0 | 41 |
| 9 | 2009-05-25 | HOU | CIN | L 5-8 | 8.0 | 13 | 8 | 0 | 5 | 8 | 0 | 0 | 43 |
| 10 | 2002-06-01 | CHW | CLE | L 4-8 | 8.0 | 6 | 8 | 0 | 4 | 5 | 1 | 1 | 35 |
| 11 | 1981-05-30 | HOU | SFG | W 9-8 | 14.0 | 11 | 8 | 0 | 2 | 8 | 1 | 2 | 59 |
| 12 | 1943-08-24 (2) | CHW | PHA | L 1-8 | 9.0 | 9 | 8 | 0 | 2 | 2 | 0 | 0 | 41 |
| 13 | 1941-07-25 | CHW | NYY | L 0-8 | 8.0 | 13 | 8 | 0 | 5 | 1 | 2 | 0 | 44 |
| 14 | 1940-08-22 | DET | BOS | W 9-8 | 10.0 | 10 | 8 | 0 | 4 | 5 | 2 | 0 | 45 |
| 15 | 1931-05-18 | NYY | DET | W 20-8 | 9.0 | 12 | 8 | 0 | 1 | 3 | 2 | 0 | 41 |
| 16 | 1928-07-25 | STL | BRO | L 1-8 | 8.0 | 10 | 8 | 0 | 3 | 3 | 0 | 1 | 36 |
| 17 | 1923-09-10 | CIN | PIT | L 0-8 | 9.0 | 7 | 8 | 0 | 6 | 2 | 0 | 0 | 41 |
| 18 | 1922-09-08 | SLB | DET | L 3-8 | 9.0 | 13 | 8 | 0 | 2 | 5 | 2 | 0 | 42 |
| 19 | 1922-08-02 | SLB | PHA | L 4-8 | 9.0 | 13 | 8 | 0 | 2 | 10 | 3 | 0 | 41 |
| 20 | 1920-05-20 | SLB | NYY | L 3-8 | 8.0 | 10 | 8 | 0 | 3 | 4 | 0 | 1 | 41 |
Pretty neat trick that the Astros pulled off in game 1. Allow 16 runs and all your pitchers lower their ERAs.