Frequency of shutouts as a function of run-scoring environment

We’ve been discussing just how commons shutouts have been in recent years, particularly in 2013 so far. Here’s a little bit of a look at the numbers.

shutouts_by_year

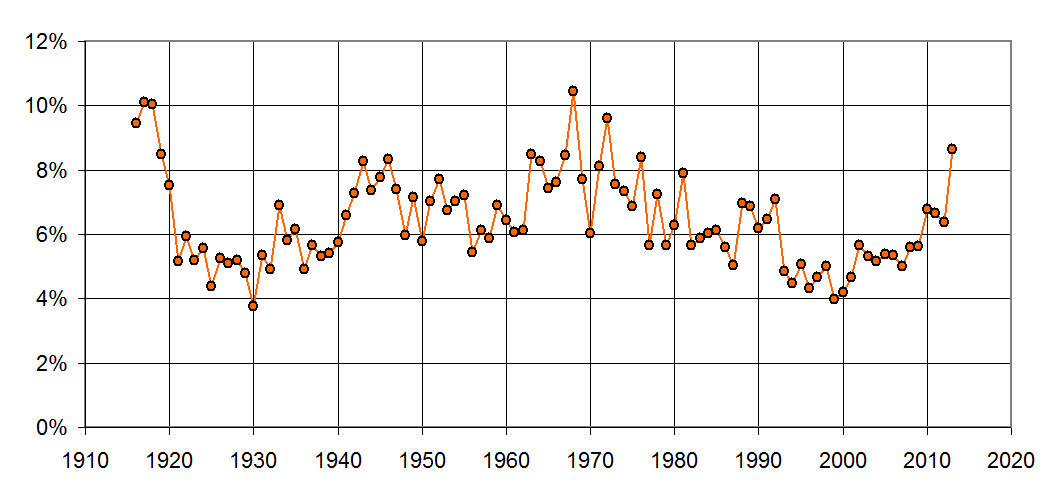
Here’s a plot showing percentage of all games ending as a shutout. I suppose it’s worth mentioning that this plot has a theoretical maximum of 50% since one team wins (virtually) every game. Anyway, note that from 1940 to 1992, the percentage was above 6 most ever year. Then, in 1993, when the steroids kicked in full-force, the rate of shutouts dropped under 6% and stayed there until the resurgence of pitching in 2010. Note that the 2013 is, of course, through Friday’s games and is likely to change before the year is over. If not, 2013’s shutout rate would be the 3rd highest since 1920, topped only by the Year of the Pitcher (1968) and the Year Before the DH (1972).

When I looked at the plot above, I thought it was an awfully high amount of variation. After all, even though run-scoring varies some, I wouldn’t have though the rate of shutouts does as much (or, as it turns out, even more). For example, the rate of shutouts in 1968 is nearly triple the rate in 1930, but run-scoring was only about 60% higher in 1930 than in 1968. So, why were there so many more shutouts?

Here’s the answer. The following plot shows percentage of games ending as a shutout as a function of the overall league-wide run-scoring that year.

shutouts_by_runs

The solid black line is a simply best-fit polynomial, which I added to show that the relationship between run-scoring and rate of shutouts is definitely not linear. If it were linear, we’d expect seasons with a run-scoring average of 5.0 to have about 3.5% shutouts, but in reality those years are between 4.0 and 4.5%. It makes sense–when run-scoring is high, teams usually push across at least one run. Think about the late 1990s and early 2000s–even when a team was dominated by the opposing pitcher, somebody usually hit a solo home run.

The low-scoring environment is a bit harder to explain if you don’t have a statistics background. The issue here is binning. When run-scoring is as high as 5.0 per game, teams score everywhere from 0 runs all the way up to 9 or 10 runs fairly often–meaning at least a few percent of games each year turn out that way. The result is a smooth histogram of games falling into each bin of 0, 1, 2, 3, 4, 5, 6, 7, 8, 9, or 10 runs, plus a tiny amount of games at 11 or more. However, when run scoring is down in the area of 3.5 per game, the bins are only 0, 1, 2, 3, 4, 5, 6, or 7 , with a tiny bin at 8+. The histogram is a low rougher, and the smallest bars at the extreme are a little bit larger. (This could be checked by looking at high-scoring games, which probably show a similar non-linearity.)

Think about it in baseball terms–if it’s a low run-scoring environment, there are fewer homers and other extra-base hits, and there are going to be a fair number of games where pushing even 1 run across is difficult. If a team is averaging 3 or 4 runs per game, the difference between that and zero might be just a single homer or bases-clearing double.

The lack of linearity of the above plot explains what we’ve been seeing in the last year years. When the league average is in the 4.5 runs per game area and it dips a little bit lower (as it has in the last couple of years), the fraction of shutouts doesn’t go up linearly, it goes up more. Therefore, a small drop in runs causes an amplified response in terms of added shutouts. This is the opposite of what we saw as we entered the mid 1990s–as run-scoring per game rose from 4.5 and pushed higher, shutouts disappeared even faster as every team scored at least a run just about every game.

0 0 votes
Article Rating
Subscribe
Notify of
guest

11 Comments
Oldest
Newest Most Voted
Inline Feedbacks
View all comments
MikeD
MikeD
11 years ago

I believe I noted in one of these threads a year back that if indeed MLB changed the strike zone to make it more pitcher friendly, as what happened in the 1960s, then it’s possible pitchers and umpires will work together to unknowingly keep expanding the strike zone, leading to lower scoring. This is not my idea. It was something I first saw suggested by Bill James when talking about what led up to the year of the pitcher in 1968. We probably saw the flip side of that in the 1990s when the art of taking pitches and driving… Read more »

bstar
bstar
11 years ago
Reply to  MikeD

The only change made by MLB that I know of is forcing umpires to look at pitch f/x after games. They get to see their mistakes. They learn. The high strike is back. The very low strike is getting called again. They’re not calling pitches four inches outside for strikes anymore. In my opinion, balls and strikes are being called better right now than at any time I’ve followed baseball. Instead of one umpire’s interpretation of what the strike zone is (and that could change from game to game, night to night), there seems to be more of a league-wide… Read more »

Doug
Editor
11 years ago

More of that “binning” on Saturday with 5 more shutouts and 4 other games with the loser scoring just once. But, there was also that 19-6 contest. Philip Humber is just the 12th starter since 1916 to allow 8+ ER while retiring no more than one batter. Rk Player Date Tm Opp Rslt App,Dec IP H R ER BB SO HR 1 Madison Bumgarner 2011-06-21 SFG MIN L 2-9 GS-1 ,L 0.1 9 8 8 0 1 0 2 Mark Redman 2006-09-23 KCR DET L 4-15 GS-1 ,L 0.1 7 9 9 2 0 1 3 Luke Hudson 2006-08-13 KCR… Read more »

Jeff Harris
Jeff Harris
11 years ago

Porcello was close: 9 runs and only 2 outs.

birtelcom
Editor
11 years ago

“…even when a team was dominated by the opposing pitcher, somebody usually hit a solo home run” Last night saw the second game of the season in which the only run scored was by way of a solo home run: Rays over A’s 1 to 0, Matt Joyce’s second inning homer the only scoring of the contest. The only other 1-0/solo homer game this season was an Opening Day Game, White Sox over KC on a Tyler Flowers homer. How often do 1-0 games with a solo homer occur? Here’s the average number of such games that have occurred in… Read more »

birtelcom
Editor
11 years ago
Reply to  birtelcom

To be avoid misinterpretation, the list in my comment 4 should probably be adjusted to reflect the fact that there are more games played per season as expansion has occurred and the season was extended. We can re-do the list above to express it in the form of the number of total games played on average per 1-0/solo homer game:
1920s: 504 games for each 1-0/solo homer game
1930s: 382
1940s: 258
1950s: 210
1960s: 149
1970s: 176
1980s: 229
1990s: 212
2000s: 236
2010-2012: 157

Arsen
Arsen
11 years ago

Is it possible that teams have not adjusted to the new lower run scoring environment? It seems that despite run scoring falling, we don’t often see teams playing for just one run the way we did in the 1970s. The value of the single run might be underrated in today’s game. Most hitters still are swinging the way they did in the steroid era which is resulting in record strikeouts but not record homeruns. If this continues for a few more years, I would be surprised if we didn’t start seeing some tactical changes from managers and hitters which might… Read more »

brp
brp
11 years ago
Reply to  Andy

And when notorious HR-or-bust guys like Adam Dunn and Mark Reynolds keep finding employment, it’s hard to argue with players for not modifying their approach.

Kenny
Kenny
11 years ago

Hi, Andy,

Shouldn’t it also be true that if there are more shutouts (due to fewer total runs being scored) that there would also be more tie games that go into extra innings? Do the records bear this out?