
On May 4, 2010, the Red Sox beat the Angels 5-1 on the strength of a 2-out, 4-run rally in the 8th inning that broke open what had been a tight pitchers’ duel between Ervin Santana and Jon Lester. Boston won that day despite a -0.418 WPA turned in by designated hitter David Ortiz, his fourth worst WPA score ever (his worst WPA game was also against Ervin Santana, in this 2009 contest). Here’s how David’s day went:
- 1st inning: ended inning striking out with runners at 2nd and 3rd
- 3rd inning: ended inning on double play groundout with runners at 1st and 2nd
- 6th inning: led off inning striking out, on 3 pitches
- 8th inning: grounded into double play with nobody out and bases loaded; no runs scored
At the conclusion of that debacle, Ortiz was riding a 4 for 34 skid, with a season slash of .149/.240/.358. Hardly the start he was looking for after a disappointing 2009 campaign that saw Ortiz hit just .238, his first full season since joining Boston in 2003 that he failed to hit 30 homers or drive in 100 runs. Whispers were that Big Papi was done – it was only a matter of time before the Sox cut him loose. Remember.
As with Mark Twain, rumors of Big Papi’s demise have been greatly exaggerated. In fact, Ortiz’s turnaround since that nadir just over 3 years ago has been nothing short of spectacular. More on the Ortiz miracle after the jump.
Of course, we know now what happened next. Ortiz went .429/.433/.786 over his next 7 games, and .387/.461/.813 over the next four weeks (22 games) to raise his season slash to .275/.360/.599 on June 2nd. That would be Ortiz’s season high-water mark for BA, SLG and OPS, but he stayed pretty close to those totals the rest of the way, to finish at .270/.370/.529, good for a 137 OPS+ with 32 HR, 102 RBI, respectable numbers if not exactly the type of monster year Ortiz delivered from 2004 to 2007 (avg of 159 OPS+ with 44 HR, 135 RBI).
However, it’s what’s happened after that 2010 season that is really remarkable. Take a look.
| Year | Age | Tm | G | PA | R | H | 2B | 3B | HR | RBI | BB | SO | |||||
|---|---|---|---|---|---|---|---|---|---|---|---|---|---|---|---|---|---|
| 2010 | 34 | BOS | 145 | 606 | 86 | 140 | 36 | 1 | 32 | 102 | 82 | 145 | .270 | .370 | .529 | .899 | 137 |
| 2011 | 35 | BOS | 146 | 605 | 84 | 162 | 40 | 1 | 29 | 96 | 78 | 83 | .309 | .398 | .554 | .953 | 154 |
| 2012 | 36 | BOS | 90 | 383 | 65 | 103 | 26 | 0 | 23 | 60 | 56 | 51 | .318 | .415 | .611 | 1.026 | 171 |
| 2013 | 37 | BOS | 36 | 151 | 25 | 45 | 11 | 0 | 9 | 35 | 16 | 16 | .336 | .404 | .619 | 1.023 | 167 |
At a time in his career when most players are in decline and struggling to keep their spot in the lineup, Ortiz just keeps rolling along, getting better each year.
For some perspective, Ortiz is a member of the following 3 groups:
- one of 35 players since 1901 with 3000+ PAs and OPS+ of 137 to 142 (Ortiz was 139) through age 31 (2007 season for Ortiz)
- one of 57 players since 1901 with 3000+ PAs and OPS+ of 132 to 137 (Ortiz was 134) through age 33 (2009 season for Ortiz)
- one of 68 players since 1901 with 1000+ PAs and OPS+ of 110 to 115 (Ortiz was 112) aged 32 and 33 (2008 and 2009 seasons for Ortiz)
In addition to Ortiz, 17 of the 35 players in group 1 were also in group 2. How did they do for the next 4 seasons, through age 37?
| Rk | Player | From | To | Age | G | PA | R | H | 2B | 3B | HR | RBI | BB | SO | Tm | |||||
|---|---|---|---|---|---|---|---|---|---|---|---|---|---|---|---|---|---|---|---|---|
| 1 | David Ortiz | 153 | 2010 | 2013 | 34-37 | 417 | 1745 | 260 | 450 | 113 | 2 | 93 | 293 | 232 | 295 | .300 | .393 | .564 | .956 | BOS |
| 2 | Rod Carew | 126 | 1980 | 1983 | 34-37 | 504 | 2181 | 285 | 617 | 100 | 15 | 10 | 168 | 228 | 180 | .325 | .396 | .409 | .805 | CAL |
| 3 | Jose Canseco | 122 | 1999 | 2001 | 34-36 | 287 | 1209 | 168 | 269 | 44 | 1 | 65 | 193 | 167 | 312 | .265 | .371 | .502 | .873 | TBD-TOT-CHW |
| 4 | Bobby Abreu | 116 | 2008 | 2011 | 34-37 | 604 | 2603 | 338 | 618 | 139 | 9 | 63 | 341 | 332 | 467 | .275 | .367 | .429 | .796 | NYY-LAA |
| 5 | Joe Medwick | 114 | 1946 | 1948 | 34-36 | 136 | 271 | 26 | 74 | 16 | 0 | 6 | 48 | 23 | 19 | .301 | .363 | .439 | .802 | BRO-STL |
| 6 | Bill Nicholson | 111 | 1949 | 1952 | 34-37 | 280 | 719 | 85 | 148 | 22 | 6 | 28 | 99 | 92 | 119 | .241 | .348 | .433 | .780 | PHI |
| 7 | Arky Vaughan | 110 | 1947 | 1948 | 35-36 | 129 | 297 | 43 | 71 | 8 | 2 | 5 | 47 | 48 | 19 | .285 | .401 | .394 | .794 | BRO |
| 8 | Mo Vaughn | 108 | 2002 | 2003 | 34-35 | 166 | 654 | 77 | 141 | 20 | 0 | 29 | 87 | 73 | 167 | .249 | .346 | .438 | .784 | NYM |
| 9 | Minnie Minoso | 108 | 1960 | 1963 | 34-37 | 454 | 1776 | 232 | 426 | 77 | 9 | 39 | 227 | 159 | 164 | .276 | .354 | .413 | .767 | CHW-STL-WSA |
| 10 | George Foster | 105 | 1983 | 1986 | 34-37 | 519 | 2056 | 228 | 477 | 71 | 7 | 87 | 295 | 138 | 381 | .252 | .305 | .435 | .740 | NYM-TOT |
| 11 | Edd Roush | 98 | 1927 | 1929 | 34-36 | 301 | 1303 | 179 | 360 | 51 | 14 | 17 | 123 | 85 | 39 | .304 | .353 | .414 | .768 | NYG |
| 12 | Jim Bottomley | 93 | 1934 | 1937 | 34-37 | 454 | 1738 | 199 | 449 | 98 | 23 | 25 | 234 | 113 | 134 | .279 | .329 | .415 | .744 | CIN-SLB |
| 13 | Danny Tartabull | 6 | 1997 | 1997 | 34-34 | 3 | 11 | 2 | 0 | 0 | 0 | 0 | 0 | 4 | 4 | .000 | .364 | .000 | .364 | PHI |
Nobody anywhere close to Big Papi. In fact, 5 of the 18 were done before age 34, and another 5 failed to compile even 750 PAs after that age. Of the rest, the median OPS+ is just 112.
If we look at the larger set of players in Group 1 as a whole, here is what they accomplished aged 34-37 (min. 1000 PAs).
| Rk | Player | PA | From | To | Age | G | R | H | 2B | 3B | HR | RBI | BB | SO | Tm | |||||
|---|---|---|---|---|---|---|---|---|---|---|---|---|---|---|---|---|---|---|---|---|
| 1 | David Ortiz | 153 | 1745 | 2010 | 2013 | 34-37 | 417 | 260 | 450 | 113 | 2 | 93 | 293 | 232 | 295 | .300 | .393 | .564 | .956 | BOS |
| 2 | Chipper Jones | 153 | 2207 | 2006 | 2009 | 34-37 | 515 | 357 | 595 | 117 | 10 | 95 | 334 | 334 | 298 | .321 | .422 | .549 | .972 | ATL |
| 3 | Willie Stargell | 148 | 1840 | 1974 | 1977 | 34-37 | 444 | 244 | 450 | 101 | 9 | 80 | 286 | 226 | 371 | .284 | .377 | .511 | .888 | PIT |
| 4 | Larry Walker | 146 | 2034 | 2001 | 2004 | 34-37 | 503 | 339 | 541 | 116 | 18 | 97 | 353 | 294 | 320 | .321 | .430 | .584 | 1.014 | COL-TOT |
| 5 | George Brett | 140 | 2324 | 1987 | 1990 | 34-37 | 538 | 310 | 612 | 131 | 15 | 72 | 348 | 269 | 208 | .303 | .382 | .490 | .872 | KCR |
| 6 | Jack Clark | 129 | 1349 | 1990 | 1992 | 34-36 | 336 | 166 | 263 | 41 | 2 | 58 | 182 | 256 | 311 | .245 | .390 | .450 | .840 | SDP-BOS |
| 7 | Rickey Henderson | 126 | 2075 | 1993 | 1996 | 34-37 | 481 | 357 | 450 | 83 | 5 | 45 | 162 | 389 | 266 | .273 | .416 | .411 | .827 | TOT-OAK-SDP |
| 8 | Rod Carew | 126 | 2181 | 1980 | 1983 | 34-37 | 504 | 285 | 617 | 100 | 15 | 10 | 168 | 228 | 180 | .325 | .396 | .409 | .805 | CAL |
| 9 | Carl Yastrzemski | 124 | 2546 | 1974 | 1977 | 34-37 | 602 | 354 | 612 | 105 | 8 | 78 | 343 | 344 | 222 | .283 | .378 | .447 | .826 | BOS |
| 10 | Eddie Murray | 123 | 2568 | 1990 | 1993 | 34-37 | 618 | 306 | 652 | 110 | 7 | 88 | 384 | 243 | 273 | .284 | .349 | .453 | .802 | LAD-NYM |
| 11 | Jose Canseco | 122 | 1209 | 1999 | 2001 | 34-36 | 287 | 168 | 269 | 44 | 1 | 65 | 193 | 167 | 312 | .265 | .371 | .502 | .873 | TBD-TOT-CHW |
| 12 | Bobby Abreu | 116 | 2603 | 2008 | 2011 | 34-37 | 604 | 338 | 618 | 139 | 9 | 63 | 341 | 332 | 467 | .275 | .367 | .429 | .796 | NYY-LAA |
| 13 | Ken Singleton | 109 | 2101 | 1981 | 1984 | 34-37 | 521 | 199 | 460 | 71 | 7 | 51 | 246 | 283 | 295 | .256 | .356 | .389 | .745 | BAL |
| 14 | Minnie Minoso | 108 | 1776 | 1960 | 1963 | 34-37 | 454 | 232 | 426 | 77 | 9 | 39 | 227 | 159 | 164 | .276 | .354 | .413 | .767 | CHW-STL-WSA |
| 15 | George Foster | 105 | 2056 | 1983 | 1986 | 34-37 | 519 | 228 | 477 | 71 | 7 | 87 | 295 | 138 | 381 | .252 | .305 | .435 | .740 | NYM-TOT |
| 16 | Tony Oliva | 102 | 1761 | 1973 | 1976 | 34-37 | 471 | 155 | 446 | 49 | 2 | 43 | 223 | 115 | 133 | .277 | .331 | .391 | .721 | MIN |
| 17 | Edd Roush | 98 | 1303 | 1927 | 1929 | 34-36 | 301 | 179 | 360 | 51 | 14 | 17 | 123 | 85 | 39 | .304 | .353 | .414 | .768 | NYG |
| 18 | Jim Bottomley | 93 | 1738 | 1934 | 1937 | 34-37 | 454 | 199 | 449 | 98 | 23 | 25 | 234 | 113 | 134 | .279 | .329 | .415 | .744 | CIN-SLB |
Again, Ortiz is the cream of the crop, sharing top spot with Chipper. Despite a stellar 137-142 OPS+ through age 31, almost half of this group failed to get 1000 PAs after age 34.
Jose Canseco’s totals are highlighted above – he followed Ortiz’s early-30s pattern exactly and is the only player to appear with Ortiz in all three of the groups.
How has Ortiz’s performance aged 34-37 compared to all players of that age?
| Rk | Player | PA | From | To | Age | G | R | H | 2B | 3B | HR | RBI | BB | SO | Tm | |||||
|---|---|---|---|---|---|---|---|---|---|---|---|---|---|---|---|---|---|---|---|---|
| 1 | Barry Bonds | 221 | 2317 | 1999 | 2002 | 34-37 | 541 | 466 | 545 | 111 | 10 | 202 | 436 | 565 | 279 | .318 | .489 | .748 | 1.237 | SFG |
| 2 | Babe Ruth | 206 | 2515 | 1929 | 1932 | 34-37 | 558 | 540 | 713 | 98 | 23 | 182 | 607 | 466 | 234 | .355 | .478 | .699 | 1.177 | NYY |
| 3 | Ted Williams | 198 | 1555 | 1953 | 1956 | 34-37 | 388 | 258 | 422 | 78 | 6 | 94 | 288 | 348 | 105 | .353 | .497 | .663 | 1.161 | BOS |
| 4 | Mark McGwire | 180 | 2027 | 1998 | 2001 | 34-37 | 494 | 356 | 425 | 54 | 1 | 196 | 431 | 427 | 492 | .272 | .429 | .683 | 1.112 | STL |
| 5 | Hank Aaron | 168 | 2486 | 1968 | 1971 | 34-37 | 596 | 382 | 654 | 111 | 11 | 158 | 419 | 296 | 230 | .302 | .385 | .583 | .968 | ATL |
| 6 | Tris Speaker | 167 | 2306 | 1922 | 1925 | 34-37 | 534 | 391 | 713 | 178 | 33 | 49 | 353 | 312 | 51 | .372 | .463 | .577 | 1.040 | CLE |
| 7 | Honus Wagner | 167 | 2430 | 1908 | 1911 | 34-37 | 568 | 369 | 705 | 135 | 53 | 28 | 379 | 246 | 127 | .337 | .412 | .492 | .904 | PIT |
| 8 | Nap Lajoie | 163 | 2051 | 1909 | 1912 | 34-37 | 494 | 252 | 659 | 138 | 19 | 7 | 273 | 149 | 63 | .361 | .416 | .470 | .886 | CLE |
| 9 | Edgar Martinez | 158 | 2623 | 1997 | 2000 | 34-37 | 604 | 376 | 707 | 147 | 3 | 118 | 441 | 418 | 376 | .328 | .438 | .563 | 1.002 | SEA |
| 10 | Willie Mays | 155 | 2384 | 1965 | 1968 | 34-37 | 598 | 384 | 608 | 92 | 14 | 134 | 364 | 264 | 325 | .290 | .369 | .540 | .909 | SFG |
| 11 | Stan Musial | 154 | 2465 | 1955 | 1958 | 34-37 | 579 | 330 | 698 | 136 | 16 | 106 | 381 | 293 | 138 | .328 | .409 | .556 | .964 | STL |
| 12 | David Ortiz | 153 | 1745 | 2010 | 2013 | 34-37 | 417 | 260 | 450 | 113 | 2 | 93 | 293 | 232 | 295 | .300 | .393 | .564 | .956 | BOS |
| 13 | Chipper Jones | 153 | 2207 | 2006 | 2009 | 34-37 | 515 | 357 | 595 | 117 | 10 | 95 | 334 | 334 | 298 | .321 | .422 | .549 | .972 | ATL |
| 14 | Manny Ramirez | 153 | 2212 | 2006 | 2009 | 34-37 | 520 | 327 | 572 | 120 | 5 | 111 | 374 | 329 | 399 | .312 | .419 | .564 | .983 | BOS-TOT-LAD |
| 15 | Roberto Clemente | 153 | 1991 | 1969 | 1972 | 34-37 | 480 | 302 | 616 | 90 | 37 | 56 | 297 | 149 | 253 | .339 | .387 | .521 | .908 | PIT |
| 16 | Mickey Mantle | 153 | 1493 | 1966 | 1968 | 34-36 | 396 | 160 | 307 | 43 | 2 | 63 | 165 | 270 | 286 | .254 | .388 | .450 | .838 | NYY |
Pretty heady company. Almost every player ahead of Big Papi has made the HOF. But, watch what happens if we look at age 35-37.
| Rk | Player | PA | From | To | Age | G | R | H | 2B | 3B | HR | RBI | BB | SO | Tm | |||||
|---|---|---|---|---|---|---|---|---|---|---|---|---|---|---|---|---|---|---|---|---|
| 1 | Barry Bonds | 237 | 1883 | 2000 | 2002 | 35-37 | 439 | 375 | 452 | 91 | 8 | 168 | 353 | 492 | 217 | .333 | .512 | .782 | 1.295 | SFG |
| 2 | Babe Ruth | 210 | 1928 | 1930 | 1932 | 35-37 | 423 | 419 | 541 | 72 | 17 | 136 | 453 | 394 | 174 | .359 | .492 | .699 | 1.192 | NYY |
| 3 | Ted Williams | 193 | 1445 | 1954 | 1956 | 35-37 | 351 | 241 | 385 | 72 | 6 | 81 | 254 | 329 | 95 | .348 | .497 | .644 | 1.140 | BOS |
| 4 | Hank Aaron | 173 | 1810 | 1969 | 1971 | 35-37 | 436 | 298 | 480 | 78 | 7 | 129 | 333 | 232 | 168 | .308 | .397 | .616 | 1.012 | ATL |
| 5 | Nap Lajoie | 167 | 1530 | 1910 | 1912 | 35-37 | 366 | 196 | 507 | 105 | 12 | 6 | 226 | 114 | 44 | .374 | .429 | .483 | .912 | CLE |
| 6 | Tris Speaker | 164 | 1788 | 1923 | 1925 | 35-37 | 403 | 306 | 552 | 130 | 25 | 38 | 282 | 235 | 40 | .371 | .460 | .568 | 1.028 | CLE |
| 7 | Mark McGwire | 163 | 1346 | 1999 | 2001 | 35-37 | 339 | 226 | 273 | 33 | 1 | 126 | 284 | 265 | 337 | .259 | .409 | .650 | 1.058 | STL |
| 8 | David Ortiz | 162 | 1139 | 2011 | 2013 | 35-37 | 272 | 174 | 310 | 77 | 1 | 61 | 191 | 150 | 150 | .315 | .405 | .582 | .987 | BOS |
| 9 | Edgar Martinez | 156 | 1945 | 1998 | 2000 | 35-37 | 449 | 272 | 528 | 112 | 2 | 90 | 333 | 299 | 290 | .327 | .432 | .566 | .999 | SEA |
| 10 | Honus Wagner | 154 | 1789 | 1909 | 1911 | 35-37 | 417 | 269 | 504 | 96 | 34 | 18 | 270 | 192 | 105 | .331 | .410 | .474 | .884 | PIT |
And, age 36-37 (min. 500 PAs).
| Rk | Player | PA | From | To | Age | G | R | H | 2B | 3B | HR | RBI | BB | SO | Tm | |||||
|---|---|---|---|---|---|---|---|---|---|---|---|---|---|---|---|---|---|---|---|---|
| 1 | Barry Bonds | 263 | 1276 | 2001 | 2002 | 36-37 | 296 | 246 | 305 | 63 | 4 | 119 | 247 | 375 | 140 | .347 | .547 | .834 | 1.381 | SFG |
| 2 | Babe Ruth | 210 | 1252 | 1931 | 1932 | 36-37 | 278 | 269 | 355 | 44 | 8 | 87 | 300 | 258 | 113 | .358 | .492 | .682 | 1.174 | NYY |
| 3 | Ted Williams | 188 | 919 | 1955 | 1956 | 36-37 | 234 | 148 | 252 | 49 | 5 | 52 | 165 | 193 | 63 | .350 | .487 | .649 | 1.136 | BOS |
| 4 | David Ortiz | 171 | 534 | 2012 | 2013 | 36-37 | 126 | 90 | 148 | 37 | 0 | 32 | 95 | 72 | 67 | .323 | .412 | .614 | 1.026 | BOS |
| 5 | Hank Aaron | 170 | 1171 | 1970 | 1971 | 36-37 | 289 | 198 | 316 | 48 | 4 | 85 | 236 | 145 | 121 | .313 | .397 | .620 | 1.017 | ATL |
| 6 | Manny Ramirez | 161 | 1085 | 2008 | 2009 | 36-37 | 257 | 164 | 285 | 60 | 3 | 56 | 184 | 158 | 205 | .315 | .425 | .574 | .999 | TOT-LAD |
| 7 | Dave Winfield | 159 | 631 | 1988 | 1988 | 36-36 | 149 | 96 | 180 | 37 | 2 | 25 | 107 | 69 | 88 | .322 | .398 | .530 | .927 | NYY |
| 8 | Stan Musial | 159 | 1128 | 1957 | 1958 | 36-37 | 269 | 146 | 335 | 73 | 5 | 46 | 164 | 138 | 60 | .344 | .422 | .571 | .993 | STL |
| 9 | Edgar Martinez | 155 | 1273 | 1999 | 2000 | 36-37 | 295 | 186 | 349 | 66 | 1 | 61 | 231 | 193 | 194 | .330 | .434 | .567 | 1.002 | SEA |
| 10 | Tris Speaker | 153 | 1093 | 1924 | 1925 | 36-37 | 253 | 173 | 334 | 71 | 14 | 21 | 152 | 142 | 25 | .365 | .454 | .542 | .997 | CLE |
To be sure, Ortiz still has more than half his age 37 season to play. But, he will likely stay in the top 5, either just ahead of or just behind Aaron. So, how has he done it?
Part of the answer is probably his conditioning. Take a look.
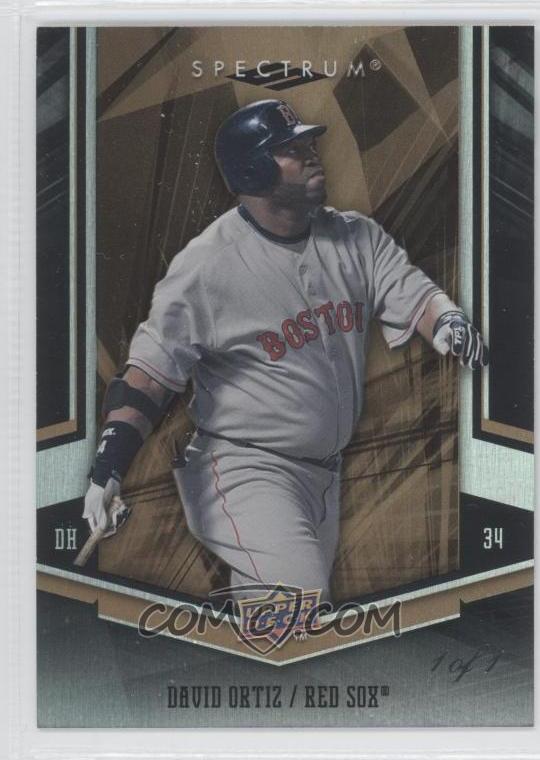
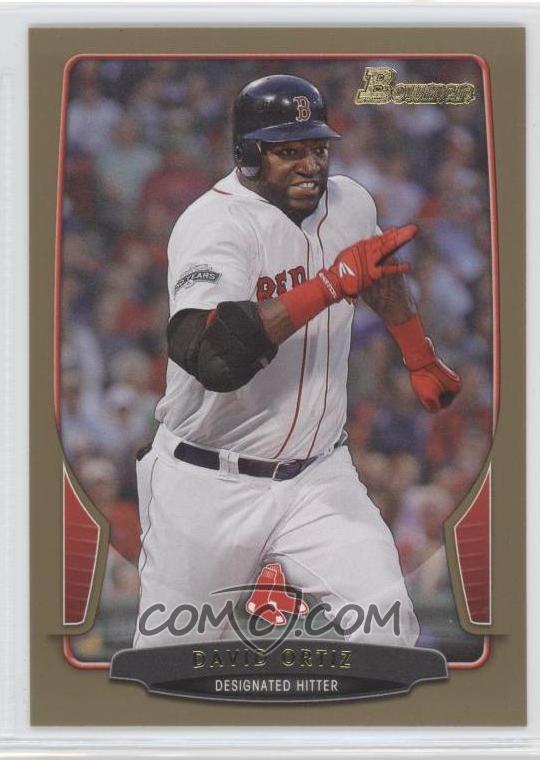
That’s David’s 2008 card on the left, and 2013 on the right. Certainly seems as if he’s been spending more time in the weight room and less at the buffet table. Which is unusual for players his age who are more likely to have similar before and after images reversed.
What Ortiz has done that is normal for successful players his age is the time-honored tactic of cutting down on his strikeouts and increasing his walks. Here’s what those numbers look like for Ortiz, showing BB and SO as as % of PAs.
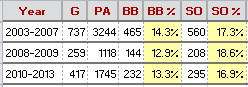
Perhaps not huge differences, but consistent with Ortiz being off his game in 2008-2009. If we break out the last period season by season the picture gets clearer.
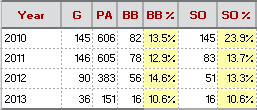
So, strikeouts are certainly the larger part of the answer. How has Ortiz managed to cut down his whiffs so markedly?
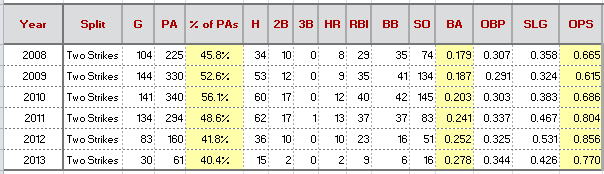
Evidently, Ortiz has been saving his swings for better pitches. His proportion of PAs that go to two strikes dropped by over 25% from 2010 to 2012, while his batting average and OPS in those situations improved by almost as much (24.1% and 24.8%).
Among all hitters (not just power guys), Ortiz’s rank in two strike batting average (min. 150 PAs in the split) improved from 193rd in 2008 to 14th in 2012. For OPS in this split, Ortiz improved from 41st in 2008 to 1st in 2012. And it wasn’t close – take a look.
| Rk | Player | Split | Year | G | PA | H | 2B | 3B | HR | RBI | BB | SO | |||||
|---|---|---|---|---|---|---|---|---|---|---|---|---|---|---|---|---|---|
| 1 | David Ortiz | Two Strikes | 2012 | 83 | .856 | 160 | 36 | 10 | 0 | 10 | 23 | 16 | 51 | .252 | .325 | .531 | .856 |
| 2 | Andrew McCutchen | Two Strikes | 2012 | 148 | .797 | 325 | 76 | 9 | 3 | 18 | 40 | 24 | 132 | .255 | .311 | .487 | .797 |
| 3 | Edwin Encarnacion | Two Strikes | 2012 | 143 | .794 | 348 | 73 | 9 | 0 | 21 | 46 | 37 | 94 | .238 | .322 | .472 | .794 |
| 4 | Joey Votto | Two Strikes | 2012 | 106 | .784 | 241 | 50 | 20 | 0 | 2 | 16 | 43 | 85 | .256 | .394 | .390 | .784 |
| 5 | Prince Fielder | Two Strikes | 2012 | 149 | .774 | 304 | 72 | 14 | 1 | 11 | 39 | 25 | 84 | .265 | .329 | .445 | .774 |
| 6 | Ryan Braun | Two Strikes | 2012 | 145 | .770 | 324 | 74 | 17 | 2 | 14 | 43 | 24 | 128 | .249 | .309 | .461 | .770 |
| 7 | Jayson Werth | Two Strikes | 2012 | 75 | .759 | 195 | 50 | 14 | 0 | 2 | 18 | 20 | 57 | .286 | .359 | .400 | .759 |
| 8 | Matt Carpenter | Two Strikes | 2012 | 94 | .758 | 186 | 44 | 11 | 3 | 2 | 22 | 19 | 63 | .268 | .349 | .409 | .758 |
| 9 | Martin Prado | Two Strikes | 2012 | 145 | .757 | 344 | 93 | 26 | 3 | 6 | 38 | 15 | 69 | .286 | .317 | .440 | .757 |
| 10 | Jed Lowrie | Two Strikes | 2012 | 90 | .731 | 187 | 36 | 6 | 0 | 10 | 19 | 19 | 65 | .216 | .299 | .431 | .731 |
| 11 | Buster Posey | Two Strikes | 2012 | 138 | .727 | 320 | 73 | 18 | 0 | 6 | 39 | 35 | 96 | .261 | .338 | .389 | .727 |
| 12 | Jose Bautista | Two Strikes | 2012 | 86 | .716 | 218 | 38 | 8 | 0 | 10 | 26 | 29 | 63 | .202 | .312 | .404 | .716 |
| 13 | Miguel Cabrera | Two Strikes | 2012 | 148 | .714 | 303 | 64 | 19 | 0 | 11 | 36 | 25 | 98 | .232 | .294 | .420 | .714 |
| 14 | Evan Longoria | Two Strikes | 2012 | 72 | .701 | 155 | 28 | 6 | 0 | 7 | 24 | 18 | 61 | .206 | .297 | .404 | .701 |
| 15 | Joe Mauer | Two Strikes | 2012 | 139 | .700 | 340 | 81 | 13 | 3 | 4 | 44 | 31 | 88 | .266 | .332 | .367 | .700 |
| 16 | Mike Trout | Two Strikes | 2012 | 132 | .699 | 336 | 71 | 11 | 2 | 7 | 26 | 38 | 139 | .242 | .333 | .365 | .699 |
| 17 | Adrian Beltre | Two Strikes | 2012 | 141 | .694 | 305 | 73 | 9 | 2 | 13 | 37 | 7 | 82 | .248 | .269 | .425 | .694 |
| 18 | John Jaso | Two Strikes | 2012 | 92 | .694 | 175 | 36 | 6 | 1 | 4 | 18 | 19 | 51 | .237 | .326 | .368 | .694 |
| 19 | Mark Teixeira | Two Strikes | 2012 | 115 | .693 | 244 | 42 | 9 | 1 | 10 | 32 | 29 | 83 | .199 | .299 | .393 | .693 |
| 20 | Adam Jones | Two Strikes | 2012 | 152 | .691 | 338 | 75 | 13 | 2 | 11 | 26 | 19 | 126 | .239 | .293 | .398 | .691 |
If you haven’t been paying much attention to David Ortiz recently, you should … before it’s too late. It could be a long time before you see a comparable performance by a player in his late 30s.