Monthly Archives: January 2014

The rise and fall of the non-starter

Here’s a simple plot showing, by year, the percentage of all plate appearances given each year to any non-starter, as well as the percentage given to pinch-hitters specifically.

nonstarters

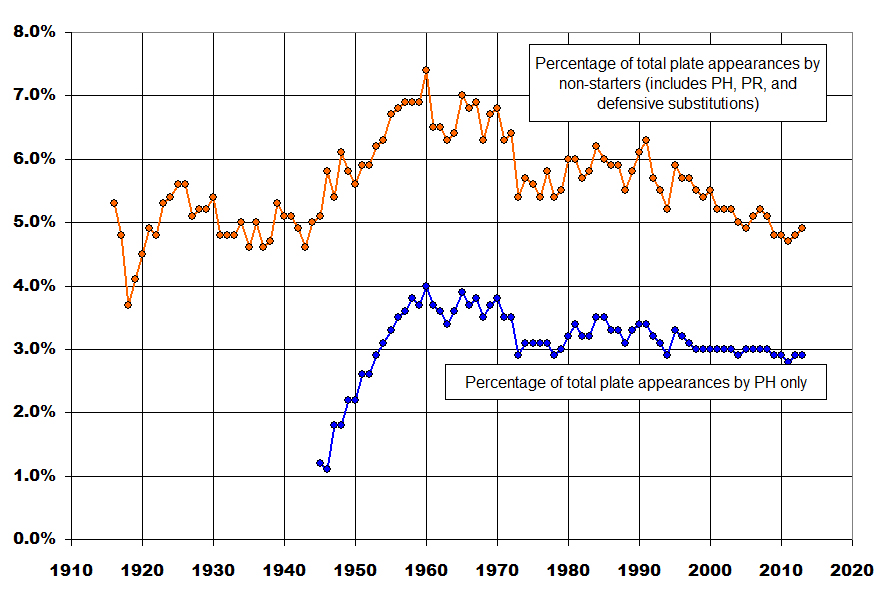
The pinch-hitter data goes back only to 1945 (the limit of full play-by-play availability) and happens to coincide with a dramatic increase in the use of the pinch-hitter in baseball. From 1945 until 1960, nearly 3% more of all plate appearances went to pinch-hitters, singlehandedly accounting for the same increase among all non-starters.

Since that time, pinch-hitter use has tapered off slowly, falling about 1 percentage point over the 50 or so intervening years, while overall non-starter plate appearances have dropped by more than double that amount. The reason is likely a drop in defensive substitutions. It’s clear that defense is better now than ever and fewer teams carry defensive specialists, instead opting in most cases to keep good reserve bats on the bench. The effect may also be due to the overall emphasis on offense, with teams seemingly more likely to keep a good player in the game because of his bat, rather than removing him for a better glove man.

Circle of Greats 1934 Part 1 Results: Hank Goodness (It’s Friday)!

Henry Aaron won the voting this round by a significant margin, despite competing against several other great stars. Sort of the way he took over the career home run title with his steadily great performance from the 1950s through the 1970s, passing by other renowned stars of his era.  Hank becomes the 44th player inducted into the High Heat Stats Circle of Greats.  More on Aaron and the voting after the jump. Continue reading

Toughest Pitchers to Score Against Since 1961

Earned Run Average (ERA) is, of course, the standard measuring stick of pitcher effectiveness, based on the inescapable logic that the pitcher’s ONLY job is to prevent runs from scoring (while the more elemental Runs Allowed Average would presumably be the metric that most closely correlates to run prevention, in the interests of being “fair” to pitchers and not judging them based, in part, on the errors made by their defense, I will defer to convention and concede that ERA is THE “go to” measurement).

But, how does a pitcher compile a low ERA? Firstly, of course, by limiting the runners who reach base and, then, limiting the baserunners who score. This post will break down those two attributes of pitcher skill and look at the pitchers of the past 5 decades plus who have been most proficient in each.

Continue reading

Slide, Billy, Slide! … but above all, HIT!

Buster Olney musing about Billy Hamilton‘s upcoming rookie year:

… given his incredible prowess on the bases, it may not be necessary for Hamilton to produce within the standard models for leadoff hitters. If Hamilton has a .300 on-base percentage, for example — and that may be what the Reds could reasonably expect in Hamilton’s first year in the big leagues — he could still score a whole lot of runs because his singles and walks tend to lead to him standing on second or third base shortly thereafter.

A whole lot of runs, with a .300 OBP — really? The Reds averaged 4.3 R/G last year, and they’ll be lucky to match that after losing their second-best hitter, Shin-Soo Choo. Is there a precedent for what Buster suggests?

Continue reading

Schreck as in heck (of a pitching staff)

No, not that Shrek. This one is catcher Ossee Schrecongost (I ran into Ossee in my last quiz, by dint of his 3 qualifying seasons with matching HR and triples: one with deuces; and two with singletons). Ossee played around the turn of the 20th century (and happily also went by the shorter “Schreck”). As I scrolled down his player page, I was struck by this:

Def. Games as C s c a p y
1901 AL  72 (5th)
1902 AL  71 (5th)
1903 AL  77 (2nd)
1904 AL  84 (4th)
1905 AL  114 (1st)
1906 AL  89 (3rd)
1907 AL  99 (4th)

      Putouts as C s c a p y
1902 AL  367 (1st)
1903 AL  514 (1st)
1904 AL  589 (1st) 
1905 AL  790 (1st) 
1906 AL  532 (1st) 
1907 AL  640 (1st) 

So, six straight seasons leading AL catchers in putouts (i.e. mostly catching his pitchers’ strikeouts) despite ranking mostly in the middle of the pack in games caught (excepting his one season leading the AL, Schreck played between 16 and 29 games fewer than the catcher placing first in games caught).

More on strikeout-dominant pitching staffs after the jump.

Continue reading

COG 1935 Results: Voters Choose To Be Perfectly Frank (almost)

Frank Robinson faced powerful competition from two fellow-newcomers to the ballot with strong historical reputations, Bob Gibson and Sandy Koufax.  But Robinson received heavy support from voters and led pretty much throughout the balloting.  He appeared on 58 ballots, the most since Rickey Henderson received 60 votes thirty-one rounds ago.  Frank becomes the 43rd player inducted into the High Heat Stats Circle of Greats.   More on Robinson and the voting after the jump. Continue reading

Yankees Wrap Up Pricey Offseason By Adding Masahiro Tanaka

After a tedious month filled with plenty of patience and very little news, Japanese ace Masahiro Tanaka finally broke the freeze, signing a 7 year/$155 million dollar deal with the New York Yankees. If you’ve been paying any attention at all this offseason, the Tanaka signing should come as no surprise. That much discussed luxury tax number, $189 million, they Yankees were hoping avoid was always a pipe dream and after the big money signings of Brian McCann, Jacoby Ellsbury, and Carlos Beltran, New York almost had to sign Tanaka to upgrade what appeared to be a league average pitching staff. Continue reading

How Trammaker Missed the Hall, and assorted thoughts

Wrapping up my miniseries on Alan Trammell and Lou Whitaker with a look at how timing hurt their Hall of Fame chances, and a bunch of other stuff. Throughout this post, all seasons are projected to 162 games unless noted.

Timing hurt their HOF chances in many ways, but I’ll detail two major factors:

  • Offense soared just as they were on their way out. Comparing Trammaker’s 1978-93 prime to the next 16 years, AL scoring rose by 12%.
  • More great middle infielders played during Trammaker’s time than any other in MLB history, including three of the seven best (Joe Morgan, Cal Ripken and Alex Rodriguez).

There’s a third factor whose effect I can’t gauge, so let’s start with the certainties.

Continue reading