
Alan Trammell‘s Hall of Fame support fell to 21% on this year’s ballot; in two years, he’ll join Lou Whitaker in veterans committee limbo. To channel my grief, I’ve been shaping some thoughts about them. This post is about peak WAR and career value patterns for a 2B/SS tandem.
The preference for high-peak players is one reason that Trammell and Whitaker are not in the Hall of Fame, despite career WAR totals and per-game rates that are above the median for HOFers at their positions. The Detroit duo was unusually consistent at a level just below the top rank, combining for 21 individual seasons of 4.1 to 6.7 WAR, but just one season above that.
High peaks are favored for their pennant impact, and I’m not here to challenge that. But thinking of Trammell and Whitaker as a unit — Trammaker, if I may — made me curious: Would the peak/pennant link hold true for pairs of outstanding teammates? If the members of a 2B/SS tandem each had the same career value as Trammaker, but a more normal high-low pattern, how would their combined value patterns compare?
A normal distribution of high and low years for a tandem should create some double-highs, a few double-lows, and more years that sort of balance out. Let’s see how that looks with some examples.
There aren’t enough actual pairs of long-term star teammates to study properly. So I formed three tandems out of Hall of Famers with WAR totals and rates similar to Trammaker. Career WAR stats:
- 2B Frankie Frisch —- 70.4 WAR … 30.5 per 1,000 G … Best 4 years avg. 7.6
SS Luke Appling —— 74.5 WAR … 30.8 per 1,000 G … Best 4 years avg. 6.9 - 2B Ryne Sandberg — 67.6 WAR … 31.2 per 1,000 G … Best 4 years avg. 7.6
SS Ozzie Smith ——- 76.5 WAR … 29.7 per 1,000 G … Best 4 years avg. 6.7 - 2B Roberto Alomar — 66.8 WAR … 28.1 per 1,000 G … Best 4 years avg. 7.1
SS Barry Larkin ——– 70.2 WAR … 32.2 per 1,000 G … Best 4 years avg. 6.6 - 2B Lou Whitaker —— 74.8 WAR … 31.3 per 1,000 G … Best 4 years avg. 6.1
SS Alan Trammell —- 70.3 WAR … 30.7 per 1,000 G … Best 4 years avg. 7.0
Each pair averaged 68.5-72.5 career WAR, and 30-31 WAR per 1,000 games.
Trammaker had an outstanding 16-year run together, so I took the best 16-year WAR span for each player. For each pair, I just lined up those blocks side-by-side, in chronological order, and summed the tandem’s WAR for the matched years. This method puts each tandem’s members fairly close in age, separated by one to three years. I adjusted the WAR for strike years but not for the 154-game schedule, a decision I’ll explain in the notes.
I looked at the averages in all sorts of ways, and settled on this simple presentation:
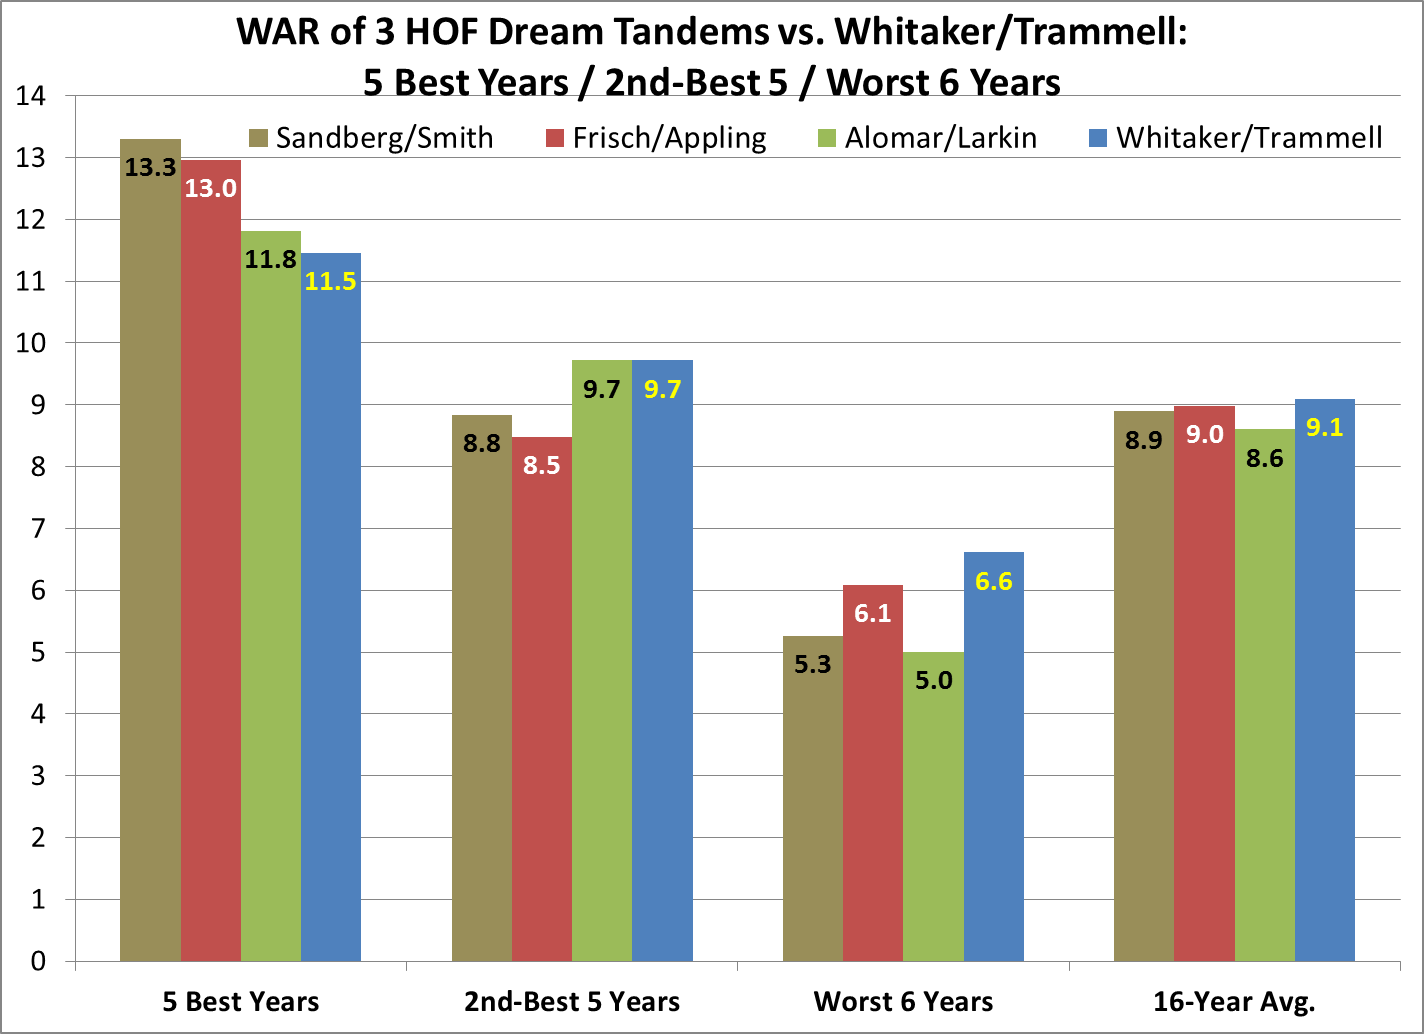
As expected, the HOF tandems all trump Trammaker in 5 Best Years, though the margin in one case is trivial. In 2nd-Best 5 and Worst 6 Years, Whitaker/Trammell are unsurpassed.
Rankings aren’t the point here, but … how would you rank them? I have Sandberg/Smith and Frisch/Appling ahead of the others, and very close to each other. I rate Whitaker/Trammell ahead of Alomar/Larkin, despite a small deficit in 5-best years.
For context, how many times from 1978-93 did an actual 2B/SS tandem besides Trammaker reach some of the levels on that chart?
- 13.0+ WAR (elite of the 5 Best Years) — 2 seasons
- 11.5+ WAR (Trammaker’s 5 Best Years) — 7 seasons
- 9.7+ WAR (Trammaker’s 2nd-Best 5 Years) — 14 seasons
Back to the value patterns. The next charts show the 16 years in chronological order; for a cleaner look at the curves, I’ll show them separately, first the 3 HOF tandems combined, then Whitaker/Trammell. This is more about the shape of the curves than the particular numbers; combining the HOF tandems smoothes the curve for a better sense of what is typical.
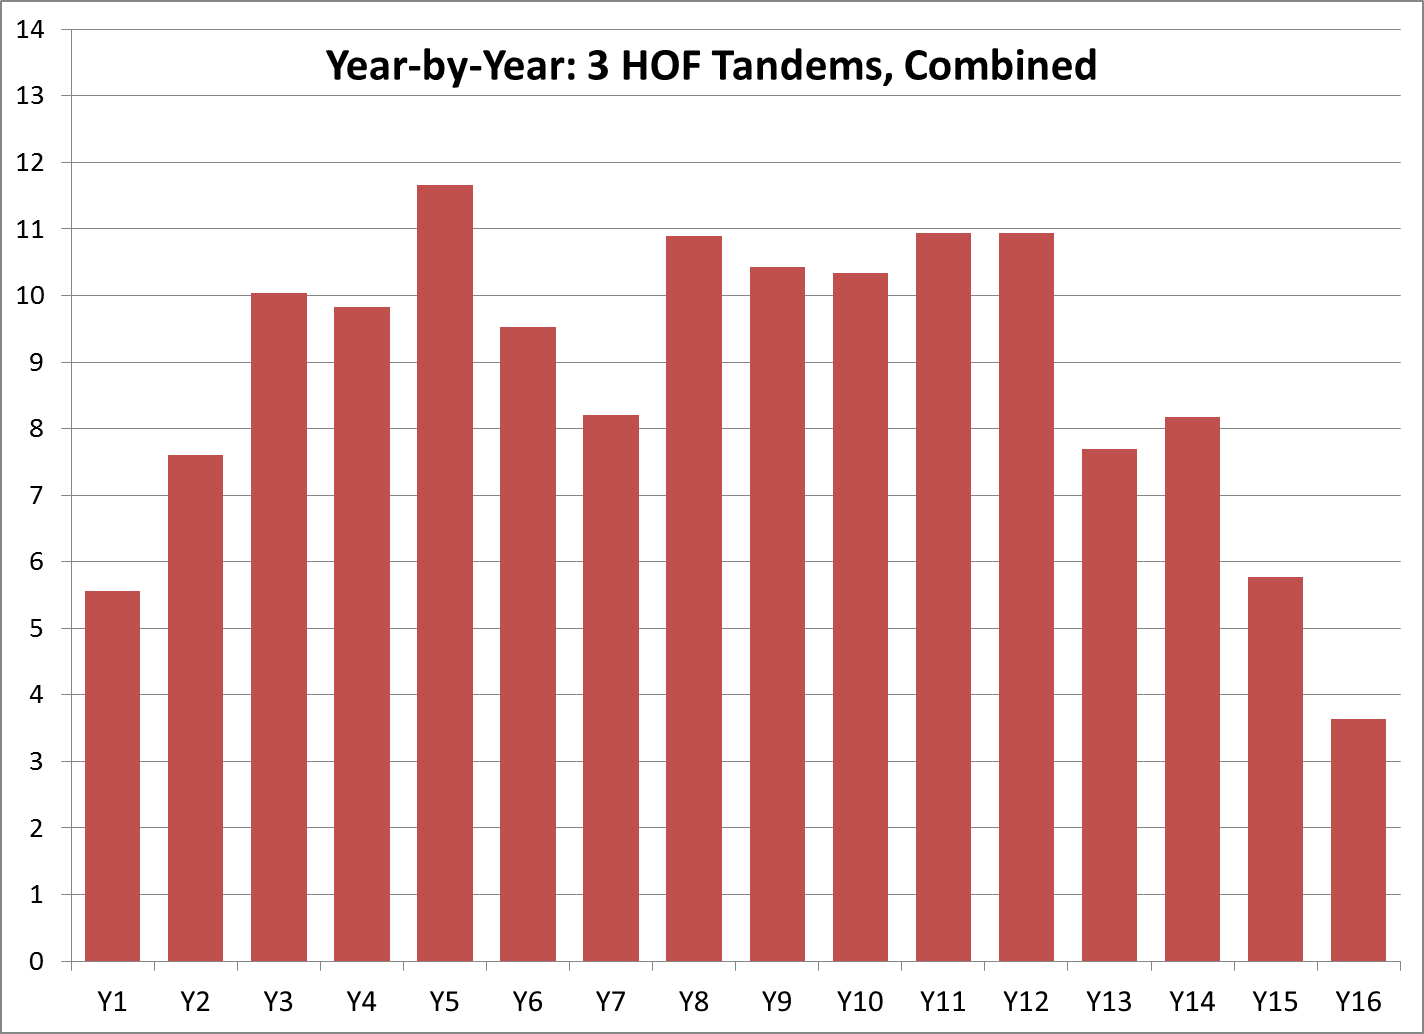
The combined HOF tandems show a pretty normal curve — a little flat in the middle, but otherwise typical. Now for Whitaker/Trammell:
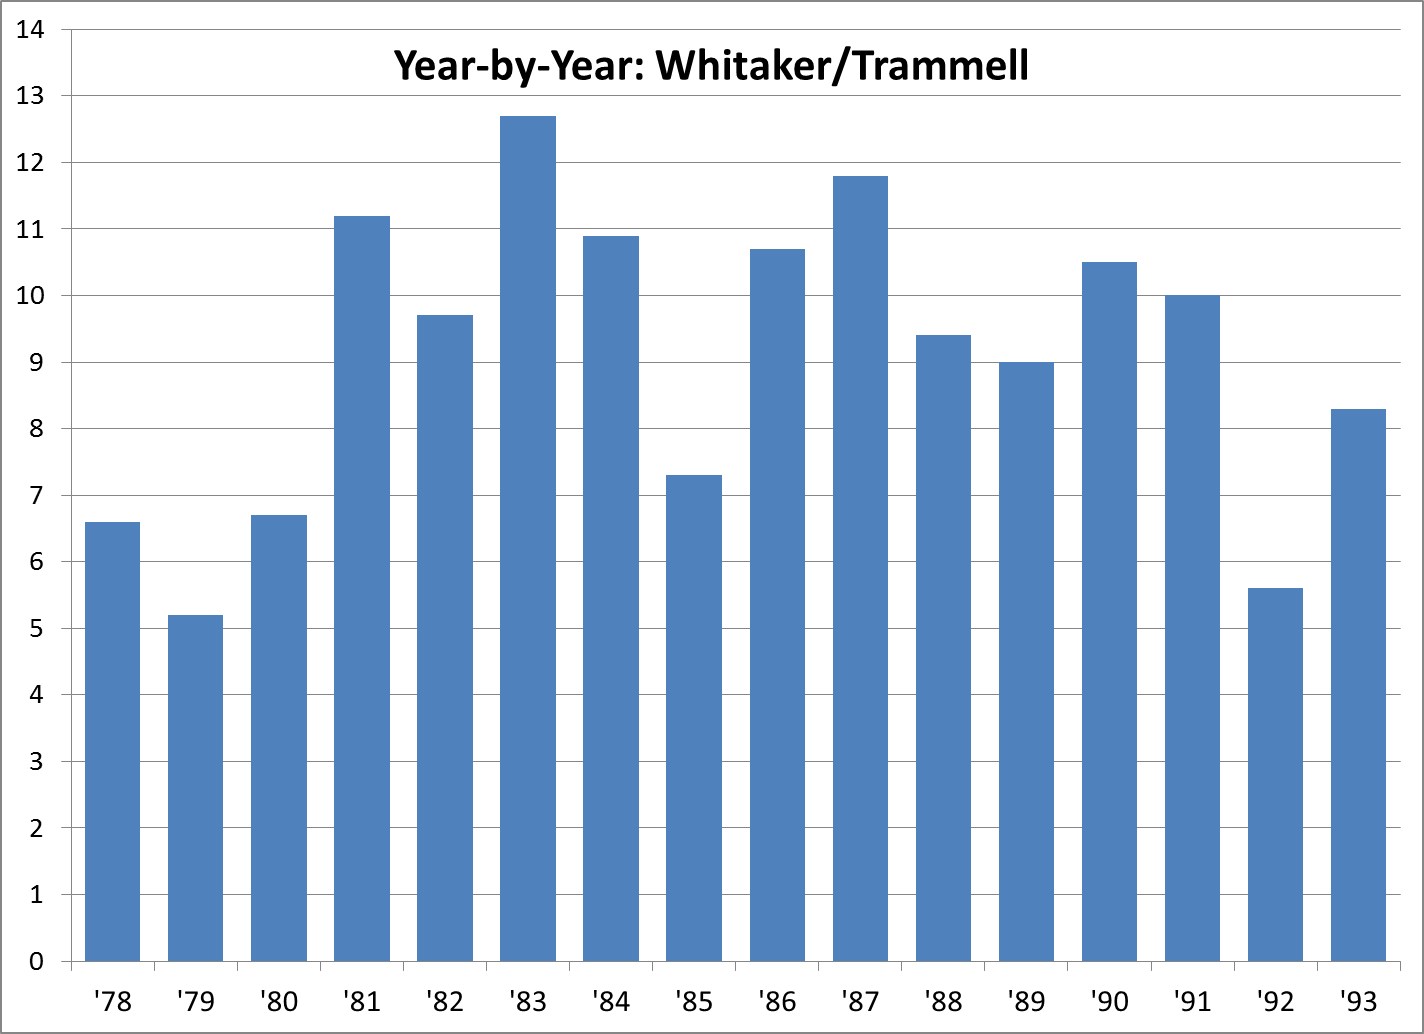
Trammaker peaked a little later, and declined more slowly. Comparing four-year quarters by percent of total:
- Q1 — 23% HOF, 20% Trammaker
- Q2 — 29% HOF, 28% Trammaker (halfway totals 52% and 48%)
- Q3 — 30% HOF, 28% Trammaker
- Q4 — 18% HOF, 24% Trammaker.
Now the 16 years in order of best WAR, for Whitaker/Trammell and for the HOF tandems combined:
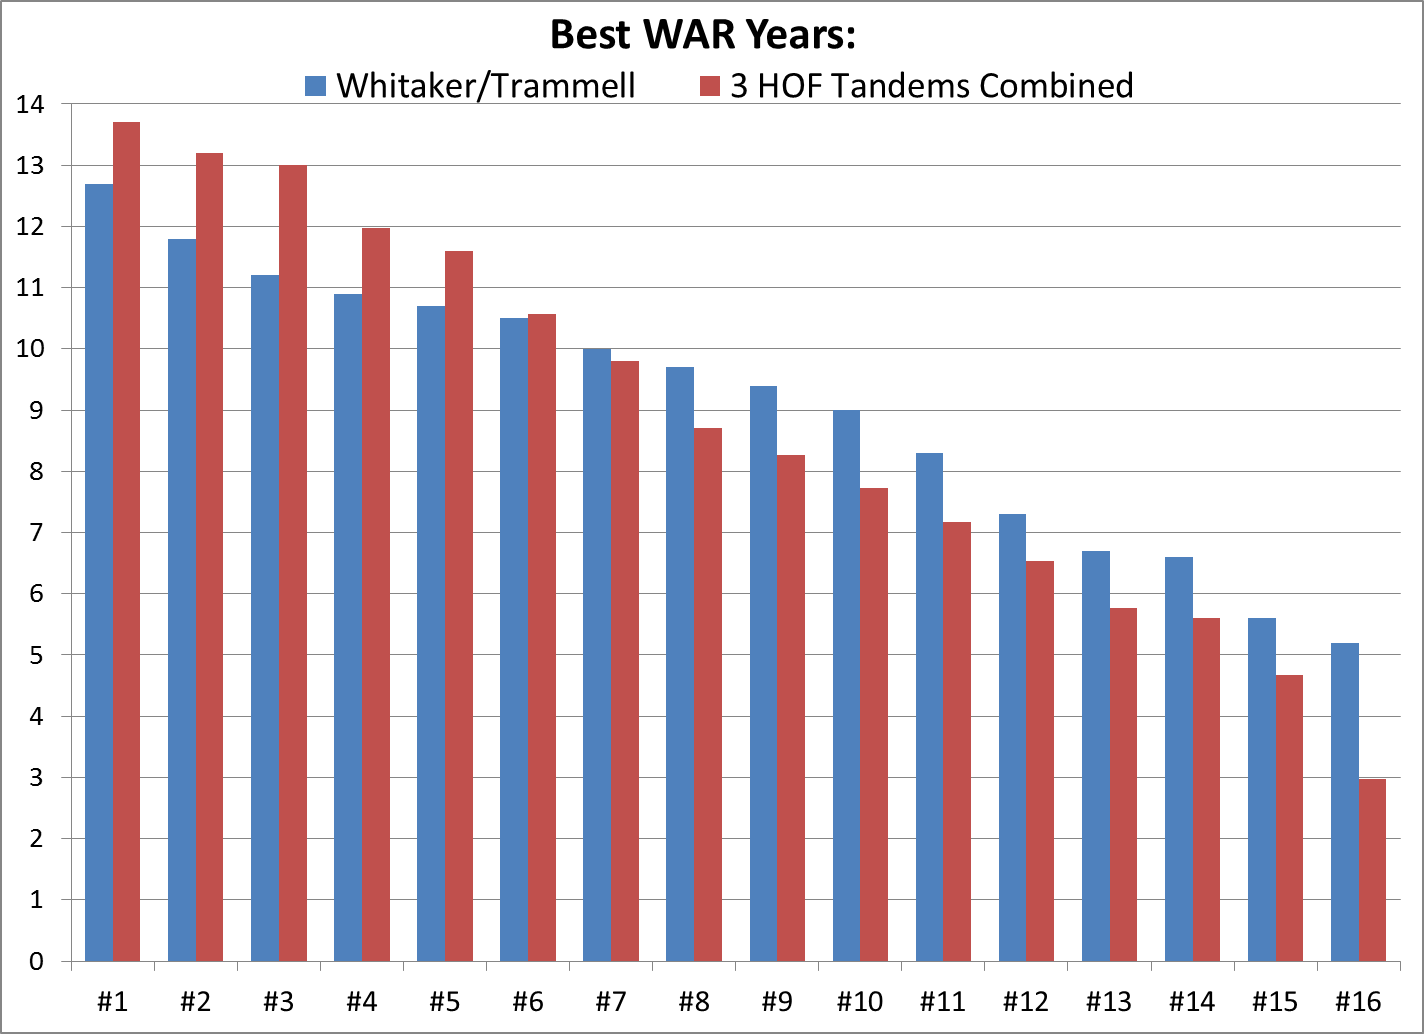
The HOF amalgam lead #1-5 by an average of 1.2 WAR (12.5-11.5). The 6th and 7th years are basically even. Whitaker/Trammell lead the 8th through 16th by an average of 1.1 WAR (7.5-6.4); by year 13, they go ahead in career WAR.
For completeness, the best-years charts for Whitaker/Trammell versus each HOF tandem individually:
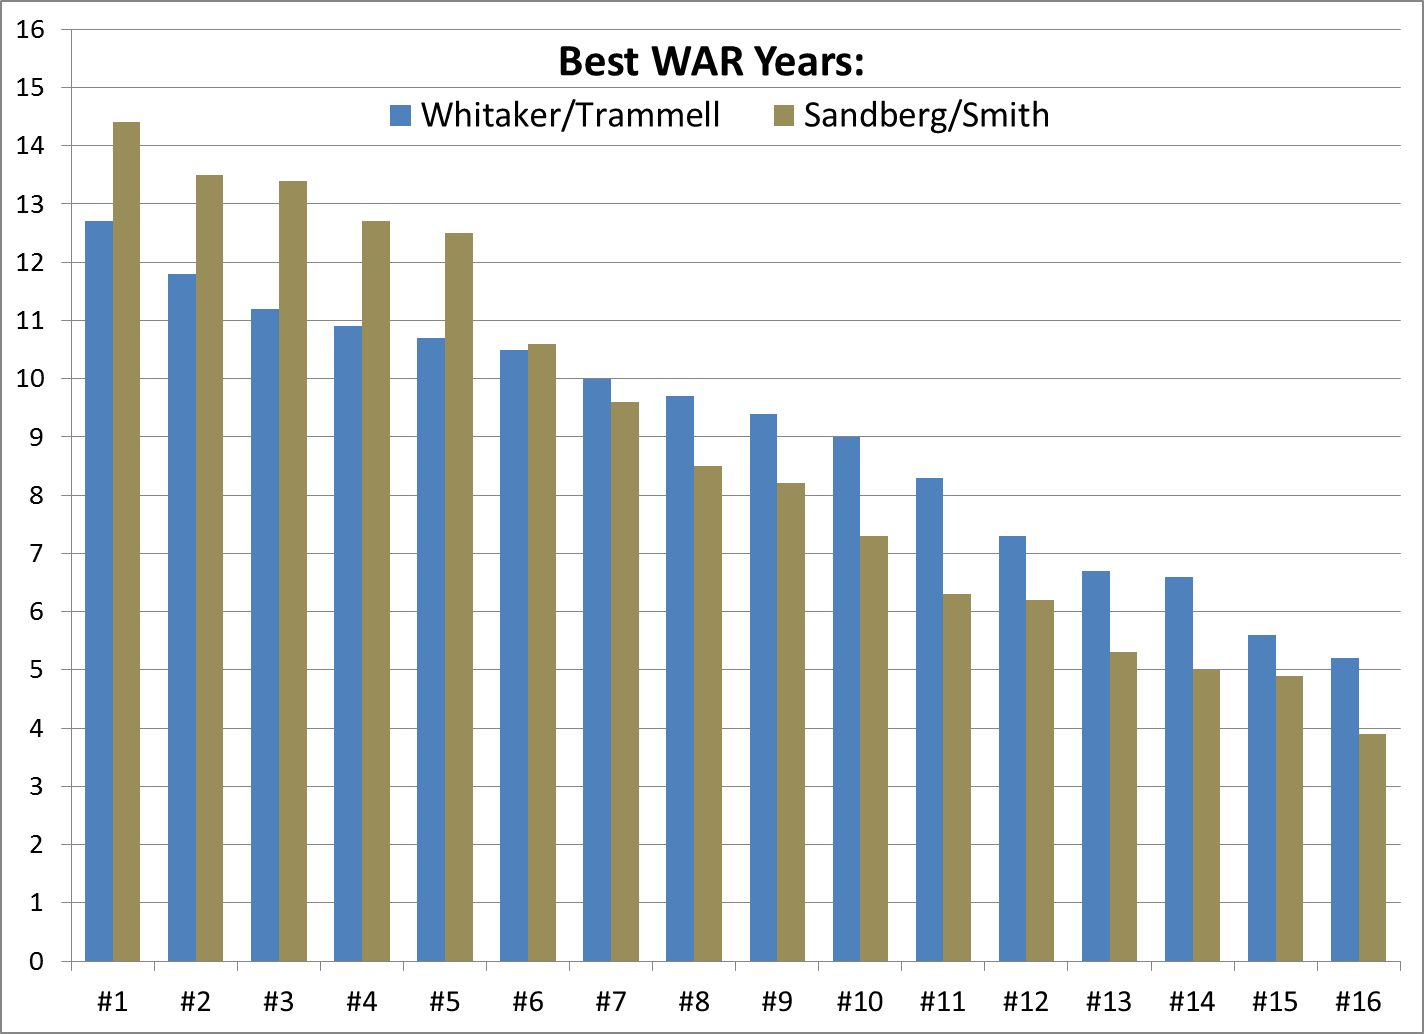
Sandberg/Smith lead handily for #1-5, by 1.8 WAR per year; #6 is virtually even; and Whitaker/Trammell lead #7-16 by 1.3 WAR per year.
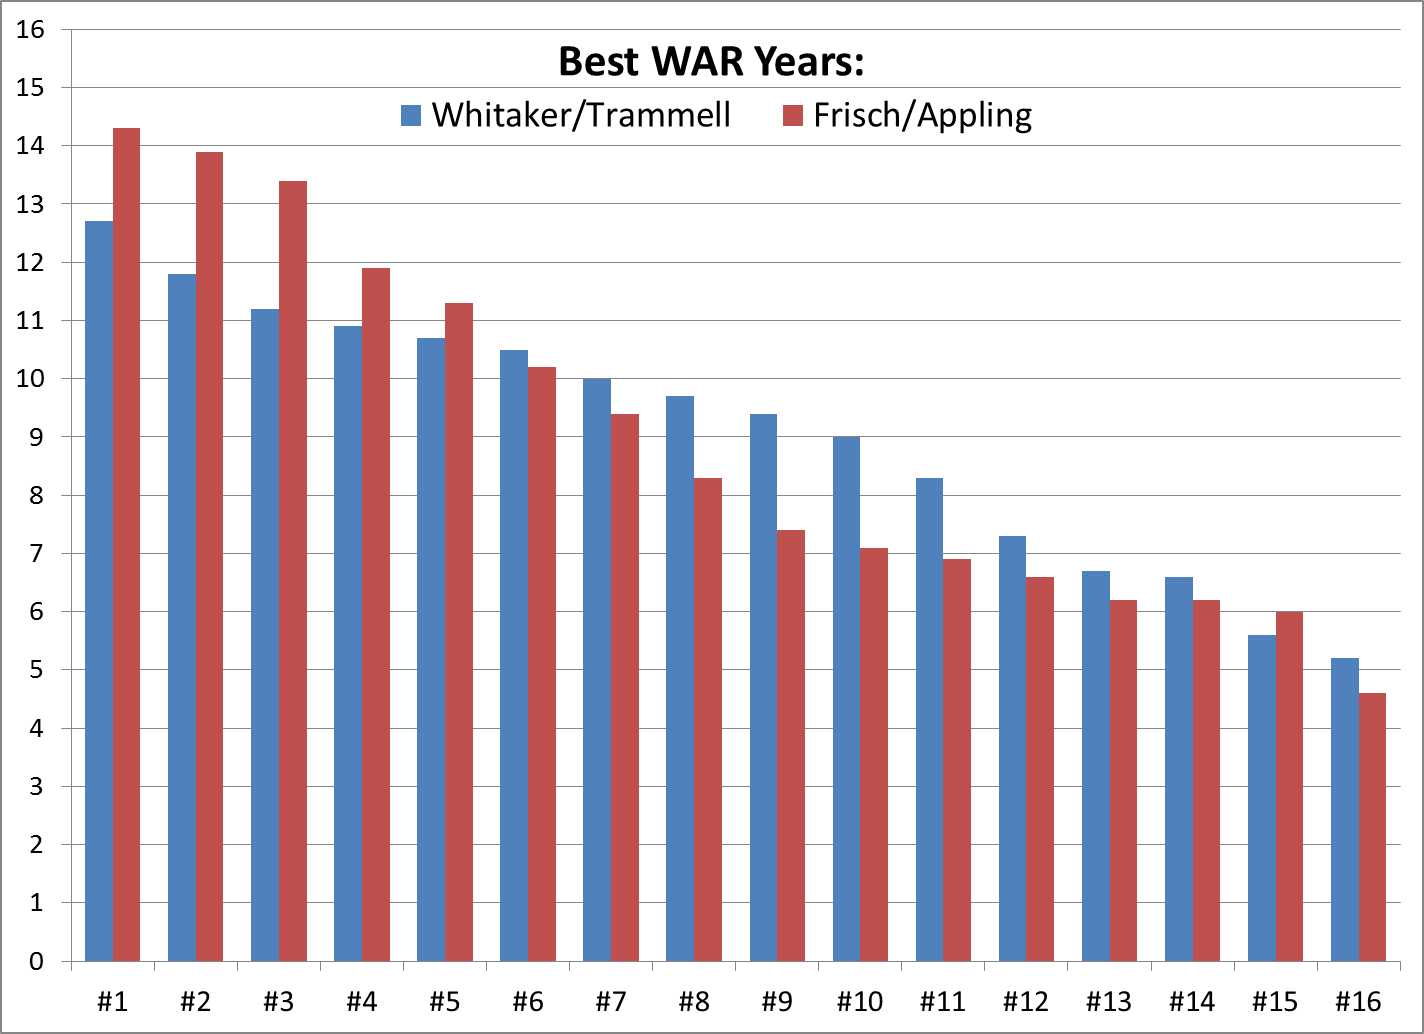
Frisch/Appling lead #1-5 by 1.5 WAR per year; #6 is about even; and Whitaker/Trammell lead all but one of #7-16, averaging +0.8 WAR in that span.
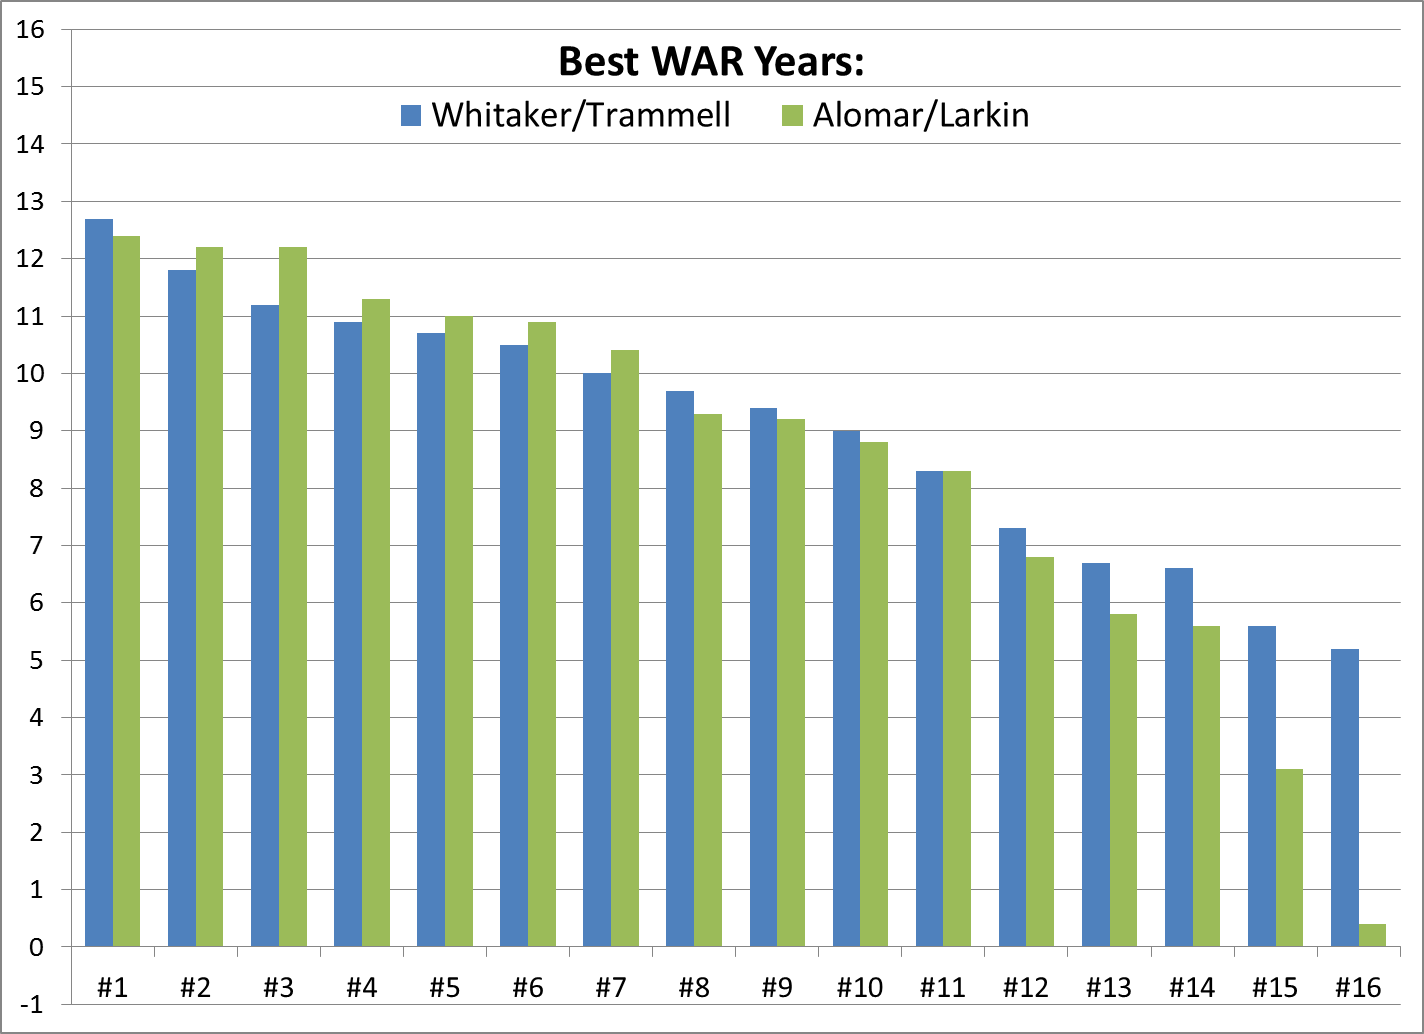
This one’s nip-and-tuck until the last two years.
In summary, the trade-off for the Whitaker/Trammell tandem value pattern, versus the more normal distributions of an equal amount of WAR for these Hall of Famers, was approximately:
- Best 5 Years: -1.2 WAR per year for the tandem combined
- 6th and 7th: Even
- 8th-16th: +1.1 WAR per year
How that affects the career assessments is open to debate.
__________
Notes:
- I didn’t adjust for the 154-game schedule, because Frisch/Appling already have the advantage of playing before integration, when replacement level was lower. The average player in that era was a bit further above replacement level; just compare the Wins Above Average for identical WARs between the two eras. Since we tend to conflate WAR and WAA, I think giving Frisch/Appling more WAR for the short schedule would distort our view of their value. Frisch and Trammell have virtually the same WAR totals and rates, but Trammell has almost 3% more WAA. Maybe I should have based this whole thing on WAA and not WAR, but WAA isn’t searchable.
- Not that it matters, but Alomar/Larkin and Sandberg/Smith were true contemporaries; their 16-year spans overlap by 14 and 12 years, respectively. Frisch/Appling overlap by just 4 seasons; I wanted a pre-expansion pair, and couldn’t find more overlap while staying close to the Trammaker WAR stats.
- I excluded Appling’s two service years from his 16-year block, but I kept Sandberg’s early-retirement year in his block, because that was a choice; plus, he only played 16 years, so the alternative was his negative-WAR first cup of coffee.
- The best-16-years selection included all of the players’ best years. The best years not included were 2.5 WAR (Whitaker) and 2.1 WAR.
__________
Off-Peak Years Can Still Be Good Years
The six HOFers sailed in for various reasons, including offensive context that made their raw stats seem more impressive. But a big reason was their higher peak value: they won MVP Awards, were All-Stars more often than Trammaker, and generally were viewed more as being “among the game’s best.”
Favoring high peaks may be broadly valid, but a blind spot is shown by reductio ad absurdum: A player who scored 5.5 WAR for 20 straight years might never come close to an MVP, but he’d wind up with a WAR total and rate very much like Joe Morgan and Rickey Henderson. Could such a man truly not belong in the Hall?
Trammell and Whitaker don’t approach that level. But their peaks are not far short of typical HOF caliber, and their off-peaks are both better and longer than most HOFers.
In a “best 10 years” average, Whitaker/Trammell trail the HOF tandems by 0.3 WAR (10.6-10.9). But they have six other good years as a tandem. What are those years worth? They averaged 6.6 WAR — more than six of the last eight pennant winners got from their 2B/SS regulars. Their norm for those six years was 3.2 Wins Above Average; a lineup of eight such players would total 12.8 WAA, more than any 2013 lineup save Boston’s. Those six “off-peak” years aren’t just filler; they’re good years that would help almost any contender.
__________
Actual Tandems
Obviously, those HOF tandems are dream matchups. You could form a lot of HOF tandems that would lose the peak race to Trammaker. How often does a team actually get 10+ WAR from its DP tandem? During Trammaker’s 16-year run, there were 13 other 10-WAR tandems.
And how often does a HOFer at 2B or SS have a star-quality partner? For the six HOFers in my study, here are the four best WAR seasons by their DP partners (among years the HOFer had 70+ games at his position):
- Frisch (13 years) — His partners’ highs were 6.0, 4.5, 4.0 and 3.7.
- Appling (16 years) — His DP mates peaked at 5.3, 2.3, 2.3 and 2.2.
- Alomar (16 years) — 6.0, 4.6, 3.2, 3.0
- Smith (17 years) — 5.6, 5.4, 3.7, 2.6
- Sandberg (13 years) — 3.0, 2.5, 2.3, 1.8
- Larkin (15 years) — 4.0, 3.6, 2.4, 2.3
In 90 total seasons as a 2B/SS regular for those six HOFers, their DP partners totaled two years of 6+ WAR, five of 5+, and nine years of 4+ WAR. Their four best partner years averaged 3.6 WAR.
By the way, here are the 13 actual 2B/SS tandems in modern history with 6+ WAR from each player, ranked by combined WAR (adjusted for schedules):
- 1906 Naps, Nap Lajoie/Terry Turner (20.4 WAR, finished 3rd)
- 1948 Indians, Joe Gordon/Lou Boudreau (17.9 WAR, World Series Champs)
- 1949 Dodgers, Jackie Robinson/Pee Wee Reese (17.4 WAR, lost WS)
- 1947 Indians, Joe Gordon/Lou Boudreau (15.0 WAR, 4th)
- 2009 Rays, Ben Zobrist/Jason Bartlett (14.8 WAR, 3rd)
- 1942 Yankees, Joe Gordon/Phil Rizzuto (14.6 WAR, lost WS)
- 1981 Angels, Bobby Grich/Rick Burleson (14.6 WAR, 5th, losing record)
- 2007 Phillies, Chase Utley/Jimmy Rollins (13.9 WAR, lost NLDS)
- 1999 Indians, Roberto Alomar/Omar Vizquel (13.4 WAR, lost ALDS)
- 1919 Yankees, Del Pratt/Roger Peckinpaugh (13.3 WAR, 3rd)
- 1983 Tigers, Lou Whitaker/Alan Trammell (12.7 WAR, 2nd)
- 1976 Orioles, Bobby Grich/Mark Belanger (12.6 WAR, 2nd)
- 1946 Dodgers, Eddie Stanky/Pee Wee Reese (12.4 WAR, 2nd)
And here’s every pairing I found of actual HOF DP tandems lasting 2 years or more (min. 60 games each at the position to count the year):
- 9 years, Johnny Evers/Joe Tinker
- 7 years, Nellie Fox/Luis Aparicio
- 5 years, Jackie Robinson/Pee Wee Reese
- 4 years, Bobby Doerr/Joe Cronin; Joe Gordon/Lou Boudreau
- 3 years, Gordon/Phil Rizzuto; Paul Molitor/Robin Yount; Evers/Rabbit Maranville; Frisch/Dave Bancroft*
- 2 years, Frisch/Travis Jackson;* Billy Herman/Reese
* Double-counting 1923, when Bancroft and Jackson both had 60+ games at SS, with Frisch as the 2B regular.
__________
Does peak theory need tweaking in this era of free agency and long-term contracts? Pennant impact now goes beyond what they do on the field; it’s also what they do to your budget. Most players these days reach free agency after age 30, when they’re at or past their peak. High-peak stars command the biggest investments just when their performance is likely to decline, sometimes sharply. A second-tier star with a modest peak who lasts longer near that level may prove more useful to a team, because of his stable value.
Suppose you need a second baseman, and there are two free agents going into age 31 (like Robinson Cano this year):
- Ryne Sandberg, who averaged 5.4 WAR in age 24-30
- Lou Whitaker, 4.7 WAR in age 24-30
First of all, Sandberg will cost a lot more. In free agency, as in most markets, the marginal gains at the top of the quality scale cost much more than those lower down. (In fact, Sandberg had two years with MLB’s #2 salary, age 33-34, while Whitaker never cracked the AL’s top 10.) But although Sandberg had big years at 31-32, he faded quickly, and Whitaker beat him by 28-23 in total WAR for their next six years played after age 30. If you’re paying superstar dollars and getting so-so performance, you may not have money left to fill in the gaps. That’s another kind of pennant impact.
No one can tell in advance which players will hold their value the longest, nor which top stars will crash. But when it comes to rating careers on pennant impact, today’s economics create a subtle advantage in the long, steady value of players like Whitaker and Trammell, which eludes peak-value assessment.