
Wrapping up my mini–series on Alan Trammell and Lou Whitaker with a look at how timing hurt their Hall of Fame chances, and a bunch of other stuff. Throughout this post, all seasons are projected to 162 games unless noted.
Timing hurt their HOF chances in many ways, but I’ll detail two major factors:
- Offense soared just as they were on their way out. Comparing Trammaker’s 1978-93 prime to the next 16 years, AL scoring rose by 12%.
- More great middle infielders played during Trammaker’s time than any other in MLB history, including three of the seven best (Joe Morgan, Cal Ripken and Alex Rodriguez).
There’s a third factor whose effect I can’t gauge, so let’s start with the certainties.
Missing the Party
The offensive zoom occurred overnight: In 1993, Whitaker and Trammell both played their last full-time years. In ’94, AL scoring spiked 11%, and stayed high for more than a decade. The years 1994-2003 saw more runs per game than any 10 years save the 1930s.
That brought a lot more of the individual magic numbers that Hall voters still love. Comparing 1978-93 and 1995-2010 for middle infielders:
- .300 averages more than doubled, from 62 to 133
- “100” seasons quadrupled — from 13 to 51 for 100 RBI, 36 to 143 for 100 runs.
Expansion from 26 to 30 teams did bring 14% more team-seasons into the latter period, but the rise in magic numbers still came mainly from offensive context.
Trammell and Whitaker did impressive things, for their time. In a 50-year span from 1944-93, Trammell’s six qualified years hitting .300+ (all from 1980-90) were two more than any other shortstop, tied with Carew and Fox for the most among all middle infielders. But in 1994-2004 alone, that six-time feat was matched by Alomar, A-Rod, Jeter and Nomar, with two more in the club since then. Trammell’s .343 BA in 1987, the best by a SS since 1948, was topped four times just from 1996-2000.
In that same 50-year span, Whitaker’s eight years of 15+ HRs tied Morgan and Sandberg for the most among second basemen, and his four years of 20+ HRs tied Morgan behind Sandberg’s five. But in 1995-2004 alone, Jeff Kent had nine years of 20+ HRs, and Bret Boone had six. From 1949-89, Whitaker’s 28-HR year was 4th-best by a 2B, and only Davey Johnson topped 30; but 30 HRs has been reached 23 times since then, by 11 different second basemen.
OPS+ and Offensive WAR can place Whitaker and Trammell in the same class as Sandberg, Larkin, Alomar and Biggio. But those all-in-one numbers may not pack the punch of traditional stats. So I used B-R’s Neutralized Batting tool to estimate Trammaker’s career stats had they come up in 1990, in the Larkin/Alomar/Biggio generation. Putting each actual season performance into a 13-years-later Detroit context, with the same playing time, yields these lines:
- Trammell – .302 BA, .373 OBP … 2,601 hits … 202 HRs, 1,158 RBI, 1,424 Runs … 715 XBH … 3,778 Total Bases
- Whitaker — .294 BA, .386 OBP … 2,623 hits … 271 HRs, 1,257 RBI, 1,613 Runs … 810 XBH … 4,045 Total Bases
With those stats, each would be among his position’s all-time top 8 in Hits, HRs, RBI, Runs, Extra-Base Hits, Total Bases, and OBP. And they’d be in the Hall of Fame.
A Crowded Field
I showed the estimates for Trammaker had they come up in 1990. But if they’d come up in 1960, they’d have stood out even more.
In MLB history, 29 middle infielders have amassed 60 career WAR; Whitaker and Trammell are both over 70 WAR. But getting noticed depends a lot on who else is around. Consider:
- From 1959-69, just one of those 29 was active at any point. (And he wasn’t even “Joe Morgan!” yet.)
- From 1978-96, nine of those 29 were active each year, on average. Ten were active each year from 1988-92, the tail end of Trammaker’s prime.
- No season outside 1978-96 has seen more than six such players active.
The ’60s dearth of great MIFs may have helped Luis Aparicio and Bill Mazeroski reach the Hall. Maury Wills, 2nd among 1960s MIFs with 36.7 WAR, got 40% support in his best HOF ballot — more than has ever gone to Trammell, who was #1 in the ’80s with 52.4 WAR.
In the ’60s, really big years by a MIF were scarce as hen’s teeth, even by neutral measures. From 1960-71, there was one 8-WAR year, and one qualified year at 150 OPS+ (both Rico Petrocelli, 1969). Then Little Joe flapped his elbow, and the landscape changed. From 1972-84, six different middle infielders combined for eleven 8-WAR years, and eight 150-OPS+ years. Five of those six won MVP Awards, including three straight from 1982-84. In ’87, Trammell posted 8.2 WAR with a 155 OPS+ year (and led Detroit’s September pennant surge, hitting .417/1.167), but the trophy escaped him. A shortstop batting .343-28-105 was no longer a novelty.
As the most complete player of the ’70s, Morgan cast a big shadow. His prime was capped by two MVPs right before Trammaker broke in. His 5-year WAR peak (8+ WAR each of 1972-76) has been matched only by Wagner, Ruth, Hornsby, Williams, Mantle, Mays and Bonds. Then came Cal Ripken, who trails only Wagner in WAR for shortstops. Trammell was terrific in 1983, .319 with 30 steals and a Gold Glove, but Cal blew that out of the water. Later, just as Trammaker were finishing up, A-Rod went supernova, becoming the first SS since Wagner to contend for “game’s best player” over a decade or so. (None but Honus and Alex ever had 70+ WAR in a 10-year span.)
By 2001, when Whitaker reached the HOF ballot, Jeff Kent was a reigning MVP; Nomar had won two straight batting crowns; and Jeter, Alomar, Larkin, Biggio and Tejada were still at or near their peaks.
If there’s any doubt that the number of excellent middle infielders during Trammaker’s career affected the HOF voting, consider these counts of SS/2B with 50+ WAR in 20-year spans (47.5 WAR for 154-game era):
- 1900-19 — 6 (all in HOF)
- 1910-29 — 5 (4 in HOF)
- 1920-39 — 7 (all in HOF)
- 1930-49 — 7 (all in HOF)
- 1940-59 — 5 (all in HOF)
- 1950-69 — 1 (in HOF)
- 1960-79 — 3 (2 in HOF)
- 1970-89 — 8 (4 in HOF)
- 1980-99 — 8 (5 in HOF)
- 1990-2009 — 6 (2 in HOF, 2 active, 2 fresh to the ballot)
Of those retired by 2006, the only non-HOFers are:
- Art Fletcher, 1910-29 group, 47.2 career WAR (made list because his bad rookie year was 1909)
- Bert Campaneris, 1960-79 group, 53.3 career WAR
- Whitaker, 1970-89 group (and 1980-99), 74.8 career WAR
- Trammell, 1970-89 group (and 1980-99), 70.3 career WAR
- Bobby Grich, 1970-89 group, 71.0 career WAR
- Willie Randolph, 1970-89 group, 65.6 career WAR
The four in the 1970-89 group — Whitaker, Trammell, Grich and Randolph — are the only non-HOF middle infielders with 65+ WAR, and the only ones meeting the “54/27” WAR standard I discussed in a prior post.
The hell of it? Despite the stiff competition, Trammaker were still way above average — probably just as much as if they’d played in a less star-studded era. More on that later.
Big WAR Takes a Dive
I don’t know what this means, but I’ll just put it out there: We know that Trammaker had just one 7-WAR season between them. But during their careers, 7-WAR seasons were rarer than ever before or since, for any extended period. This chart shows live-ball seasons of 7+ WAR by position players, in 5-year averages. All figures are per 30 teams, and the WAR threshold is adjusted to each year’s actual schedule (so in a 154-game season, 6.6 WAR counts as “7 WAR”):
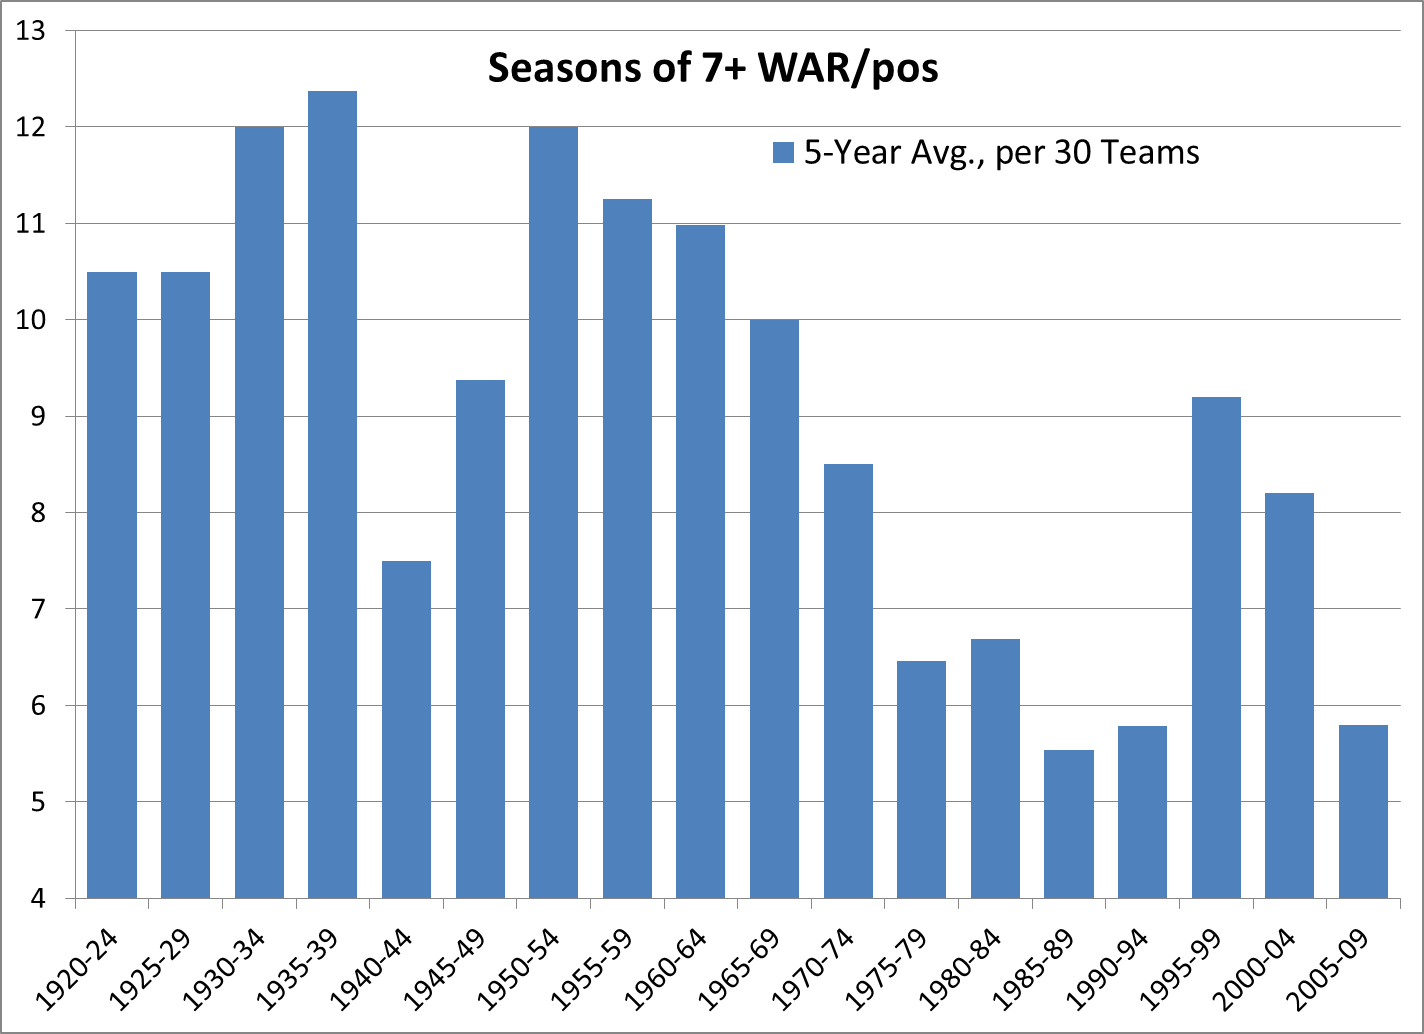
That trough from 1975-94 covers 95% of Trammaker’s career games. I don’t know what to make of it, because I don’t know what caused it — but it’s not just a fluke of the 7-WAR threshold. There’s a similar drop in 8-WAR seasons, and a smaller decline in 6-WAR campaigns. I thought platooning might be a factor, but that would show up in the number of hitters qualified for the batting title — and that rate has barely changed since WWII, with the Trammaker era just above average.
In tighter focus, here’s the average of 7-WAR/pos seasons for three 16-year spans bracketing our guys:
- 1962-77 — 8.8
- 1978-93 — 5.7 (Whitaker/Trammell prime)
- 1994-09 — 7.8
All in all, it would be hard to find worse conditions for Trammell & Whitaker to get due recognition.
Now I’ll move beyond timing to some general thoughts.
____________________
Far Above Average
Maybe Whitaker & Trammell didn’t have classic peaks, but they didn’t reach 70 career WAR by being just above average for a long time. They were way above average, for a very long time. Here’s their rank in career Wins Above Average against their HOF contemporaries (counting Biggio):
- Morgan, 63.3 WAA
- Ripken, 53.2
- Whitaker, 42.4
- Larkin, 42.2
- Ozzie, 41.6
- Trammell, 40.1
- Sandberg, 38.1
- Yount, 37.2
- Alomar, 32.3
- Biggio, 28.5
WAA per 162 Games, Career:
- Morgan, 3.87 WAA
- Larkin, 3.14
- Whitaker, 2.87
- Ripken, 2.87
- Sandberg, 2.85
- Trammell, 2.83
- Ozzie, 2.62
- Alomar, 2.20
- Yount, 2.11
- Biggio, 1.62
12 Best WAA Years:
- Morgan, 57.5 WAA
- Ripken, 53.3
- Larkin, 44.6
- Trammell, 43.5
- Yount, 42.2
- Ozzie, 40.0
- Sandberg, 38.3
- Biggio, 37.3
- Whitaker, 36.9
- Alomar, 35.7
Trammaker vs. Contemporary DP Tandems
Another gauge of their height above average is comparison to actual SS/2B tandems for the years 1978-93:
- Whitaker/Trammell combined for 9.1 WAR per year.
- For all other teams, the regular 2B and SS combined for 3.8 WAR per year.
Now, that may overstate their edge a bit, since some teams didn’t have a full-time tandem, and some of those teams got more WAR from a timeshare than from the top guy. Still, Detroit’s DP tandem produced something like 5 WAR per year more than the average — and they did that over 16 years.
While Detroit’s duo averaged 9.1 WAR, the next-best clubs averaged 7.0 (St. Louis) and 6.3 (Baltimore) by their tandems. Detroit got at least 6.6 WAR from Trammaker in 14 of 16 years. That’s a heck of a foundation.
Trammaker had seven years at 10+ WAR; all other teams in those 16 years had 13 such tandems — three for Ripken, three for Yount, two for Ozzie, none for Sandberg. Of those twenty 10-WAR tandems from 1978-93, these seven finished 1st or won 90 games:
- 13.1 WAR, 1982 Brewers — 95-67, lost World Series
- 12.7 WAR, 1983 Tigers — 92-70, 2nd place
- 12.0 WAR, 1985 Cardinals — 101-61, lost World Series
- 11.8 WAR, 1987 Tigers — 98-64, won division, lost ALCS
- 10.9 WAR, 1984 Tigers — 104-58, won World Series
- 10.6 WAR, 1980 Yankees — 103-59, won division, lost ALCS
- 10.3 WAR, 1981 Reds — 66-42, “1st place” (best overall record, screwed by split schedule)
Detroit’s seven 10-WAR tandems produced one championship and another division crown. The other 13 such tandems produced two pennants, another division title, no championships.
A tighter peak for the duo was 1981-91, in which Whitaker & Trammell ranked 1st or 2nd in tandem WAR each year but one — five 1sts, five 2nds:
- 1981 — 2nd, 11.3 WAR
- 1982 — 2nd, 9.7 WAR
- 1983 — 1st, 12.7 WAR
- 1984 — 1st, 10.9 WAR
- 1985 — 3rd, 7.3 WAR
- 1986 — 1st, 10.7 WAR
- 1987 — 1st, 11.8 WAR
- 1988 — 1st, 9.4 WAR
- 1989 — 2nd, 9.0 WAR
- 1990 — 2nd, 10.5 WAR
- 1991 — 2nd, 10.0 WAR
Trammaker averaged 10.3 WAR for 1981-91, while all other tandems averaged 3.8 WAR. That’s a big edge from two spots in the lineup — and a big reason why only Toronto won more games than Detroit in those years, with Sweet Lou & Tram ranked 2nd and 7th for wins played in. Their 10.3 WAR average is more than half the average team’s WAR/pos in that era. Individually, for 1981-91, they rank 4th (Trammell) and 6th in total WAR/pos.
One last bit on these tandems, just for fun: To gauge balanced contributions from both halves of a tandem, I used the formula Bill James created for Power/Speed Number, with the two players’ WAR in place of HRs and SB; I’ll call this Tandem Score. The formula is, twice the product, divided by the sum. For 1981-91, Whitaker & Trammell logged 10 of the top 18 Tandem Scores. The top 20 Tandem Scores included:
- 10 by Trammell & Whitaker
- 3 by Ozzie & pal (two with Herr, one with Oquendo)
- 2 by Yount & Gantner
- 2 by Dickie Thon (one with Doran, one with Garner)
- 1 by Bobby Grich & Rick Burleson (the top mark)
- 1 by the Ripken brothers
- 1 by Dave Concepcion & Ron Oester
Pennant Impact
So why did Detroit win their division just twice in those 11 years? I have no pat answer.
It’s clear that Trammell and Whitaker were generally Detroit’s best players from 1981-91. The duo had 12 individual years of 5+ WAR, while all other Tigers added 9 such years. They logged the club’s top 4 WAR seasons and 12 of the top 18. Their combined average was 5.5 WAR per 650 PAs, while all other Detroit regulars in those years (300+ PAs in a season) combined for 3.1 WAR/650. No Tiger with more than 2 years in the span came close to their average WAR.
On the other hand … Even excluding Trammaker, Detroit’s other regulars still averaged better than the rest of the teams combined, by 3.1 to 2.9 WAR/650. Including the duo, Detroit regulars averaged 3.8 WAR/650; Toronto, who won the most games in this span, averaged 3.1 WAR/650 from regulars.
And Detroit had more All-Star-quality years than anyone. At 5+ WAR, the tally was Detroit 21, Boston 17, Oakland & Montreal 16. At 6+ WAR, the tally was Boston 11, Detroit & Montreal 10, Baltimore 8.
Ah, but in really big years — MVP-caliber years of 7+ WAR — the score was Boston 8, Montreal 6, Baltimore 5, Philly 4, five teams with 3, five teams with 2, and Detroit with 1.
Is that shortage of 7-WAR years meaningful? It would take a lot more study to reach any conclusions, including the data for pitching and total WAR, which I won’t do right now. But as a caveat, note that Toronto (3 divisions, most wins) is not among the big-WAR leaders (12 with 5+, 7 with 6+, 2 with 7+). Nor are the Dodgers (4 divisions, 8 years of 5+ WAR, 1 of 7+), or the Cardinals (3 pennants, 14 with 5+, 2 with 7+). And Montreal, way up in big-WAR years, managed just one division in that span (and that only due to a split season). Baltimore, high in 6+ and 7+ WAR, also took just one division.
Complicating matters, it was an era of perhaps unprecedented parity in playoff appearances. Compare the first 12 years of the divisional era against the next 11 years:
- 1969-80: 15 franchises reached the playoffs, 10 reached the World Series
- 1981-91: 23 franchises reached the playoffs, 16 reached the World Series
During 1981-91, all but Cleveland, Seattle and Texas reached the playoffs. Seven clubs made their first appearance of the divisional era (Cubs, ChiSox, Brewers, Expos, Padres, Cards, Blue Jays). Repeating was rare: Each pennant from 1979-88, and each WS from 1979-92, was won by a team that had not won the year before. All four division winners were fresh in 1979-80, ’82-84, and ’86-88.
And Detroit was in the toughest division. For 1978-93 combined, AL East teams ranked 1st, 2nd, 3rd, 7th, 8th and 10th in overall record. For 1981-91, AL East teams ranked 1st, 3rd, 5th, 8th and 12th overall; for the rest of the top half, AL West had nos. 7, 9, 11 and 13; NL East had nos. 2, 6 and 10; and NL West had just no. 4.
Now, suppose Trammell & Whitaker each had a more normal distribution of high and low WAR years. Would that have led to more October games? Fact is, despite 11 straight winning years (1978-88) and the 3rd-best record in baseball during their 16-year prime (14 total games behind the #1 Yankees), Detroit did not contend often. They finished at least 6 GB all but four of those years: they won in 1984 and ’87, ran 1 GB in ’88, and were fairly close in both ’81 halves (3.5 GB/1.5 GB). If a high-low distribution of Trammaker WAR hits the right years, maybe they win one or both of those near-misses. On the other hand, the two years they did win were among the pair’s best. Trammell’s MVP-caliber year was 1987, when they clinched the division in the final game; so if the high-low hits wrong, maybe they lose that one.
Ultimately, I cannot conclude that Detroit’s WAR/pos pattern of high average, low peak — seen not just in Trammaker but in the whole lineup — was a factor in cashing just two division titles from all those wins. It could be just something that happened, with no clear cause.
About Those “Low Peaks”
There are 39 middle infielders in the Hall, with Biggio soon to be #40. I calculated their total WAR for their 2 best WAR seasons, their 6 best and their 10 best (no adjustment for schedules). Here’s where Trammell and Whitaker would land on those lists (including Biggio):
- 2 Best WAR Seasons: Trammell #18, Whitaker #28
- 6 Best WAR Seasons: Trammell #16, Whitaker #26
- 10 Best WAR Seasons: Trammell #16, Whitaker #24
For single best year, Trammell would tie for #17, Whitaker would tie for #31. Seven modern HOFers had best seasons below Whitaker’s: Red Schoendienst, Bobby Doerr, Johnny Evers, Travis Jackson, Luis Aparicio, Rabbit Maranville and Bill Mazeroski. Aparicio and Maranville were BBWAA selections.
So, while Trammell & Whitaker can’t match the peaks of the inner circle, there are a lot of Hall of Fame MIFs with worse peaks. Taken together, their peaks would fall right in the middle of the HOF spectrum.
Debut Duos
Eight pairs of players who debuted in the same team/year each achieved 50+ WAR. Only Whitaker and Trammell (a) both reached 70 career WAR, or (b) both reached 55 WAR in their years together.
In reverse order of teammate tenure:
- Joe Jackson/Home Run Baker, 1908 A’s – Jackson played just 10 games with the A’s, traded to Cleveland in 1909.
- Jeff Bagwell/Kenny Lofton, 1991 Astros – Lofton played just 20 games for Houston, traded that fall.
- Paul Waner/Joe Cronin, 1925 Pirates – Cronin played just 50 games with Pittsburgh, sold in 1928.
- Rod Carew/Graig Nettles, 1967 Twins – Nettles played just 121 games for Minnesota, traded in 1969.
- Joe Morgan/Jim Wynn, 1963 Astros – Together 9 years through 1971, amassing 60 WAR but no winning seasons.
- Jimmie Foxx/Mickey Cochrane, 1925 A’s – Together 9 years through 1933, combining for 86 WAR, 3 MVPs, 3 pennants and 2 championships.
- Jackie Robinson/Duke Snider, 1947 Dodgers – Together 10 years through 1956, amassing 114 WAR, one MVP, 5 pennants and one championship.
- Lou Whitaker/Alan Trammell, 1977 Tigers – Together 19 years through 1995, amassing 145 WAR, 2 division titles and one championship.
70 WAR for One Team
Just 40 players in MLB history have compiled 70 WAR for any one team. The Tigers and Yankees have five each; five teams have three, four have two, and seven have one. These nine pairs had any overlap (from shortest to longest):
- Pete Rose shared just one year with Barry Larkin, and neither was a regular.
- Joe DiMaggio was around only for Mickey Mantle’s rookie year.
- Carl Yastrzemski and Wade Boggs were teammates for 2 years (1982-83). (Yaz broke in the year after Ted Williams left.)
- Ty Cobb and Charlie Gehringer were Tigers teammates for 3 years (1924-26), but Gehringer barely played before ’26, and Cobb missed half of that season.
- Lou Gehrig overlapped with DiMaggio from 1936-39 — three years as regulars, three titles.
- Gehrig and Babe Ruth were together for 12 years (1923-34), 10 as regulars. Four pennants, three championships.
- Pete Rose and Johnny Bench were teammates for 12 years (1967-78), 11 as regulars. Four pennants, two titles.
- Hank Aaron and Eddie Mathews were both Braves for 13 years (1954-66), combining for almost 300 games a year in that stretch. Two pennants, one title.
- And Trammell & Whitaker, together for 19 years (1977-95), 17 years as regulars. Whitaker is 4th all-time in games played at 2B, Trammell 10th at SS. And almost all of those games were together.
Long-time Tandems
2B/SS tandems lasting 7+ years, min. 70 G each at their position to count the year. (This costs Detroit’s duo three years wherein Trammell had 60-63 G at SS, but whatever.)
- 14 years — Whitaker/Trammell (Tigers, 1978-91)
- 9 years and counting — Chase Utley/Jimmy Rollins (Phillies, 2005-13)
- 9 years — Glenn Beckert/Don Kessinger (Cubs, 1965-73)
- 9 years — Johnny Evers/Joe Tinker (Cubs, 1903-10, ’12)
- 8 years — Robinson Cano/Derek Jeter (Yankees, 2005-12)
- 8 years — Ryne Sandberg/Shawon Dunston (Cubs, 1985-91, ’97)
- 8 years — Dave Lopes/Bill Russell (Dodgers, 1973-80)
- 8 years — Joe Morgan/Dave Concepcion (Reds, 1972-79)
- 8 years — Larry Doyle/Art Fletcher (Giants, 1911-16, ’18-19)
- 8 years — Bobby Lowe/Herman Long (Beaneaters [Braves], 1893-1900)
- 7 years — Mark Lemke/Jeff Blauser (Braves, 1991-97)
- 7 years — Dick Green/Bert Campaneris (Athletics, 1965-66, ’69-71, ’73-74)
- 7 years — Julian Javier/Dal Maxvill (Cardinals, 1962, ’66-71)
- 7 years — Nellie Fox*/Luis Aparicio (White Sox, 1956-62)
- 7 years — Bill Mazeroski/Dick Groat (Pirates, 1956-62)
- 7 years — Charlie Gehringer/Billy Rogell (Tigers, 1932-38)
- 7 years — Billy Herman/Billy Jurges (Cubs, 1932-38)
- 7 years — Ralph Young/Donie Bush (Tigers, 1915-21)
- 7 years — Otto Knabe/Mickey Doolin (Phillies, 1907-13)
* Fox spent the prior 6 years paired with Chico Carrasquel.
And on the other end of the spectrum, Hall of Fame SS Bobby Wallace had 8 different partners in a 9-year span with the Browns, 1904-12.
I would not argue that long teammate tenure is a HOF credential. But if the unique feat of Trammell & Whitaker in this regard were to stir some sentimental HOF support, I wouldn’t be outraged.
____________________
Thanks for letting me get all this off my chest. I hope you found some part of it interesting!