
Earned Run Average (ERA) is, of course, the standard measuring stick of pitcher effectiveness, based on the inescapable logic that the pitcher’s ONLY job is to prevent runs from scoring (while the more elemental Runs Allowed Average would presumably be the metric that most closely correlates to run prevention, in the interests of being “fair” to pitchers and not judging them based, in part, on the errors made by their defense, I will defer to convention and concede that ERA is THE “go to” measurement).
But, how does a pitcher compile a low ERA? Firstly, of course, by limiting the runners who reach base and, then, limiting the baserunners who score. This post will break down those two attributes of pitcher skill and look at the pitchers of the past 5 decades plus who have been most proficient in each.
Let’s start by looking at the best seasons for Out Rate and Strand Rate. I’ve defined those metrics as:
- Out Rate = IP*3 / BF, being the proportion of batters faced who are put out, either at bat or on the bases
- Strand Rate = 1 – (Runs Allowed / Baserunners Allowed), being the proportion of baserunners who fail to score
Baseball-Reference measures Baserunners Allowed that includes Hits, BBs, and HBPs. I’m not sure whether ROE are included, or times when a batter reaches on a FC when no outs are recorded. As I’m also using some data from FanGraphs, I’ve defined an alternate measurement for Strand Rate as:
- LOB Strand Rate = 1 – (Runs Allowed / (BF – IP*3)), being the proportion of batters who are not put out and fail to score (in effect, baserunners left on base)
Bequeathed runners are included in both Out Rate and Strand Rate calculations.
I think that covers the preliminaries, so here are the top seasons by decade for our two measurements. First, for Out Rate.
| Rk | 1961-70 | IP | Out Rate | Year | Age | Tm | Lg | W | L | W-L% | BB | SO | ERA | ERA+ |
| 1 | Dave McNally | 273 | 78.9% | 1968 | 25 | BAL | AL | 22 | 10 | 0.688 | 55 | 202 | 1.95 | 150 |
| 2 | Bob Gibson | 304.2 | 78.7% | 1968 | 32 | STL | NL | 22 | 9 | 0.710 | 62 | 268 | 1.12 | 258 |
| 3 | Luis Tiant | 258.1 | 78.5% | 1968 | 27 | CLE | AL | 21 | 9 | 0.700 | 73 | 264 | 1.60 | 186 |
| 4 | Denny McLain | 336 | 78.3% | 1968 | 24 | DET | AL | 31 | 6 | 0.838 | 63 | 280 | 1.96 | 154 |
| 5 | Juan Marichal | 307.1 | 78.1% | 1966 | 28 | SFG | NL | 25 | 6 | 0.806 | 36 | 222 | 2.23 | 167 |
| 6 | Joe Horlen | 258 | 77.8% | 1967 | 29 | CHW | AL | 19 | 7 | 0.731 | 58 | 103 | 2.06 | 146 |
| 7 | Sandy Koufax | 335.2 | 77.6% | 1965 | 29 | LAD | NL | 26 | 8 | 0.765 | 71 | 382 | 2.04 | 160 |
| 8 | Joe Horlen | 210.2 | 77.5% | 1964 | 26 | CHW | AL | 13 | 9 | 0.591 | 55 | 138 | 1.88 | 184 |
| 9 | Sandy Koufax | 311 | 77.1% | 1963 | 27 | LAD | NL | 25 | 5 | 0.833 | 58 | 306 | 1.88 | 159 |
| 10 | Vern Law | 217.1 | 77.0% | 1965 | 35 | PIT | NL | 17 | 9 | 0.654 | 35 | 101 | 2.15 | 163 |
| Rk | 1971-80 | IP | Out Rate | Year | Age | Tm | Lg | W | L | W-L% | BB | SO | ERA | ERA+ |
| 1 | Roger Nelson | 173.1 | 79.8% | 1972 | 28 | KCR | AL | 11 | 6 | 0.647 | 31 | 120 | 2.08 | 145 |
| 2 | Tom Seaver | 286.1 | 77.9% | 1971 | 26 | NYM | NL | 20 | 10 | 0.667 | 61 | 289 | 1.76 | 194 |
| 3 | Ron Guidry | 273.2 | 77.7% | 1978 | 27 | NYY | AL | 25 | 3 | 0.893 | 72 | 248 | 1.74 | 208 |
| 4 | Vida Blue | 312 | 77.5% | 1971 | 21 | OAK | AL | 24 | 8 | 0.750 | 88 | 301 | 1.82 | 183 |
| 5 | Catfish Hunter | 295.1 | 77.2% | 1972 | 26 | OAK | AL | 21 | 7 | 0.750 | 70 | 191 | 2.04 | 140 |
| 6 | Don Sutton | 272.2 | 77.1% | 1972 | 27 | LAD | NL | 19 | 9 | 0.679 | 63 | 207 | 2.08 | 162 |
| 7 | Catfish Hunter | 318.1 | 77.0% | 1974 | 28 | OAK | AL | 25 | 12 | 0.676 | 46 | 143 | 2.49 | 134 |
| 8 | Steve Carlton | 346.1 | 76.9% | 1972 | 27 | PHI | NL | 27 | 10 | 0.730 | 87 | 310 | 1.97 | 182 |
| 9 | Gary Nolan | 176 | 76.6% | 1972 | 24 | CIN | NL | 15 | 5 | 0.750 | 30 | 90 | 1.99 | 162 |
| 10 | Gaylord Perry | 322.1 | 76.6% | 1974 | 35 | CLE | AL | 21 | 13 | 0.618 | 99 | 216 | 2.51 | 144 |
| Rk | 1981-90 | IP | Out Rate | Year | Age | Tm | Lg | W | L | W-L% | BB | SO | ERA | ERA+ |
| 1 | Dwight Gooden | 276.2 | 77.9% | 1985 | 20 | NYM | NL | 24 | 4 | 0.857 | 69 | 268 | 1.53 | 229 |
| 2 | John Tudor | 275 | 77.7% | 1985 | 31 | STL | NL | 21 | 8 | 0.724 | 49 | 169 | 1.93 | 185 |
| 3 | Mike Scott | 275.1 | 77.6% | 1986 | 31 | HOU | NL | 18 | 10 | 0.643 | 72 | 306 | 2.22 | 161 |
| 4 | Bret Saberhagen | 262.1 | 77.1% | 1989 | 25 | KCR | AL | 23 | 6 | 0.793 | 43 | 193 | 2.16 | 180 |
| 5 | Ron Guidry | 127 | 76.7% | 1981 | 30 | NYY | AL | 11 | 5 | 0.688 | 26 | 104 | 2.76 | 129 |
| 6 | Dennis Eckersley | 169.1 | 76.5% | 1985 | 30 | CHC | NL | 11 | 7 | 0.611 | 19 | 117 | 3.08 | 129 |
| 7 | Roger Clemens | 254 | 76.4% | 1986 | 23 | BOS | AL | 24 | 4 | 0.857 | 67 | 238 | 2.48 | 169 |
| 8 | Don Sutton | 158.2 | 76.3% | 1981 | 36 | HOU | NL | 11 | 9 | 0.550 | 29 | 104 | 2.61 | 126 |
| 9 | Teddy Higuera | 227.1 | 76.2% | 1988 | 30 | MIL | AL | 16 | 9 | 0.640 | 59 | 192 | 2.45 | 162 |
| 10 | Bob Knepper | 156.2 | 76.2% | 1981 | 27 | HOU | NL | 9 | 5 | 0.643 | 38 | 75 | 2.18 | 151 |
| Rk | 1991-2000 | IP | Out Rate | Year | Age | Tm | Lg | W | L | W-L% | BB | SO | ERA | ERA+ |
| 1 | Greg Maddux | 209.2 | 80.1% | 1995 | 29 | ATL | NL | 19 | 2 | 0.905 | 23 | 181 | 1.63 | 260 |
| 2 | Pedro Martinez | 217 | 79.7% | 2000 | 28 | BOS | AL | 18 | 6 | 0.750 | 32 | 284 | 1.74 | 291 |
| 3 | Greg Maddux | 202 | 78.3% | 1994 | 28 | ATL | NL | 16 | 6 | 0.727 | 31 | 156 | 1.56 | 271 |
| 4 | Greg Maddux | 232.2 | 78.2% | 1997 | 31 | ATL | NL | 19 | 4 | 0.826 | 20 | 177 | 2.20 | 189 |
| 5 | Kevin Brown | 233 | 77.2% | 1996 | 31 | FLA | NL | 17 | 11 | 0.607 | 33 | 159 | 1.89 | 215 |
| 6 | Pedro Martinez | 213.1 | 76.6% | 1999 | 27 | BOS | AL | 23 | 4 | 0.852 | 37 | 313 | 2.07 | 243 |
| 7 | John Smoltz | 253.2 | 76.5% | 1996 | 29 | ATL | NL | 24 | 8 | 0.750 | 55 | 276 | 2.94 | 149 |
| 8 | Pedro Martinez | 241.1 | 76.5% | 1997 | 25 | MON | NL | 17 | 8 | 0.680 | 67 | 305 | 1.90 | 219 |
| 9 | Bret Saberhagen | 177.1 | 76.4% | 1994 | 30 | NYM | NL | 14 | 4 | 0.778 | 13 | 143 | 2.74 | 153 |
| 10 | Bob Tewksbury | 233 | 76.4% | 1992 | 31 | STL | NL | 16 | 5 | 0.762 | 20 | 91 | 2.16 | 158 |
| Rk | 2001-13 | IP | Out Rate | Year | Age | Tm | Lg | W | L | W-L% | BB | SO | ERA | ERA+ |
| 1 | Clayton Kershaw | 236 | 78.0% | 2013 | 25 | LAD | NL | 16 | 9 | 0.640 | 52 | 232 | 1.83 | 194 |
| 2 | Justin Verlander | 251 | 77.7% | 2011 | 28 | DET | AL | 24 | 5 | 0.828 | 57 | 250 | 2.40 | 172 |
| 3 | Johan Santana | 228 | 77.6% | 2004 | 25 | MIN | AL | 20 | 6 | 0.769 | 54 | 265 | 2.61 | 182 |
| 4 | Matt Harvey | 178.1 | 77.5% | 2013 | 24 | NYM | NL | 9 | 5 | 0.643 | 31 | 191 | 2.27 | 157 |
| 5 | Pedro Martinez | 217 | 77.2% | 2005 | 33 | NYM | NL | 15 | 8 | 0.652 | 47 | 208 | 2.82 | 146 |
| 6 | Derek Lowe | 219.2 | 77.2% | 2002 | 29 | BOS | AL | 21 | 8 | 0.724 | 48 | 127 | 2.58 | 177 |
| 7 | Chris Carpenter | 192.2 | 77.1% | 2009 | 34 | STL | NL | 17 | 4 | 0.810 | 38 | 144 | 2.24 | 182 |
| 8 | Max Scherzer | 214.1 | 76.9% | 2013 | 28 | DET | AL | 21 | 3 | 0.875 | 56 | 240 | 2.90 | 145 |
| 9 | Odalis Perez | 222.1 | 76.8% | 2002 | 24 | LAD | NL | 15 | 10 | 0.600 | 38 | 155 | 3.00 | 127 |
| 10 | Clayton Kershaw | 233.1 | 76.8% | 2011 | 23 | LAD | NL | 21 | 5 | 0.808 | 54 | 248 | 2.28 | 161 |
I’ve grouped the data by decades to reflect that run scoring environments have changed over time as have patterns of pitcher usage. Thus, even though the best results seem very similar throughout the period, one should bear in mind that the earlier data are for pitchers completing a significant proportion of their starts which, of course, is not the case for the latter data.
Presumably pitchers, then as now, become less effective as they tire so that the earlier data would likely show better results were those pitchers used as today’s starters are. Similarly, the later data would likely show worse results were today’s starters used in the same manner as the past.
Now for the Strand Rate. The best seasons are selected based on the Baseball-Reference measurement for Baserunners Allowed. However, I’m also showing the alternative LOB Strand Rate metric for the same selected seasons.
| Rk | 1961-70 | IP | Strand Rate | LOB Strand Rate | BR | R | Year | Age | Tm | Lg | W | L | W-L% | BB | SO | ERA | ERA+ |
| 1 | Bob Gibson | 304.2 | 82.5% | 80.2% | 280 | 49 | 1968 | 32 | STL | NL | 22 | 9 | 0.710 | 62 | 268 | 1.12 | 258 |
| 2 | Dean Chance | 278.1 | 81.2% | 78.3% | 298 | 56 | 1964 | 23 | LAA | AL | 20 | 9 | 0.690 | 86 | 207 | 1.65 | 200 |
| 3 | Tommy John | 177.1 | 78.0% | 74.0% | 205 | 45 | 1968 | 25 | CHW | AL | 10 | 5 | 0.667 | 49 | 117 | 1.98 | 161 |
| 4 | Steve Carlton | 236.1 | 77.9% | 74.5% | 298 | 66 | 1969 | 24 | STL | NL | 17 | 11 | 0.607 | 93 | 210 | 2.17 | 164 |
| 5 | Chris Short | 199.1 | 77.8% | 74.9% | 248 | 55 | 1967 | 29 | PHI | NL | 9 | 11 | 0.450 | 74 | 142 | 2.39 | 143 |
| 6 | Sandy Koufax | 223 | 77.6% | 75.6% | 219 | 49 | 1964 | 28 | LAD | NL | 19 | 5 | 0.792 | 53 | 223 | 1.74 | 186 |
| 7 | Luis Tiant | 258.1 | 77.5% | 75.0% | 236 | 53 | 1968 | 27 | CLE | AL | 21 | 9 | 0.700 | 73 | 264 | 1.60 | 186 |
| 8 | Sandy Koufax | 323 | 77.4% | 75.7% | 328 | 74 | 1966 | 30 | LAD | NL | 27 | 9 | 0.750 | 77 | 317 | 1.73 | 190 |
| 9 | Bob Veale | 245.1 | 77.3% | 74.3% | 295 | 67 | 1968 | 32 | PIT | NL | 13 | 14 | 0.481 | 94 | 171 | 2.05 | 141 |
| 10 | Dick Ellsworth | 290.2 | 77.2% | 74.0% | 329 | 75 | 1963 | 23 | CHC | NL | 22 | 10 | 0.688 | 75 | 185 | 2.11 | 167 |
| Rk | 1971-80 | IP | Strand Rate | LOB Strand Rate | BR | R | Year | Age | Tm | Lg | W | L | W-L% | BB | SO | ERA | ERA+ |
| 1 | Tom Seaver | 286.1 | 78.2% | 75.0% | 280 | 61 | 1971 | 26 | NYM | NL | 20 | 10 | 0.667 | 61 | 289 | 1.76 | 194 |
| 2 | Gaylord Perry | 342.2 | 77.8% | 75.1% | 356 | 79 | 1972 | 33 | CLE | AL | 24 | 16 | 0.600 | 82 | 234 | 1.92 | 168 |
| 3 | Ron Guidry | 273.2 | 77.5% | 74.2% | 271 | 61 | 1978 | 27 | NYY | AL | 25 | 3 | 0.893 | 72 | 248 | 1.74 | 208 |
| 4 | Luis Tiant | 179 | 77.4% | 74.4% | 199 | 45 | 1972 | 31 | BOS | AL | 15 | 6 | 0.714 | 65 | 123 | 1.91 | 169 |
| 5 | Doug Rau | 231 | 76.9% | 72.4% | 308 | 71 | 1976 | 27 | LAD | NL | 16 | 12 | 0.571 | 69 | 98 | 2.57 | 131 |
| 6 | Vida Blue | 312 | 76.9% | 73.1% | 316 | 73 | 1971 | 21 | OAK | AL | 24 | 8 | 0.750 | 88 | 301 | 1.82 | 183 |
| 7 | Jerry Reuss | 237.1 | 76.8% | 73.2% | 314 | 73 | 1975 | 26 | PIT | NL | 18 | 11 | 0.621 | 78 | 131 | 2.54 | 139 |
| 8 | Mike Paul | 161.2 | 76.7% | 73.5% | 215 | 50 | 1972 | 27 | TEX | AL | 8 | 9 | 0.471 | 52 | 108 | 2.17 | 139 |
| 9 | Steve Carlton | 346.1 | 76.5% | 73.1% | 357 | 84 | 1972 | 27 | PHI | NL | 27 | 10 | 0.730 | 87 | 310 | 1.97 | 182 |
| 10 | Nolan Ryan | 284 | 76.5% | 73.5% | 340 | 80 | 1972 | 25 | CAL | AL | 19 | 16 | 0.543 | 157 | 329 | 2.28 | 128 |
| Rk | 1981-90 | IP | Strand Rate | LOB Strand Rate | BR | R | Year | Age | Tm | Lg | W | L | W-L% | BB | SO | ERA | ERA+ |
| 1 | Dwight Gooden | 276.2 | 81.7% | 78.3% | 278 | 51 | 1985 | 20 | NYM | NL | 24 | 4 | 0.857 | 69 | 268 | 1.53 | 229 |
| 2 | Nolan Ryan | 149 | 81.0% | 78.5% | 179 | 34 | 1981 | 34 | HOU | NL | 11 | 5 | 0.688 | 68 | 140 | 1.69 | 195 |
| 3 | Dave Righetti | 105.1 | 78.6% | 76.4% | 117 | 25 | 1981 | 22 | NYY | AL | 8 | 4 | 0.667 | 38 | 89 | 2.05 | 174 |
| 4 | Sammy Stewart | 112.1 | 78.3% | 73.8% | 152 | 33 | 1981 | 26 | BAL | AL | 4 | 8 | 0.333 | 57 | 57 | 2.32 | 157 |
| 5 | Roger Clemens | 228.1 | 78.0% | 74.9% | 268 | 59 | 1990 | 27 | BOS | AL | 21 | 6 | 0.778 | 54 | 209 | 1.93 | 211 |
| 6 | Bob Knepper | 156.2 | 76.8% | 72.1% | 177 | 41 | 1981 | 27 | HOU | NL | 9 | 5 | 0.643 | 38 | 75 | 2.18 | 151 |
| 7 | Orel Hershiser | 256.2 | 76.6% | 72.9% | 321 | 75 | 1989 | 30 | LAD | NL | 15 | 15 | 0.500 | 77 | 178 | 2.31 | 149 |
| 8 | Danny Darwin | 162.2 | 76.3% | 73.4% | 177 | 42 | 1990 | 34 | HOU | NL | 11 | 4 | 0.733 | 31 | 109 | 2.21 | 169 |
| 9 | Steve McCatty | 185.2 | 76.1% | 72.8% | 209 | 50 | 1981 | 27 | OAK | AL | 14 | 7 | 0.667 | 61 | 91 | 2.33 | 148 |
| 10 | Jerry Reuss | 152.2 | 75.7% | 70.7% | 181 | 44 | 1981 | 32 | LAD | NL | 10 | 4 | 0.714 | 27 | 51 | 2.30 | 146 |
| Rk | 1991-2000 | IP | Strand Rate | LOB Strand Rate | BR | R | Year | Age | Tm | Lg | W | L | W-L% | BB | SO | ERA | ERA+ |
| 1 | Bill Swift | 164.2 | 79.2% | 74.5% | 197 | 41 | 1992 | 30 | SFG | NL | 10 | 4 | 0.714 | 43 | 77 | 2.08 | 161 |
| 2 | Greg Maddux | 209.2 | 78.7% | 75.0% | 183 | 39 | 1995 | 29 | ATL | NL | 19 | 2 | 0.905 | 23 | 181 | 1.63 | 260 |
| 3 | Greg Maddux | 202 | 78.1% | 73.8% | 201 | 44 | 1994 | 28 | ATL | NL | 16 | 6 | 0.727 | 31 | 156 | 1.56 | 271 |
| 4 | Roger Clemens | 264 | 77.8% | 74.2% | 293 | 65 | 1997 | 34 | TOR | AL | 21 | 7 | 0.750 | 68 | 292 | 2.05 | 222 |
| 5 | Al Leiter | 193 | 77.1% | 73.8% | 240 | 55 | 1998 | 32 | NYM | NL | 17 | 6 | 0.739 | 71 | 174 | 2.47 | 170 |
| 6 | Greg Maddux | 268 | 77.0% | 73.5% | 296 | 68 | 1992 | 26 | CHC | NL | 20 | 11 | 0.645 | 70 | 199 | 2.18 | 166 |
| 7 | Tom Glavine | 229.1 | 76.4% | 72.8% | 284 | 67 | 1998 | 32 | ATL | NL | 20 | 6 | 0.769 | 74 | 157 | 2.47 | 168 |
| 8 | Kevin Appier | 208.1 | 76.3% | 74.0% | 249 | 59 | 1992 | 24 | KCR | AL | 15 | 8 | 0.652 | 68 | 150 | 2.46 | 164 |
| 9 | Pedro Martinez | 217 | 76.2% | 73.5% | 185 | 44 | 2000 | 28 | BOS | AL | 18 | 6 | 0.750 | 32 | 284 | 1.74 | 291 |
| 10 | Kevin Brown | 233 | 75.6% | 71.0% | 246 | 60 | 1996 | 31 | FLA | NL | 17 | 11 | 0.607 | 33 | 159 | 1.89 | 215 |
| Rk | 2001-13 | IP | Strand Rate | LOB Strand Rate | BR | R | Year | Age | Tm | Lg | W | L | W-L% | BB | SO | ERA | ERA+ |
| 1 | Roger Clemens | 211.1 | 77.4% | 75.0% | 226 | 51 | 2005 | 42 | HOU | NL | 13 | 8 | 0.619 | 62 | 185 | 1.87 | 226 |
| 2 | Jake Peavy | 166.1 | 77.4% | 74.9% | 217 | 49 | 2004 | 23 | SDP | NL | 15 | 6 | 0.714 | 53 | 173 | 2.27 | 171 |
| 3 | Josh Johnson | 183.2 | 76.4% | 73.6% | 216 | 51 | 2010 | 26 | FLA | NL | 11 | 6 | 0.647 | 48 | 186 | 2.30 | 180 |
| 4 | Clayton Kershaw | 236 | 76.1% | 72.5% | 230 | 55 | 2013 | 25 | LAD | NL | 16 | 9 | 0.640 | 52 | 232 | 1.83 | 194 |
| 5 | Chris Carpenter | 192.2 | 75.7% | 71.5% | 202 | 49 | 2009 | 34 | STL | NL | 17 | 4 | 0.810 | 38 | 144 | 2.24 | 182 |
| 6 | Clay Buchholz | 173.2 | 75.7% | 71.1% | 226 | 55 | 2010 | 25 | BOS | AL | 17 | 7 | 0.708 | 67 | 120 | 2.33 | 187 |
| 7 | Daisuke Matsuzaka | 167.2 | 75.1% | 72.8% | 233 | 58 | 2008 | 27 | BOS | AL | 18 | 3 | 0.857 | 94 | 154 | 2.90 | 160 |
| 8 | Zack Greinke | 229.1 | 75.1% | 71.8% | 257 | 64 | 2009 | 25 | KCR | AL | 16 | 8 | 0.667 | 51 | 242 | 2.16 | 205 |
| 9 | Pedro Martinez | 186.2 | 74.9% | 72.5% | 207 | 52 | 2003 | 31 | BOS | AL | 14 | 4 | 0.778 | 47 | 206 | 2.22 | 211 |
| 10 | Adam Wainwright | 233 | 74.8% | 72.3% | 298 | 75 | 2009 | 27 | STL | NL | 19 | 8 | 0.704 | 66 | 212 | 2.63 | 155 |
Some of the pitchers and seasons are the same but overall a different mix of pitchers. The common factor is that you won’t make either list without having an outstanding season, as evidenced by the gaudy ERAs on display. Also of note that while the data are much the same throughout the period, there is clearly more variability among the best seasons for Strand Rate than for Out Rate, with the logically consistent result that, even among the best pitchers, it’s harder to have a high Strand Rate in a high run scoring environment than in a low one.
Looking at performance across seasons, below are the top 10 results by decade for pitchers with a minimum 500 IP in that decade. This brings both starters and relievers into the mix. While this undoubtedly gives relievers an advantage over starters in that the relievers need only maintain their performance for a limited number of innings in each appearance, I was interested in looking at both, so here they are. As will be seen, relievers have become increasingly dominant in these metrics in the most recent decades.
I’ve grouped the results by league and for MLB overall. For these data, the Strand Rate shown is for the LOB Strand Rate metric. The Combined Rate is the harmonic man of the Out Rate and Strand Rate.
- Combined Rate = (2 x Out Rate x Strand Rate) / (Out Rate + Strand Rate)
Here are the decade leaders. To go directly to a decade, type its first year (ending in 1) in the Search box. To find a particular pitcher, type his name there.
[table id=174 /]
.
[table id=175 /]
.
[table id=176 /]
.
The numbers for Out Rate and Strand Rate are close to each other for the leading pitchers because keeping batters off base is, of course, also a very effective way of keeping baserunners from scoring. Conversely, those numbers will start to diverge as pitcher skill (and team defense) diminishes. The right column gives an indication of how wide that divergence can become. (Of course, there are exceptions – LaMarr Hoyt had the 5th highest AL out rate of the 1980s, but a strand rate more than 16 points lower, the largest divergence of any AL pitcher in that decade).
For those of a statistical bent, here is what these data look like.
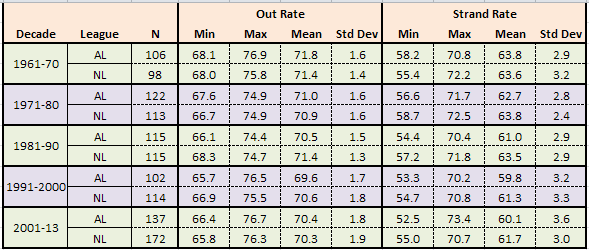
Incidentally, virtually every pitcher, over the course of a decade, will be better at keeping batters off base than at preventing runners from scoring. These are the only exceptions:
| Name | League | Decade | Out Rate | Strand Rate | Combined Rate |
| Gary Lavelle | MLB | 1971-80 | 69.8 | 72.2 | 71.0 |
| Ron Perranoski | MLB | 1961-70 | 70.8 | 72.4 | 71.6 |
| John Franco | MLB | 1991-2000 | 69.5 | 70.8 | 70.1 |
| Carlos Marmol | MLB | 2001-13 | 68.9 | 69.9 | 69.4 |
| Mark Clear | MLB | 1981-90 | 66.1 | 67.1 | 66.6 |
| Clay Carroll(*) | NL | 1971-80 | 71.8 | 72.5 | 72.1 |
| John Hiller | MLB | 1971-80 | 71.1 | 71.7 | 71.4 |
| Heathcliff Slocumb | MLB | 1991-2000 | 66.4 | 66.7 | 66.5 |
(*) Clay Carroll had a higher Strand Rate than Out Rate for his NL work, but not for his combined AL and NL results.