
This one’s a bit dry, but Andy fed me a good lead-in, so here goes.…
What happened to the plate appearances once taken by the 14th and 15th hitters on a roster, now that those spots have gone to relievers? Have they been spread evenly among regulars and remaining bench players, or what?
That question arose when I noticed that only 140 players qualified for the batting title last year, the lowest full-season total since 1992. That surprised me. Yes, the number of qualifiers tends to fall when scoring does, but I thought that would be offset by the roster shift: Surely some of the 200+ PAs from the 14th and 15th hitters would have gone to regulars.
The data says no, as I read it. Even though game substitutions are down in the last 20 years (as Andy showed), regulars as a group have actually lost some PAs to the bench players.
A series of charts is coming, but first, some more background.
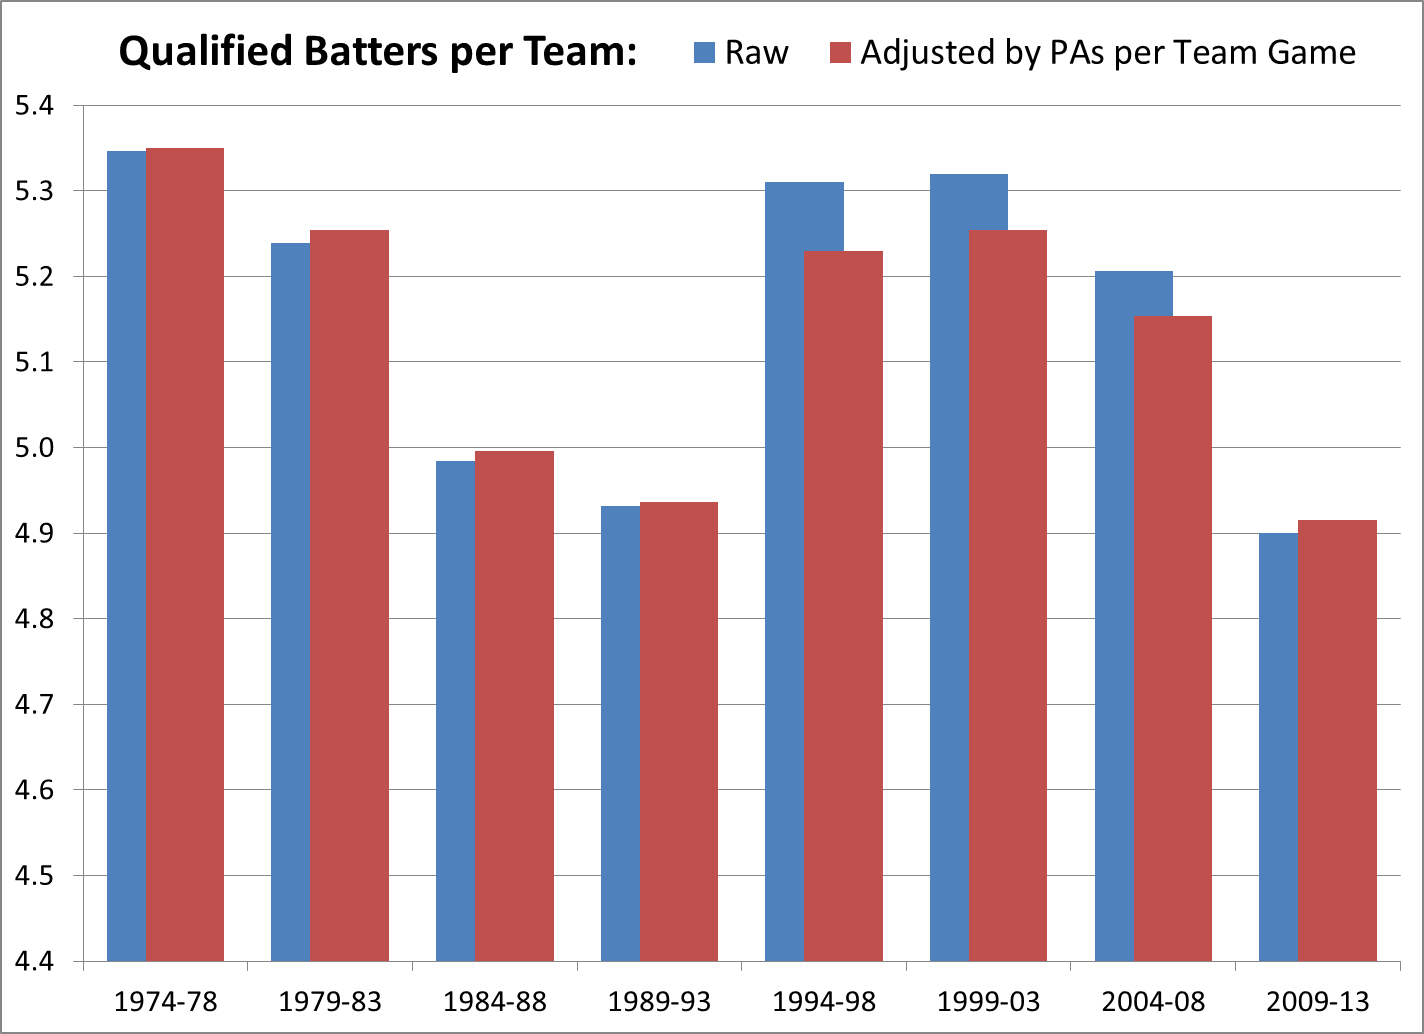
- The 2013 average of 4.67 qualifiers per team is the lowest since 1984.
- The 5-year average for 2009-13 is the lowest since the DH began, and the 3rd-lowest 5-year mark in modern history.
And it’s not just the scoring decline at work; those distinctions hold true even after adjusting all numbers by the historical average of PAs per game.
Aside: Generally, more runs = more PAs = more qualifiers. So adjusting individual PAs based on the average PAs per team-game should dilute the scoring effect. This chart shows how that affects qualifying rates for 1974-2008; the adjustment is noticeable in the highest-scoring periods, barely so otherwise:
Anyway, seeing the drop in qualifying rates, I set out to find those PAs that used to go to the 14th and 15th hitters, looking at data in 5-year blocks. Based on reliever usage, it seems the first bat-to-reliever shift came during 1989-93:
- In 1988, just 4 of 26 teams had at least 6 pitchers with 25+ relief outings.
- By 1993, 21 of 28 teams met that standard.
So I’m focused on changes from 1984-88 to the present. But for a frame of reference, I included the years back to 1974.
For each 5-year block, I computed the average PAs by a team’s #1 in PAs, then by their #2, etc., down through #16 (excluding pitchers). Some notes on the method, then we’ll get to the charts:
- No team keeps the same position players through a whole season, so I looked at roster spots through #16.
- The method is not actually team-based. Instead, for N=the number of team-seasons in a given 5-year block, I designated the top N player-seasons in PAs as the #1’s, the next N seasons as the #2’s, etc. For example, in 1974-78, there were 124 team-seasons (3 years of 24 teams and 2 of 26), so the top 124 player-seasons in that span are the #1’s, etc. This seems like a fair simulation of team make-up, with much less work.
- I adjusted those averages based on the average PAs per team-game during the whole period. So the numbers for 1994-98 (high of 38.86 PA/G) dropped a little, while those of 2009-13 (low of 38.14 PA/G) rose a little.
- PAs for shortened seasons were projected to a full schedule.
The first set of charts shows each individual spot, #1-16:
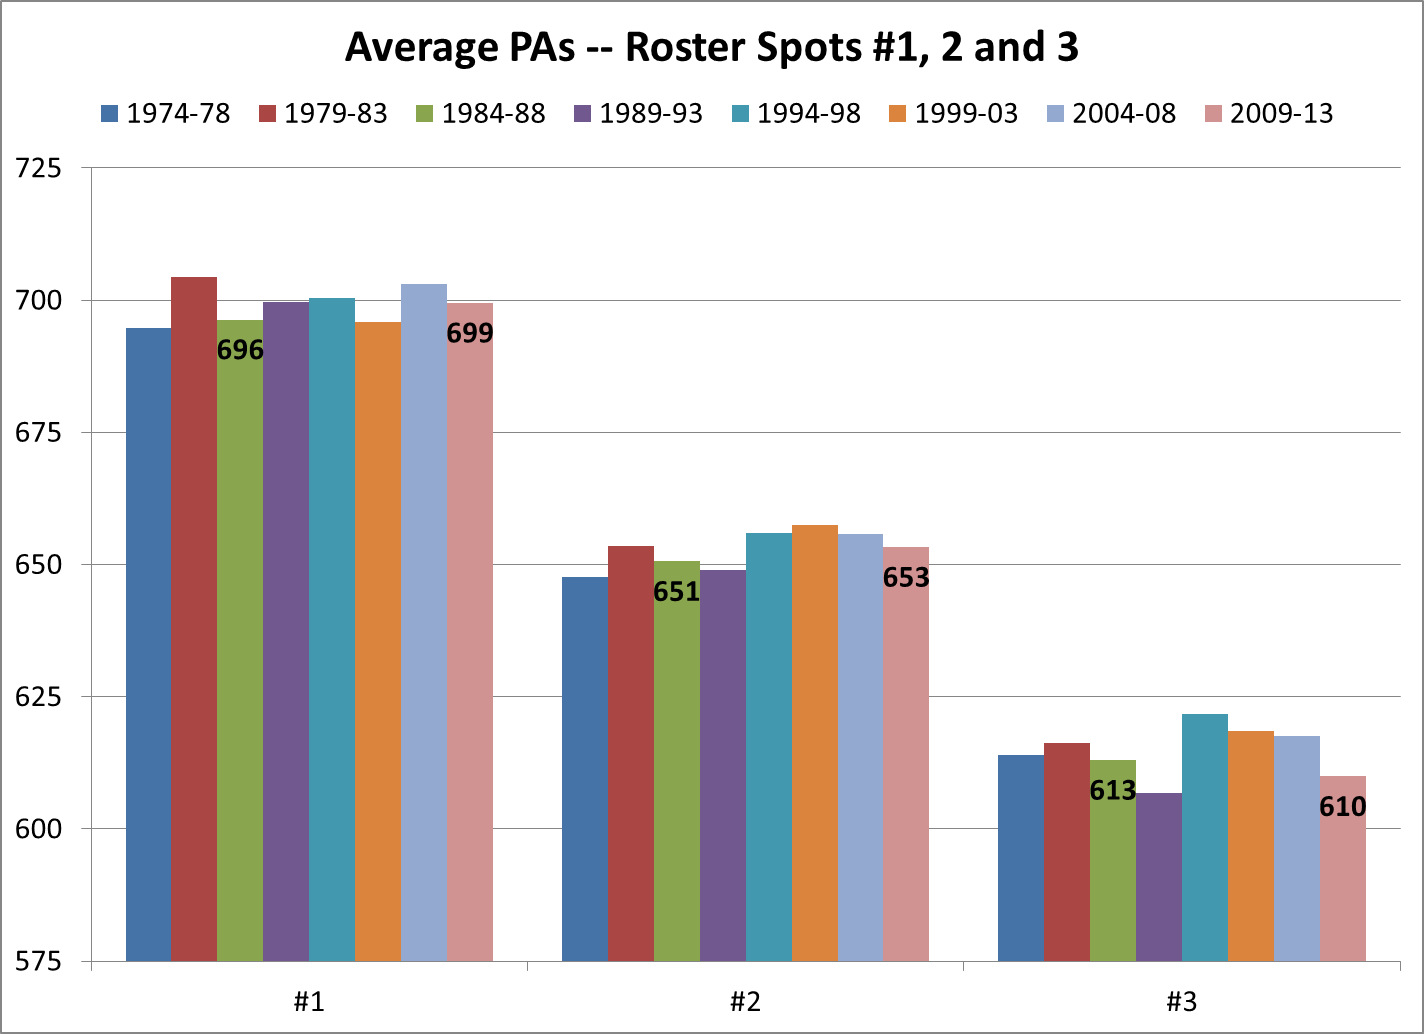
Spots #1, 2 and 3 show minimal change during this span.
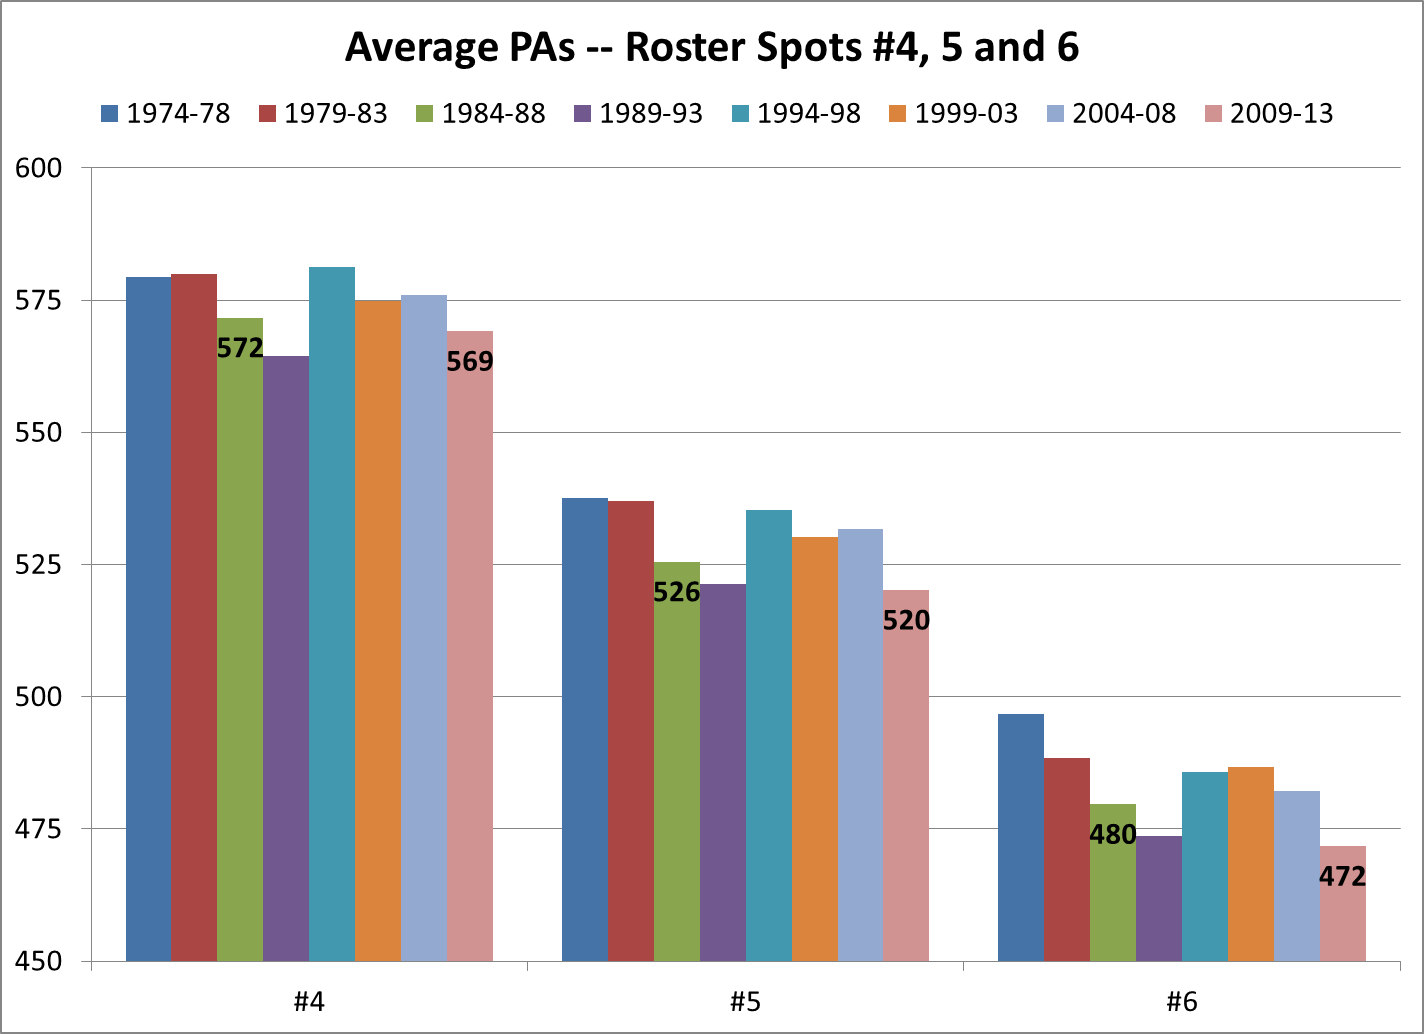
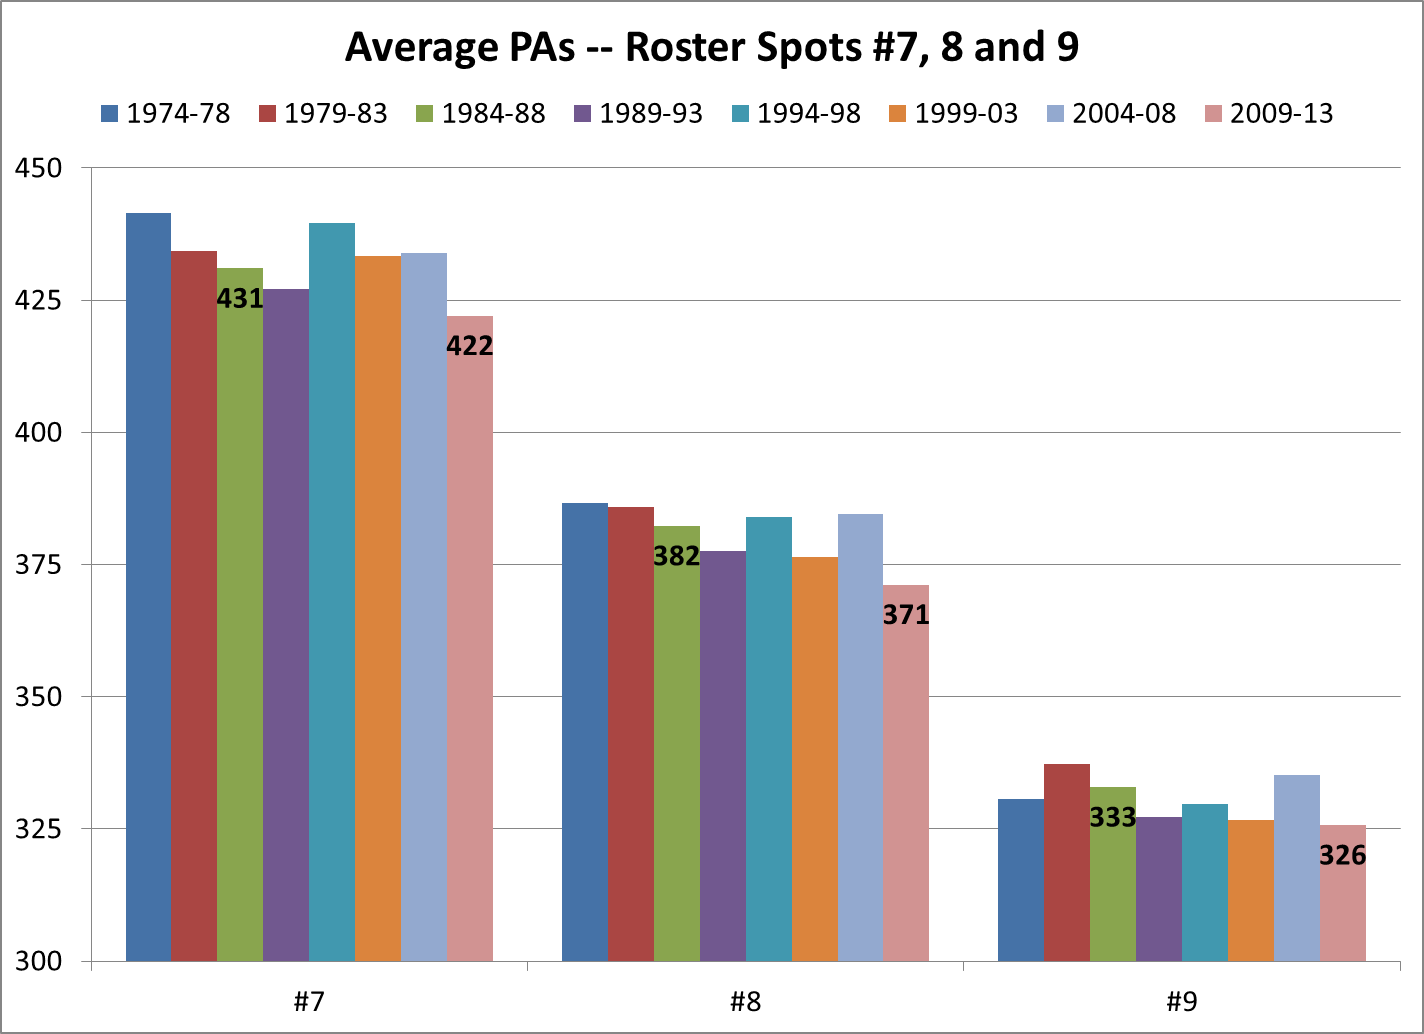
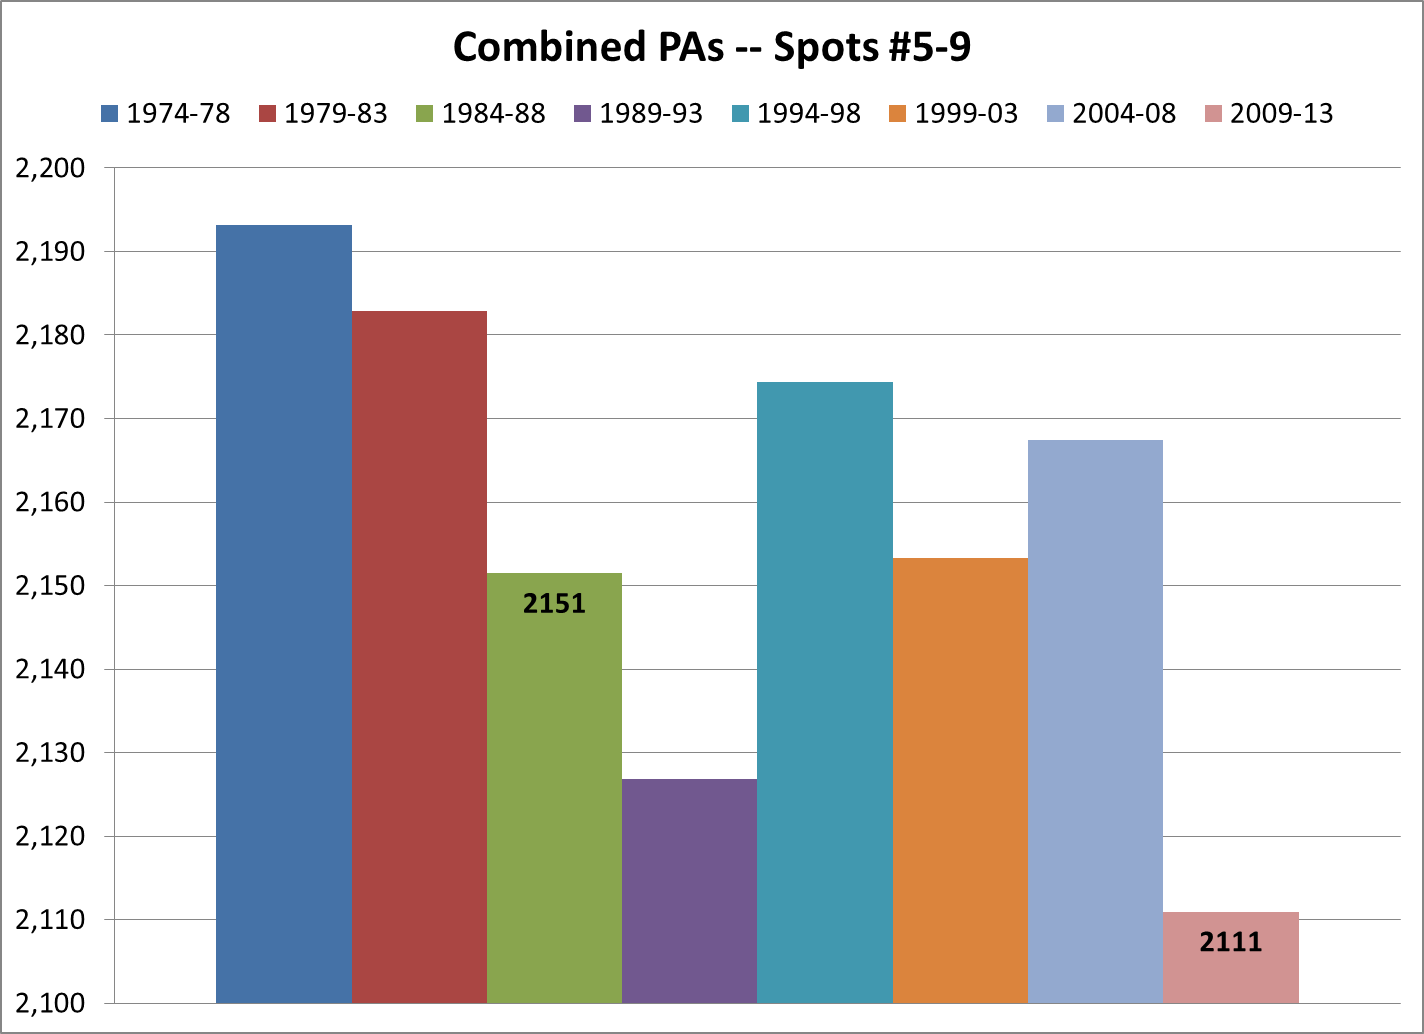
Spots #5 and 6 show a soft downward trend, which continues through spots #7 and 8:
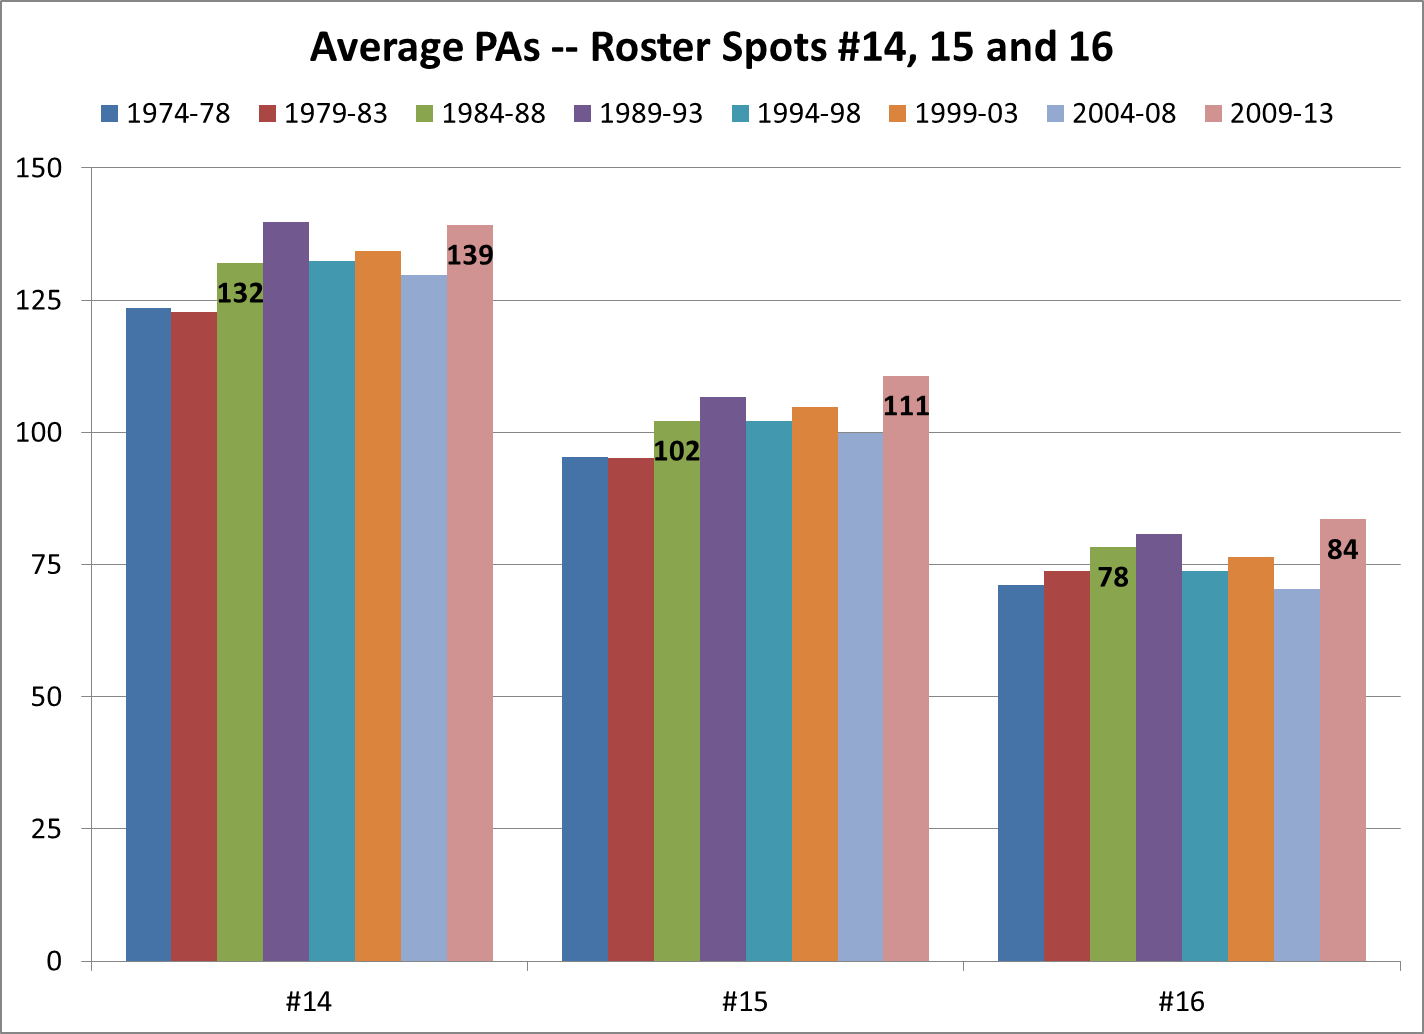
Now the bench spots:
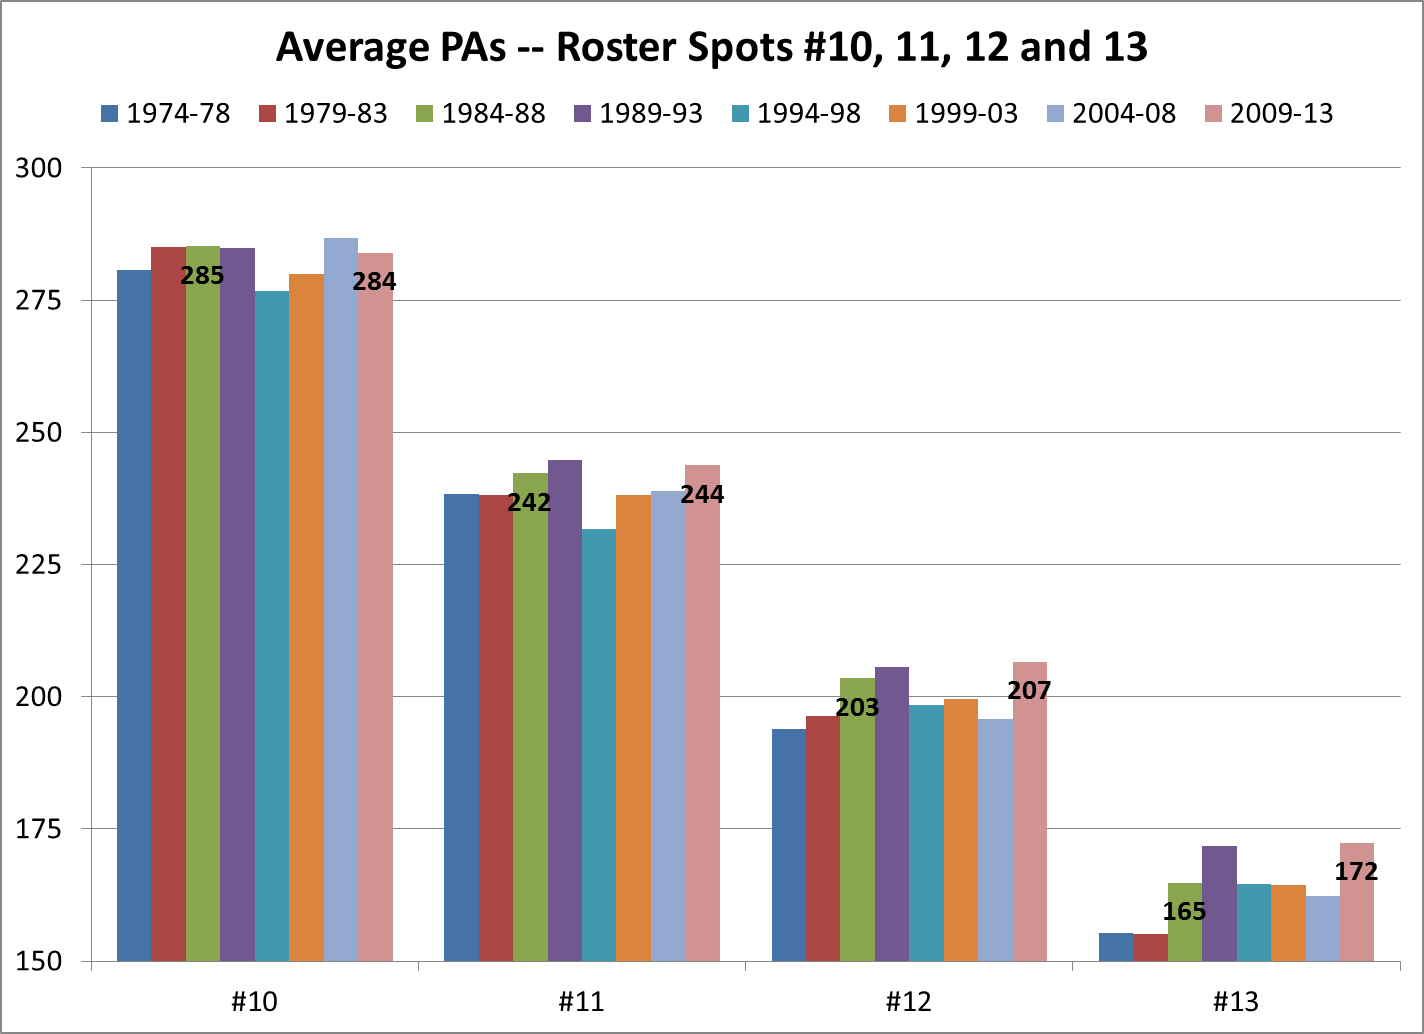
The top bench spots have held pretty steady, while the deeper spots are trending upwards. Note that these last three spots (below) technically don’t exist for a modern team at any given time:
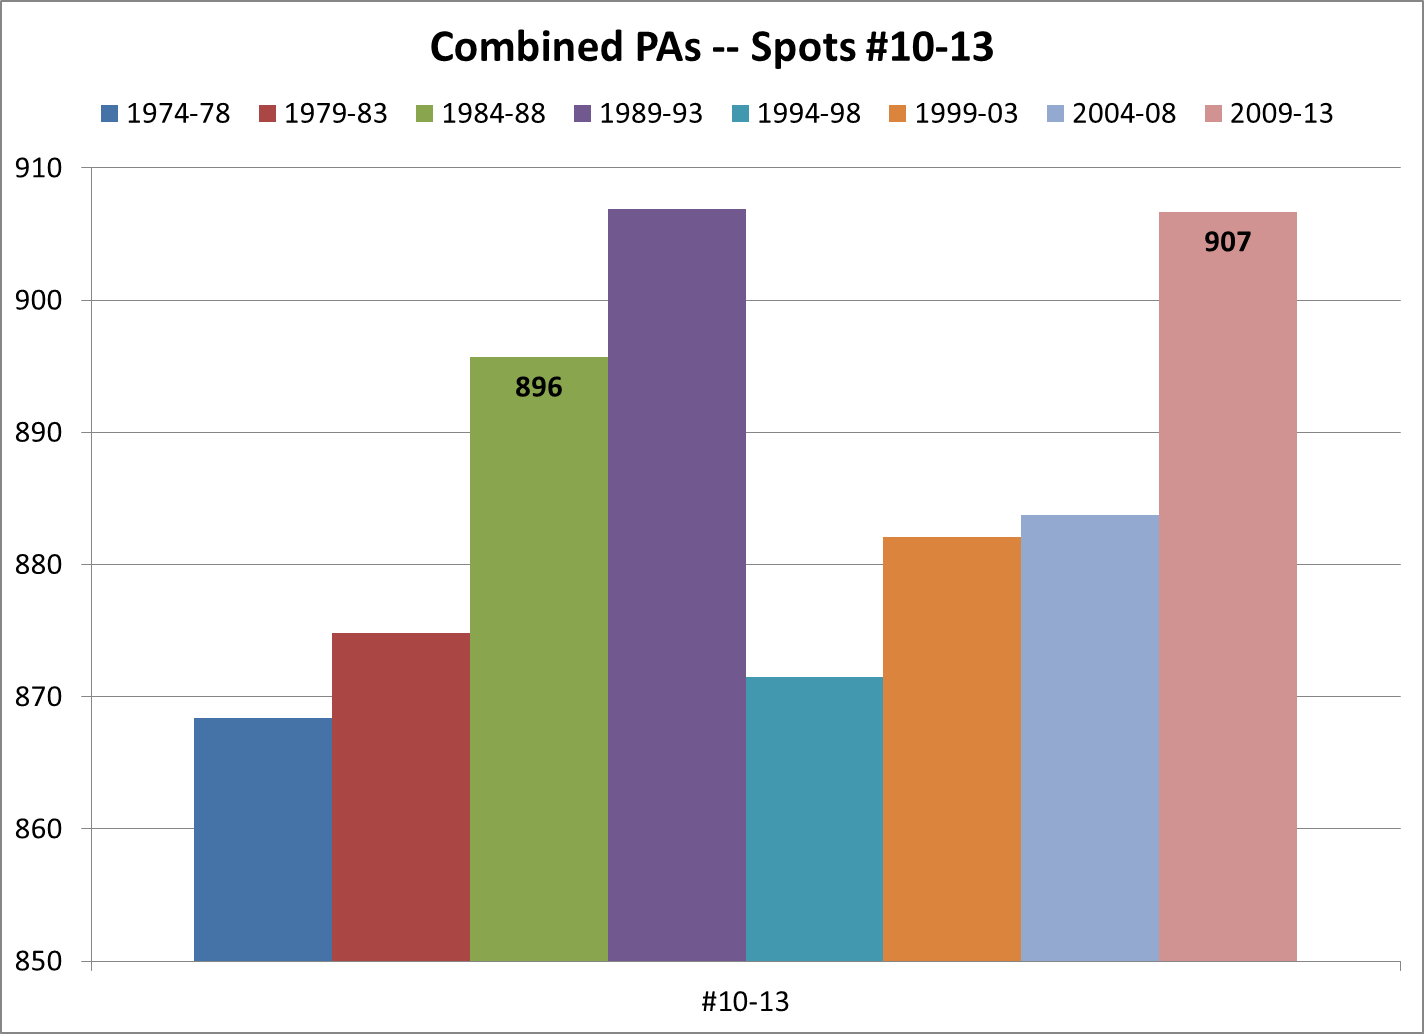
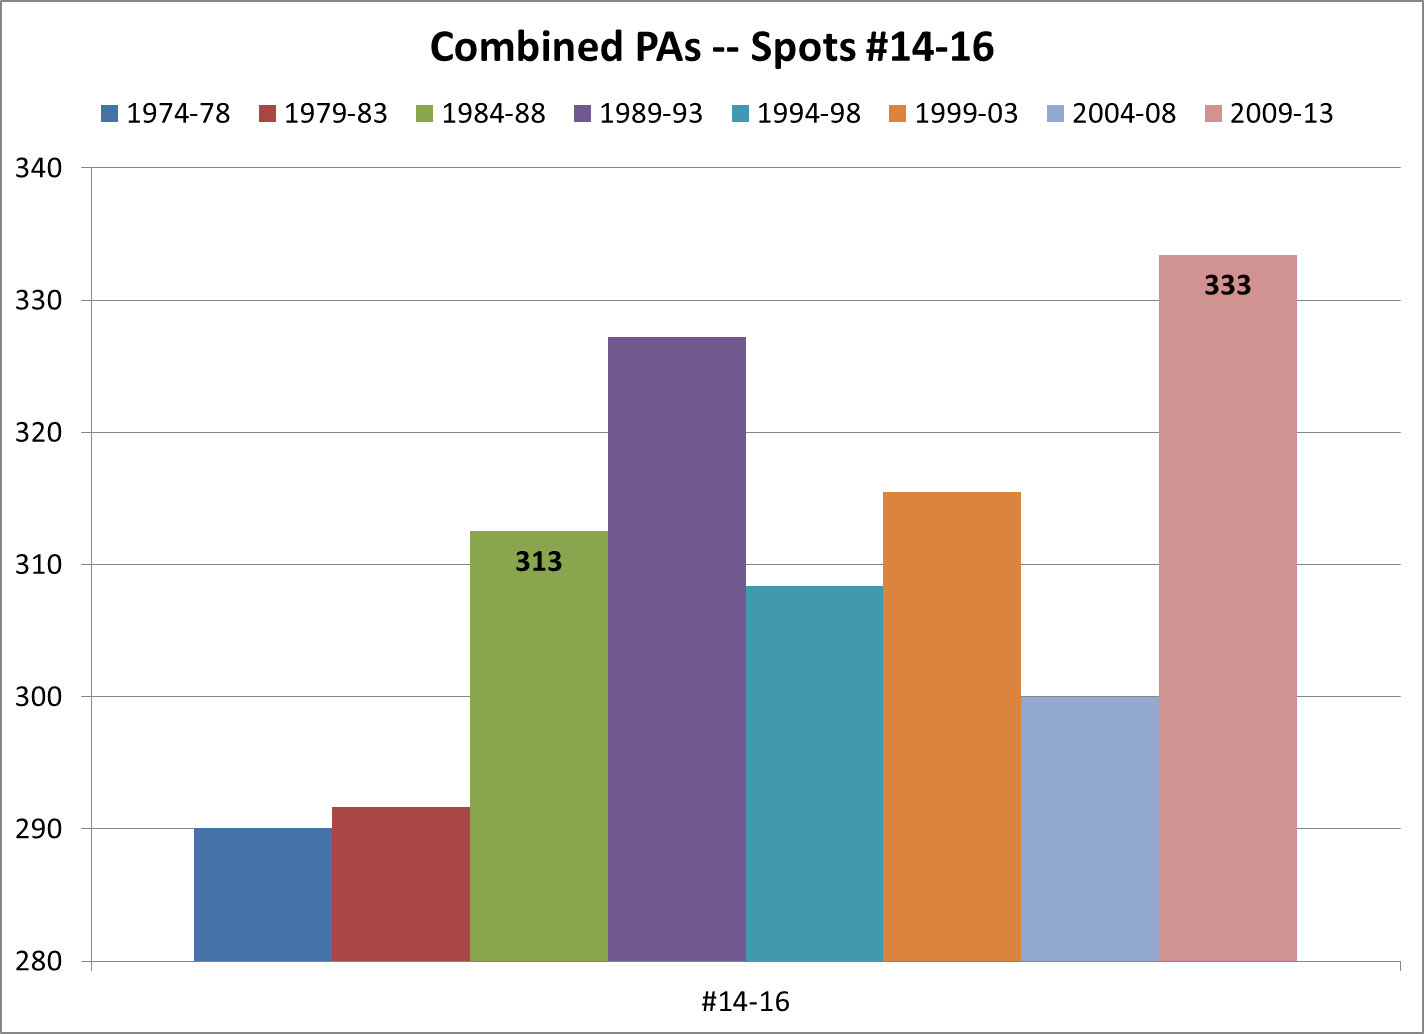
Now for a bigger picture, here are combined PAs in four groups: spots #1-4, #5-9, #10-13 and #14-16. I’ve drawn the PA scale very fine to highlight the changes; don’t be misled by the size of the bars:
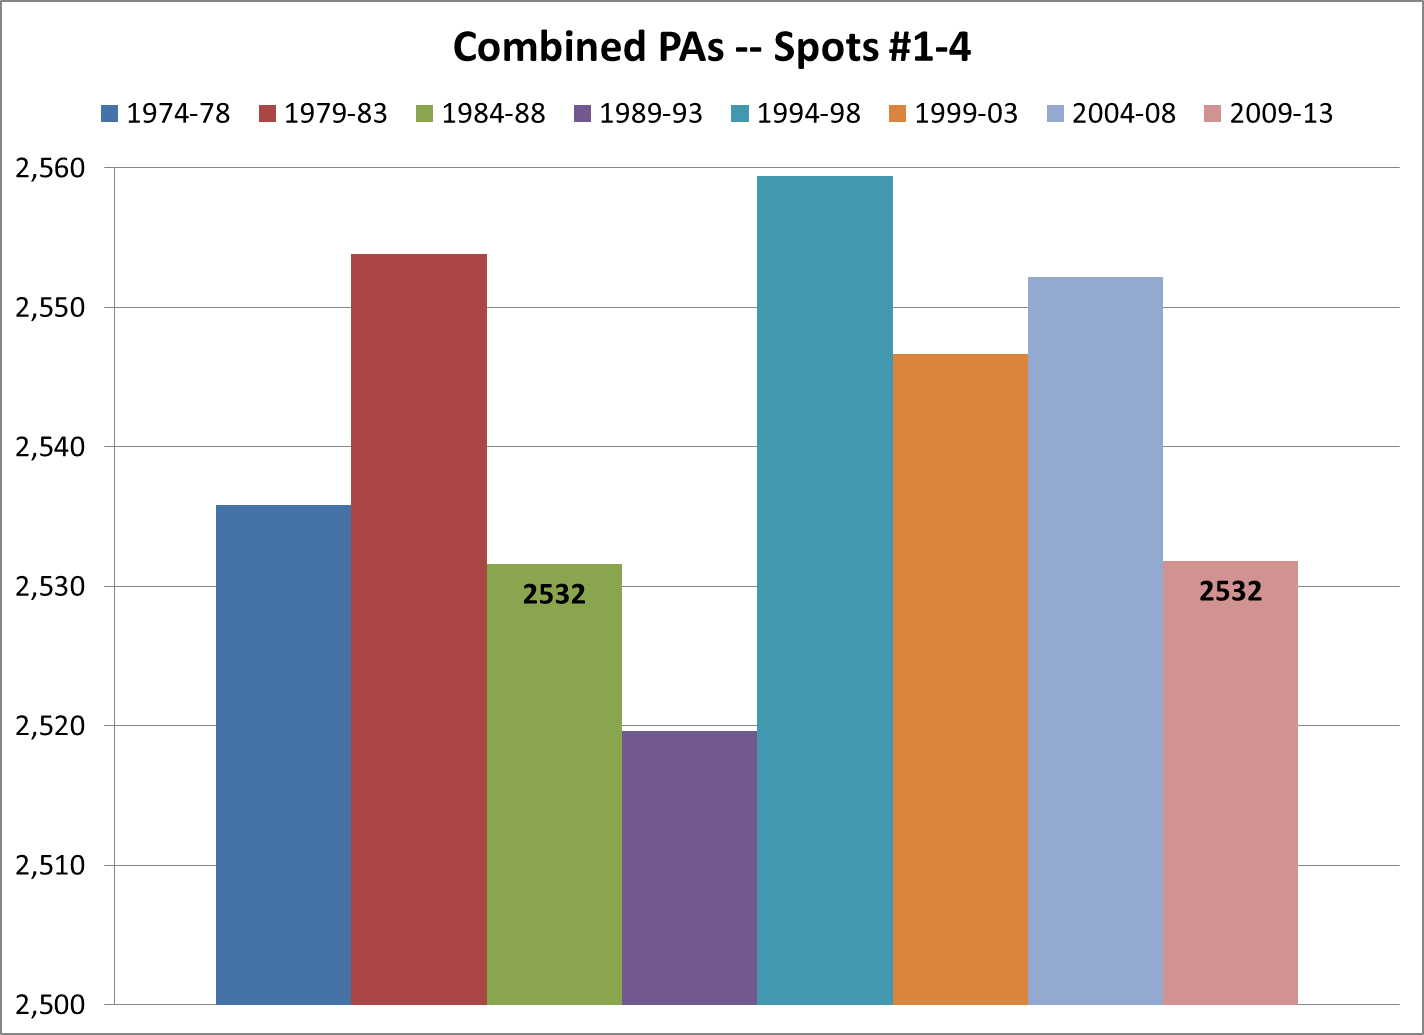
Some broad observations:
— Spots #10-13 peaked in 2009-13. Taken by itself, that might suggest those spots had absorbed some PAs from the lost roster spots. But spots #14-16 also peaked in this era. And the up-and-down pattern of spots #10-13 since 1984-88 doesn’t fit the absorption theory.
— The 1989-93 decline in PAs by regulars could show a lag between game strategy and the loss of the 15th hitter. If managers tended to play by the old rules for a while before adjusting to their shortened bench, that could lead to fewer PAs for regulars. By 1990, most teams carried 6 relievers; but Andy’s chart shows that PAs by substitutes rose in ’89, ’90 and ’91 — reaching a high for the DH era — and then declined, with the average for 1989-93 well above that of the next 20 years.
To parse this out further, consider reliever usage in the NL, where the pitcher’s spot in the batting order is a factor: From 1988 to ’93, relievers per game rose 27%, from 1.85 to 2.35. If managers made these additional pitching moves under their old paradigm regarding the pitcher’s spot in the order and the depth of their bench, they would end up using more double-switches and pinch-hitters than before.
— The 1994-98 peak for spots #1-4 could mainly come from the 1994 strike. That season ended abruptly on August 11, masking the PA impact of recent injuries — Jeff Bagwell broke his hand on Aug. 10, and wound up as the MVP even though he would not have qualified for the batting crown in a full season — along with injuries that would have occurred had the year been played out. The qualified rate for 1994 was the highest since the 1930s.
— The #5-9 peak in 1974-78, and corresponding lows for the bench spots, suggest that teams used more stable lineups. The DH was one factor, as more AL teams used a regular DH than they do now. In 1974-78, player-seasons with 100+ starts at DH averaged 6.1 per 15 AL teams; in 2009-13, that average was 4.6 per 15 teams.
Net changes from 1984-88 to 2009-13, per team-season:
- Top 4 spots — No change.
- #5-9 — Minus 40 PAs.
- #10-13 — Plus 11 PAs.
- #14-16 — Plus 20 PAs.
(The 9 PAs not accounted for went to players not covered in this study, including pitchers.)
Conclusions
In general, it seems that regulars have not absorbed PAs from the two lost roster spots. In fact, bench players take more PAs now than they did when benches were deeper. In particular, spots #14-16 take more PAs, even though teams carry just 13 hitters at a time.
In the course of a season, a few more players now get an extended look. Players with 100-200 PAs averaged:
- 91 per 30 teams in 1984-88;
- 98 per 30 teams in 2009-13.
And more of those players are inexperienced now. Of those with 100-200 PAs:
- in 1984-88, 35% were in their first three MLB seasons;
- in 2009-13, 48% were in their first three seasons.
So perhaps the following is true, to some extent: Bench roles now are more overlapped with player development. The 14th and 15th roster spots still exist, in a sense, but they’re in transit. Fewer scrubs nowadays stay on the roster all year. The bench as a unit plays a bit more now, but the individuals in those roles do more shuttling between majors and minors, based on their performance and the team’s changing needs.
One more piece of data may tend to support that reading: In 1984-88, those with 100-200 PAs at age 25 or under got the bulk of their PAs in the 2nd half of the season (39/61% split), while in 2009-13 they got more PAs in the 1st half (55/45%). Presumably, those young bench players in 1984-88 contained more late-season call-ups than today’s bunch, while 2009-13 includes more young players getting an earlier look in a limited role.
Odds & Ends
— By studying PAs rather than games played, I’ve glossed over the role of defensive substitute — which Andy’s chart suggests is the role most affected by the roster shift. Perhaps a follow-up study….
— By focusing on 1984-88 vs. 2009-13, I’ve ignored potentially interesting trends in the other periods. But it’s harder to read the PA data in terms of the second roster shift (7th reliever in place of 14th hitter), because that was more gradual than the first. The number of teams with at least 7 pitchers with 25+ relief outings, in 2-year jumps:
- 1996 — 8
- 1998 — 13
- 2000 — 11
- 2002 — 17
- 2004 — 20
- 2006 — 21
- 2008 — 27
- 2010 — 25
- 2012 — 25
— Considering the full span in more general terms, there’s almost no net change in spots #1-4, but a substantial change in spots #5-9 — minus-82 PAs since 1974-78. The biggest piece of that change comes in spot #6 (-25 PAs), with spots #5, 7 and 8 shedding about 18 PAs each. Since qualifiers average about 5 per team over the span, the downshift in PAs for spots #5-9 neatly fits the decline in qualifiers. Whether that’s just a tautology or something more interesting, I don’t know.
__________
Lastly, a tangent on scoring and PAs. The 2009-13 average of 4.35 runs per game nearly matched the modern average of 4.38 (since 1903, when the AL adopted the foul-strike rule). Out of 22 5-year blocks since 1904, 2009-13 ranks 12th in scoring — but 10th in scoring efficiency (runs per PA), due to a high HR rate that helps offset the low rates of hits and walks.
Ranks for 2013 alone, out of 110 years since 1904:
- 80th in hits per game;
- 86th in walks per game; and
- 88th in [hits+walks] per game, the lowest mark of the DH era. But …
- 76th in runs per game, thanks to …
- 19th in HRs per game — above any year outside the steroids era, except 1987.
As always, I would love to hear your interpretations and suggestions for further study.