
Toronto visited frigid Minneapolis last week and played 3 games in sub-40 degree weather, the last two in a double-header occasioned by a snow-out the day before. But, that’s not what this post is about. Rather, it’s about what happened in the series finale when the Blue Jays took a 5-3 lead into the 8th inning, with apparently good prospects for splitting the twin-bill and taking the rubber match of the series.
But, it didn’t work out that way. Instead, assorted Toronto relievers walked 8 Twins in the frame, resulting in 6 runs scored with just one batted ball leaving the infield. Those 8 walks were among 12 issued during the game, only the 2nd time since 2012 that a team has been so generous in a 9-inning game. Going back a little further, it was the 10th such game since 2008. But, that compares very favorably with the 6 prior years (2002-07) when there were 23 such contests.
After the jump, more on games when nobody on a pitching staff seems able to find the plate.
Here’s a chart showing the frequency of 12-walk games by season, in absolute terms and as a percentage of all games. Note that the percentages are charted against a logarithmic scale.
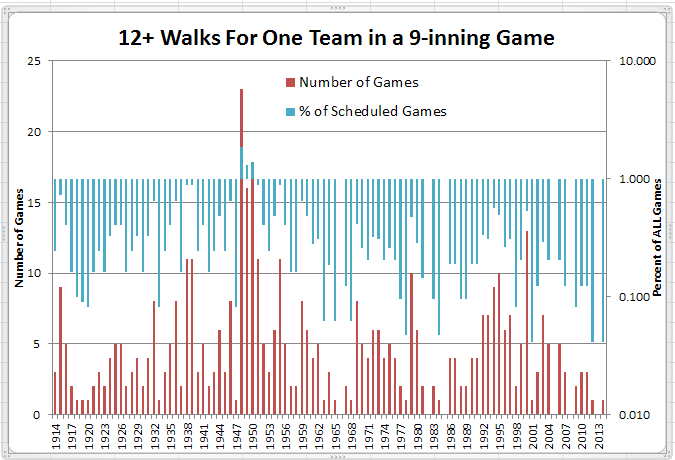
So, the frequency has been all over the map, ranging from once every 1000 games or less to almost once every 50 games in the late 1940s (about once a week, then). While drawing inferences about general patterns based on extreme events is inadvisable, the above patterns are at least consistent with what would be expected based on run scoring environment. That is, there are more of these extreme events when runs are cheap than when runs are dear. But, that remarkable spike in the late 1940s deserves closer attention. I’ll return to that later.
Those totals are ever so slightly inflated by dint of double-counting games when both teams issued 12+ walks. That’s happened 3 times since 1914, in these contests.
| Rk | Tm | Opp | Date | IP | BB |
|---|---|---|---|---|---|
| 1 | HOU | SFG | 1975-05-04 (2) | 18.0 | 26 |
| 2 | CLE | CHW | 1953-04-18 | 17.0 | 26 |
| 3 | DET | PHA | 1916-05-09 | 18.0 | 30 |
Those 30 walks (the most for two teams in a 9-inning game) in the Detroit-Philadelphia game break down as 12 for the Tigers and 18 for the Athletics. Connie Mack, manager of those hapless 36-117 As, got 12 walks contributed by just one pitcher, the unfortunate Carl Ray, who got his “walking papers” (no pun intended) from Mack after the game, never to return to the bigs.
Those 18 walks are the most for one team in a 9-inning game, a feat matched by the 1948 Red Sox, in this game.
| Rk | Date | Tm | Opp | Rslt | IP | H | R | ER | BB | SO | HR | WP | # of Pitchers Used |
|---|---|---|---|---|---|---|---|---|---|---|---|---|---|
| 1 | 1948-05-20 | BOS | CLE | L 4-13 | 8.0 | 8 | 13 | 11 | 18 | 7 | 1 | 1 | 2 |
Eleven of the 18 walks were courtesy of a 19 year-old fireballer named Mickey McDermott, making the 3rd apperance of his career. For his rookie season, McDermott struck out 17 in 23.1 IP (almost Ryan-esque for that time) but still posted a SO/BB ratio below 0.5. Happily, he enjoyed a better fate than Carl Ray, going on to pitch in almost 300 games (and make almost 150 pinch-hit appearances).
What is the largest number of walks surrendered by one pitcher in a 9-inning game? These are the pitchers who have exceeded Carl Ray’s total of 12.
| Rk | Player | Date | Tm | Opp | Rslt | IP | H | R | ER | BB | SO | HR |
|---|---|---|---|---|---|---|---|---|---|---|---|---|
| 1 | Bruno Haas | 1915-06-23 (2) | PHA | NYY | L 7-15 | 9.0 | 13 | 15 | 8 | 16 | 4 | 0 |
| 2 | Dick Weik | 1949-09-01 | WSH | CHW | L 0-3 | 7.0 | 3 | 3 | 2 | 13 | 7 | 0 |
| 3 | Pete Schneider | 1918-07-06 | CIN | PHI | W 10-9 | 8.0 | 1 | 6 | 6 | 13 | 1 | 0 |
Inasmuch as this was Bruno’s career debut, Mack gave him a little rope. But, only a little. Haas had 4 more walks in his next start, to match the number of outs he recorded. That was the end of Haas’s time as a starter. He finished up his brief career with 4 relief appearances totaling 4 IP with 8 more walks for a total of 28 in 14.1 IP, good for the second highest career BB/9 rate for pitchers with at least 9 IP. Top spot on that list goes to another one-season “wonder”, Red Bullock.
Bullock was a university graduate who made his professional debut in 1936 for Mack’s As. But, after 10 relief appearances totaling 12.1 IP, he had allowed 25 walks and was sporting a 15.32 ERA. Remarkably, that performance earned him a promotion to the starting rotation (possibly on the strength of his last outing of 3 IP and only one free pass). Two starts totaling 4.1 IP and 12 walks marked the end of Bullock’s season. By next year, Mack had unloaded him on the Cubs where he closed out his professional career with 3 games for the Class B Piedmont club.
Back to our list. Dick Weik had been a 1948 September call-up for the Senators, debuting with three starts totaling 12.1 IP, and a 15.39 BB/9. That might have given Washington some pause, but apparently not enough to keep Weik off the 1949 opening day roster. It wasn’t all bad – Weik did lower his season BB/9 under 10. And, he kept it there, for the most part, for the four remaining seasons of his brief career. Still, his career BB/9 of 9.98 is the highest (by almost two walks) of any pitcher with 200 IP.
Finally, Pete Schneider, who went 8 innings and picked up the win! Schneider had debuted for the 1914 Reds as an 18 year-old and had shown decent control over his first 4 seasons with 3.1 BB/9 and a 111 ERA+, including a 20 win season in 1917. Whether it was the 1000+ IP by age 21 or something else, Schneider lost his control in 1918, ballooning to 4.9 BB/9 and, after a brief stint with the Yankees in 1919, his major league career was done.
Getting back to the late 1940s spike in 12-walk games, there were 67 such games from 1948 to 1951, more than 1.35% of games played, a far higher proportion than for any other single season, never mind a four-season average. Why would that be? My hypothesis is that wartime casualties resulted in a shortage of capable pitchers. To check that out, here are the number of pitchers aged 25-28 with 50+ IP for those seasons and the ones before and after.
| Year ▴ | Age 25-28Pitchers |
|---|---|
| 1946 | 47 |
| 1947 | 49 |
| 1948 | 45 |
| 1949 | 39 |
| 1950 | 32 |
| 1951 | 30 |
| 1952 | 37 |
| 1953 | 41 |
| 1954 | 44 |
The dropoff during 1948-51 is evident, with the age 25-28 pitchers corresponding with players most likely to have seen military service during the war. So, if there were fewer pitchers in their career primes, how were they being replaced? You’ve probably already guessed, but here’s the answer, showing number of 50+ IP pitchers aged 18-22.
| Year ▴ | Age 18-22Pitchers |
|---|---|
| 1946 | 4 |
| 1947 | 9 |
| 1948 | 15 |
| 1949 | 13 |
| 1950 | 14 |
| 1951 | 10 |
| 1952 | 11 |
| 1953 | 7 |
| 1954 | 9 |
Part of the change can be traced to the introduction of the “bonus baby” system. But, only part, as indicated by the decline heading into the mid-1950s.
Finally, can those 12-walk games be traced to an increased presence of wild pitchers? We’ve seen two of them in McDermott and Weik. Were there others? Here’s a table indicating that there was indeed a spike in wild pitchers during 1948-51.
| Year ▴ | 20+ IP, BB/9 > 8 | 50+ IP, BB/9 > 6 |
|---|---|---|
| 1946 | 2 | 6 |
| 1947 | 1 | 1 |
| 1948 | 4 | 13 |
| 1949 | 9 | 9 |
| 1950 | 10 | 10 |
| 1951 | 5 | 4 |
| 1952 | 3 | 4 |
| 1953 | 2 | 3 |
| 1954 | 2 | 5 |
With a shortage of pitchers in their prime years, it does appear that the replacements that were found may not all have been of major league caliber, with that lack of physical skill or mental maturity being evidenced in bouts of wildness.
To close, here are the starting pitchers of 1948-51 who most often allowed more walks than innings pitched.
| Rk | Player | #Matching | W | L | GS | CG | IP | BB | SO | ||||
|---|---|---|---|---|---|---|---|---|---|---|---|---|---|
| 1 | Tommy Byrne | 39 | Ind. Games | 6 | 19 | .240 | 6.64 | 39 | 5 | 192.1 | 273 | 119 | 2.32 |
| 2 | Johnny Schmitz | 16 | Ind. Games | 0 | 12 | .000 | 14.20 | 16 | 0 | 32.1 | 53 | 10 | 3.37 |
| 3 | Fred Sanford | 16 | Ind. Games | 0 | 10 | .000 | 12.55 | 16 | 0 | 52.1 | 74 | 32 | 2.92 |
| 4 | Dick Weik | 15 | Ind. Games | 1 | 13 | .071 | 7.50 | 15 | 0 | 54.0 | 103 | 34 | 2.83 |
| 5 | Billy Pierce | 15 | Ind. Games | 0 | 8 | .000 | 11.33 | 15 | 0 | 47.2 | 74 | 30 | 2.66 |
| 6 | Cliff Fannin | 15 | Ind. Games | 0 | 11 | .000 | 14.31 | 15 | 1 | 44.2 | 70 | 29 | 2.98 |
| 7 | Mickey McDermott | 14 | Ind. Games | 1 | 5 | .167 | 13.30 | 14 | 0 | 46.0 | 83 | 41 | 3.02 |
| 8 | Herm Wehmeier | 13 | Ind. Games | 0 | 5 | .000 | 12.27 | 13 | 0 | 40.1 | 61 | 17 | 2.98 |
| 9 | Johnny Vander Meer | 13 | Ind. Games | 0 | 9 | .000 | 9.69 | 13 | 0 | 43.2 | 65 | 27 | 2.89 |
| 10 | Allie Reynolds | 13 | Ind. Games | 2 | 5 | .286 | 10.56 | 13 | 0 | 52.0 | 68 | 24 | 2.77 |
| 11 | Ralph Branca | 13 | Ind. Games | 0 | 5 | .000 | 18.13 | 13 | 0 | 23.1 | 43 | 11 | 3.90 |
And, the relievers who most often allowed over 50% more walks than IP.
| Rk | Player | #Matching | W | L | SV | IP | BB | SO | ||||
|---|---|---|---|---|---|---|---|---|---|---|---|---|
| 1 | Hal White | 15 | Ind. Games | 1 | 1 | .500 | 23.52 | 0 | 10.1 | 32 | 5 | 5.13 |
| 2 | Gene Bearden | 15 | Ind. Games | 0 | 4 | .000 | 27.00 | 0 | 8.1 | 27 | 4 | 5.88 |
| 3 | Dick Welteroth | 14 | Ind. Games | 0 | 0 | 25.62 | 0 | 13.0 | 42 | 4 | 5.46 | |
| 4 | Walt Masterson | 14 | Ind. Games | 1 | 4 | .200 | 13.24 | 1 | 17.0 | 38 | 11 | 3.88 |
| 5 | Jess Dobernic | 14 | Ind. Games | 0 | 2 | .000 | 29.35 | 0 | 7.2 | 26 | 4 | 6.39 |
| 6 | Joe Page | 13 | Ind. Games | 0 | 4 | .000 | 18.29 | 3 | 10.1 | 26 | 12 | 4.94 |
| 7 | Al Brazle | 13 | Ind. Games | 0 | 2 | .000 | 27.00 | 0 | 5.1 | 23 | 1 | 7.13 |
| 8 | Junior Walsh | 12 | Ind. Games | 0 | 1 | .000 | 27.00 | 0 | 10.0 | 28 | 5 | 5.60 |
| 9 | Kent Peterson | 12 | Ind. Games | 0 | 2 | .000 | 21.21 | 0 | 4.2 | 17 | 3 | 7.29 |
| 10 | Cuddles Marshall | 12 | Ind. Games | 0 | 1 | .000 | 30.00 | 0 | 9.0 | 35 | 3 | 6.11 |
| 11 | Al Benton | 12 | Ind. Games | 0 | 2 | .000 | 14.59 | 0 | 12.1 | 28 | 6 | 3.41 |