Building a better mousetrap: shutouts and refinements in pitcher usage

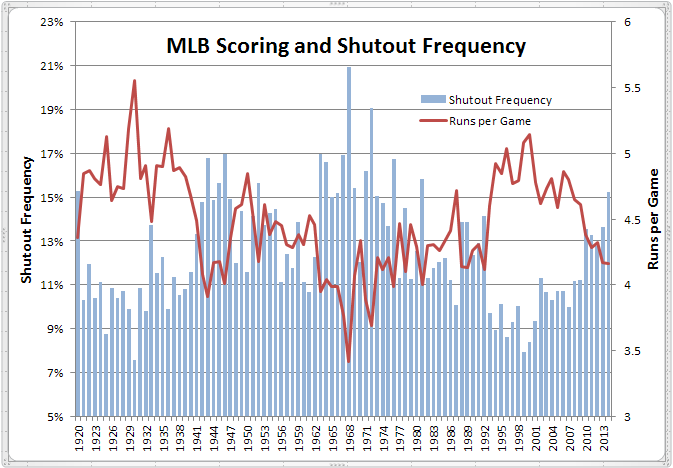
Thus far in 2014, the recent  trend towards lower scoring continues. That trend is now more than 15 years in the making and has resulted in another, that of a higher incidence of shutouts (at least those of the team variety). So far in 2014, more than 15% of games have resulted in a goose egg for the losers, a proportion not seen since 1981, and not seen in a full-length season since 1976.

After the jump, more on declining offense and why it’s been happening.

To illustrate my point about shutouts and run scoring, here’s a chart of the live-ball era showing frequency of shutouts and average runs per team game.

MLB Scoring and Shutouts 1920-2014

While both measures are now in the range experienced from the late 1970s to the early 1990s. how that has resulted in today’s game is markedly different from the past. That fact is illustrated in the chart below.

MLB Team Shutouts 1920-2014

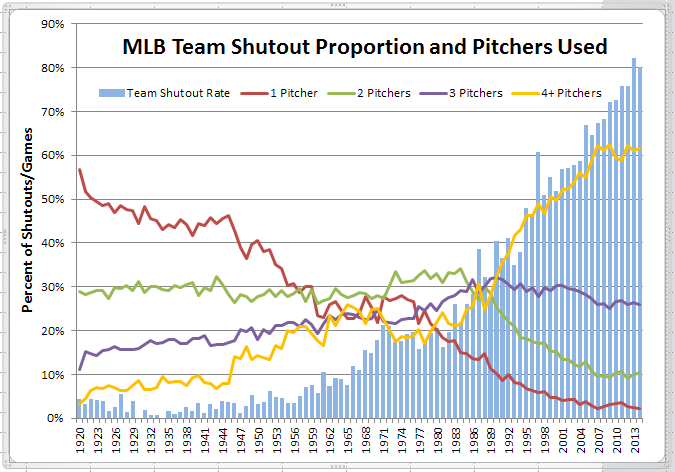
The blue bars represent “team shutouts” (those involving two or more pitchers) as a proportion of all shutouts. Almost negligible at the start of the live ball era, their incidence rose to about 20% by the early 1970s, doubling to 40% by the early 1990s, and doubling again to 80% today. That result is a byproduct of the other trends on the chart, showing the proportion of team games involving one, two, three and more pitchers, with reductions in the former two categories producing a huge increase in the latter category.

But, why has pitcher usage changed so dramatically? An explanation is indicated by the chart below, showing OPS+ against starting pitchers in the first, second and third times through the batting order.

MLB OPS+ Against Starters 1950-2014

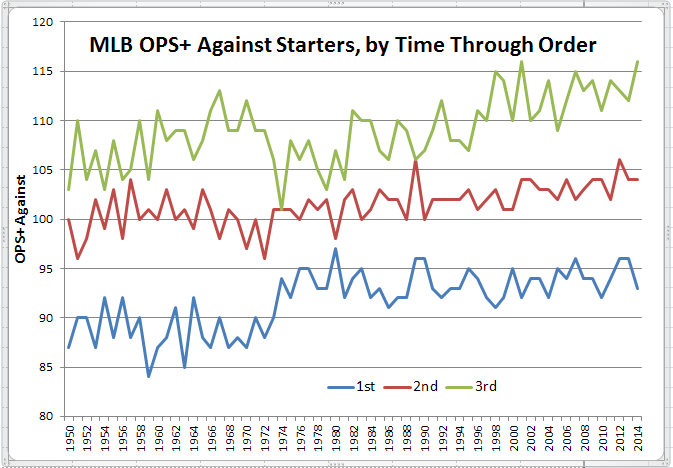
These data are mostly complete for the period shown, since 1950. The effect of the DH is easily discerned, with an increase in OPS+ for the first and second times and a reduction (initially) for the third time, the latter an indication that the immediate response to the DH was for AL teams to go longer (but, only a bit longer) with their starters who, on the whole, did better than the relievers who had formerly been used in that spot. This effect was probably most pronounced in the circumstance of effective starters getting inadequate run support and thus having to be reluctantly removed for pinch-hitters. With the DH in effect, those starters remained in the game and continued to pitch effectively.

Also notable is the improvement in OPS+ over time, for each of the three times through the order. I’ll explain later why that has more to do with relief pitching than starting pitching. For now, the more important trend is that batters become more effective against starting pitchers each time through the order. So, should we expect that trend to continue for the fourth time through the order?

MLB OPS+ Against Starters 4th Time 1950-2014

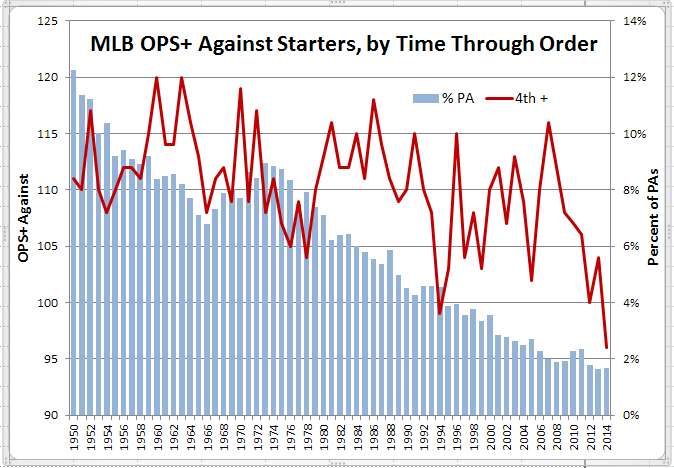
It did indeed through the early 1970s, with OPS+ scores (brown line) of 110 and higher, compared to a 105 to 110 range for the third time. But, those OPS+ scores then start to decline. But, only because of selection bias as indicated by the blue bars showing a corresponding decline in the proportion of PAs against starters in their fourth time through the order. Thus, only starters who were truly on their game were sticking around to have a fourth go at the opposition, while the rest were giving way to relievers. How did those relievers fare?

MLB OPS+ Against Relievers 1950-2014

Prior to the DH rule, not so well with OPS+ scores inferior to those of starters. But since then, those OPS+ against scores have steadily improved, with a corresponding increase in the proportion of innings pitched. This result also explains the improved results (as measured by OPS+) for batters against starters. If relievers are doing better measured by OPS+ against, then starters must therefore be doing worse.

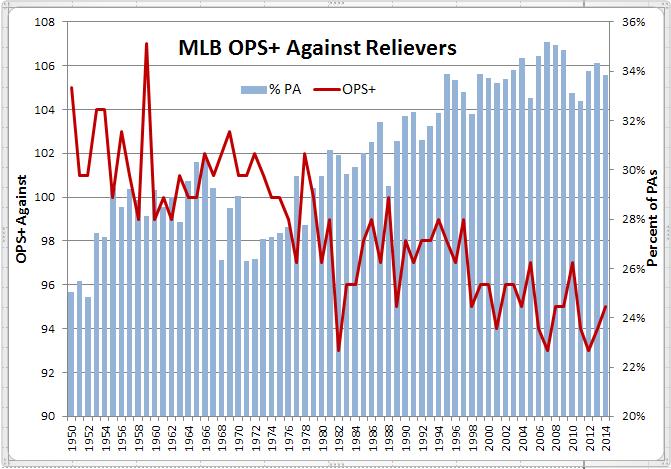
But, note that the proportion of PA by relievers has been basically level for the past 20 years, even as their effectiveness has continued to improve. The cause of that effect is suggested by the chart below, breaking down reliever usage and performance by times through the batting order.

MLB OPS+ Against Relievers 2nd Time 1950-2014

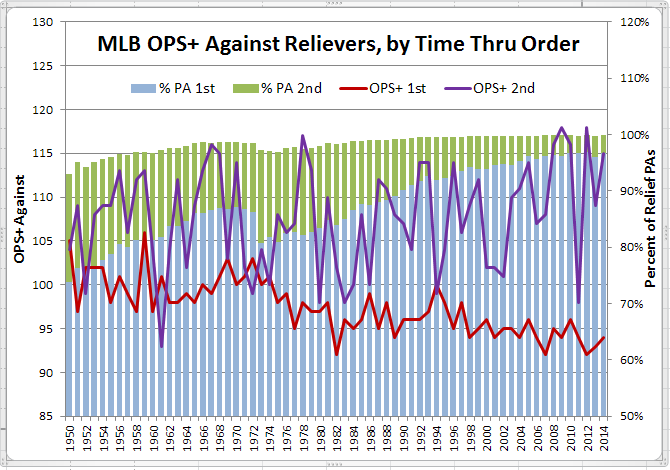
Today it’s only in long relief that relievers stay in a game for a full tour of the batting order, much less more than one. But, it hasn’t always been thus. Even as late as the mid-1980s, 15% or more of relief PAs were against pitchers being seen for a second time. As with starters, relievers’ effectiveness was notably reduced their second time through the order.

But, note the last 15 seasons and the consistent 96 OPS+ or worse by hitters against relievers in their first (and, usually, only) look at them. Much as we might decry specialization of pitching roles and the resulting push-button managing of pitching staffs, bottom line is you can’t argue with success. Of course, it hasn’t all been the pitchers. Batters are doing their share by taking healthy cuts in *all* of their PAs, and thereby keeping an ever-increasing number of balls “out of play”. And, with ever-expanding pitching staffs come ever-shrinking benches, giving the defense the upper hand in late-inning matchups.

So, where are we headed from here? Let’s look again at my first chart.

MLB Scoring and Shutouts 1920-2014

As I noted earlier, runs per game and shutout frequency are both about where they were for a 20-year period from the early 1970s to early 1990s. Then came the offensive explosion of the 1990s and 2000s triggered, in part (perhaps a large part?), by PEDs. Now that PEDs appear to be mostly eliminated, is it just a coincidence that we’re back in the range of the relative offensive/defensive “equilibrium” of the pre-PEDs era? If not, is it reasonable to surmise that, absent PEDs, that equilibrium might have persisted over the past 20 years? Questions to ponder.

0 0 votes
Article Rating
Subscribe
Notify of
guest

18 Comments
Oldest
Newest Most Voted
Inline Feedbacks
View all comments
Richard Chester
Richard Chester
9 years ago

Thought to ponder. Although OPS+ against starters is lowest the first time around, a PI run from 1960-2013 shows that there have been more runs scored in the first inning than in any other.

Richard Chester
Richard Chester
9 years ago
Reply to  Doug

It’s possible that a prevalence of SB in the first inning is a cause of many runs being scored with a low OPS+, since SB do not contribute to OPS+. The PI run covers the years 1960 to 2014, and not all the years at that. The PI run shows 23501 SB, or 18,5% of the total of all SB, occurring in the first inning. That’s 7000+ more SB than in the third inning, which has the second most AB.

Richard Chester
Richard Chester
9 years ago

Just noted a typo. The last entry should be SB, not AB.

John Autin
Editor
9 years ago

Doug, this is an excellent, comprehensive look at these trends. Given overwhelming evidence that short outings are most effective, the questions I’d most like to discuss are: (1) How will usage strategies evolve from here; and (2) Is it time to consider rules limiting pitcher moves in a game? As to (1), I keep expecting some team to try a 4-man rotation, but with even tighter pitch limits. The 5th starter’s a weak link on almost every team, yet virtually everyone religiously sticks to a 5-man rotation, not even using off days to skip #5. Top starters now get just… Read more »

no statistician but
no statistician but
9 years ago
Reply to  John Autin

How about limiting the number of pitchers on a roster as another move?

John Autin
Editor
9 years ago

Re: a roster limit on pitchers — No one is officially a “pitcher” except when they pitch in a game. And “nonpitchers” do pitch once in a while. To implement a roster limit, wouldn’t you have to create official designations?

John Autin
Editor
9 years ago
Reply to  Doug

Doug, I don’t think it would be hard to write my rule to discourage feigned injuries. Say … A pitcher removed mid-inning by an injury exception can’t play in the next two games. And I’m not sure what you mean by “arbitrary.” It targets a particular problem — at least, some think it’s a problem — by means of a restriction that is hardly draconian. But I would be open to modifications. “Two men reaching base” could be added to “a run scoring” as the trigger allowing a mid-inning change. The rulebook is chock full of restrictions that were drawn… Read more »

oneblankspace
oneblankspace
9 years ago
Reply to  Doug

I have heard the suggestion that if a reliever faces only one batter, the second reliever must begin pitching immediately without warmups.

bstar
9 years ago

Doug, this was fantastic. I think you pretty much nailed the TTOP (times thru the order penalty). ________ I am totally on board with the suggestions to curb pitching changes/# of pitchers in the comments above. Baseball is becoming increasingly harder to watch, even for a lot of seasoned fans. It’s a hidden crisis, masked by turnstiles still clicking at an acceptable enough pace for those running baseball to remain struthious about an obviously-looming problem. What happens to attendance ten or twenty years from now when a generation of fathers DON’T take their families to a baseball game because they… Read more »

Arsen
Arsen
9 years ago

This is a great study with very readable charts. Thanks. I agree with the suggestions about limiting pitching changes during innings when a run hasn’t been scored.

The rosters should be increased to 27 players. If you go back rosters weren’t always set at 25. In the early part of the 20th century rosters were much smaller. The game has evolved and a 25-man roster does not allow for enough bench or platoon players. I’d suggest limiting teams to 13 pitchers as well.

John Autin
Editor
9 years ago
Reply to  Arsen

Re: expanding rosters to 27 — Given two extra roster spots, I would bet that most teams would add at least one reliever. Some would add two relievers. Expanded rosters might just make the problem worse.

BryanM
BryanM
9 years ago

As long as we’re fantasizing about rule changes that won’t happen – why not limit teams to one mid- inning change for each nine inning game , with some adjustment for extra frames? If a pitcher was injured after his team had used up the change — he could be replaced by another player who was on the field at the time, say ,the 2B , who could be replaced by effectively a “pinch fielder” , a real pitcher would warm up to start the next inning, and the fielder could return to his position. – this would happen about… Read more »

Doug
Doug
9 years ago

Re: JA @10

Maybe arbitrary is the wrong word. I just meant that having to wait for the opposition to score (something a team can’t control) before making a move seemed a little strange. At least a rule like two mound visits is something a team can control. Maybe a minimum two or three BF instead of one would help. Would make managers think twice about whether thay really need to make that change.

birtelcom
Editor
9 years ago

How about a simple rule prohibiting the use of any pitcher two games in a row (except during extra-innings or during the game after an extra-inning game)? Would that likely move pitcher usage patterns back a few decades? Could create lots of fun head-scratching strategy decisions for managers.

trackback

[…] factor. But it’s also quite clear that today’s pitchers, facing those hitters, are more effective in shorter stints — and teams are exploiting that fact more than ever. This year, relief outings of one inning […]