RBI Masters: Manny being Manny or Answering the Belle

A common and legitimate criticism of using RBI as a measure of a hitter’s effectiveness is that RBI are opportunity-based and, therefore, good RBI totals may simply be an indicator of more RBI opportunities. To address this limitation in raw RBI totals, this post looks at players who are most proficient in driving in runs when they are presented with that opportunity (namely, when runners are in scoring position).

Using this approach, Albert PujolsAlbert Belle and Manny Ramirez emerge as the most proficient expansion era run producers with RISP, with Frank Thomas just a hair behind.

My thanks to regular HHS contributor Richard Chester for suggesting the idea for this post. More after the jump.

This study looks at player performance in RISP situations since 1961, a period for which PBP data are nearly 100% complete. Evaluated are the 1026 players (incl. active players) with 3000 PA (through Aug 27th) in the period. Their PAs with RISP range from a low of 18.7% (Horace Clark) to a high of 32.6% (Bob Watson).

Using PBP data for these RISP PAs yields the following average RBI rates per AB. Note that only RBI produced in RISP PAs are counted, not all RBI. I’ve presented RBI per AB instead of RBI per PA because players who walk (or are walked) frequently in these situations would be disadvantaged by a per PA metric, and probably unfairly so.

RBI per AB Since 1961

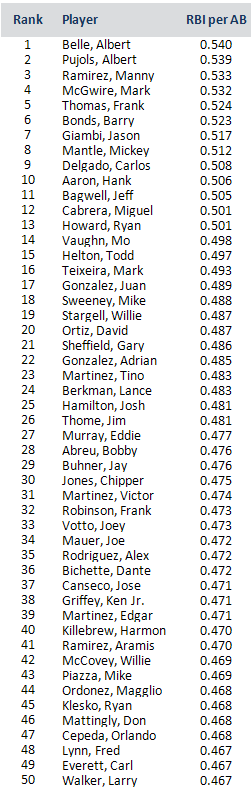
That’s a .073 run difference per AB between the top and bottom of this list. But that difference will add up, to over 7 runs per year, based on a conservative estimate of 100 RISP ABs in an average season. Also bear in mind that this is just the top 5% of players, so the difference between the leaders and the average player will be greater still.

Notable that most of these players are of recent vintage, an indication that, looking only at RISP situations goes only part of the way in normalizing data. What’s missing are normalization for park effects, run scoring environment, batting order position, and the like. Some notes:

  • Mickey Mantle does very well to make the top 10 based only on data for the back end of his career.
  • Note Dante Bichette, one of sabermetric’s favorite whipping boys, finishing ahead of teammate and sabermetric darling Larry Walker (but only by a bit).
  • Is Mike Sweeney baseball’s best pinch-hitter of the past half century? Well he would be if he was Mark Sweeney and those were his numbers (thanks to RJ for spotting my goof). This Sweeney is the Royal catcher turned first baseman who went .324/.396/.535 with 432 RBI for 1999-2002. Hands up if you knew Mike had a 144 RBI season.

The second set of metrics are for the quantity RBI-HR, or RDI (Runners Driven In), chosen to try to level the playing field between power hitters and others. Again, results are presented per AB.

RDI per AB Since 1961

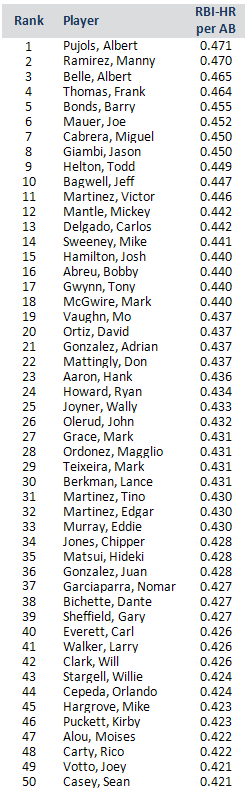
Still .05 of a run difference per AB between top and bottom of this list, so about 5 runs per year based on 100 RISP ABs, and more when compared to the average player.

Note that this approach only partly achieves the objective of normalizing between home run hitters and others. The power guys still benefit by driving in runners from all bases (not just those in scoring position) and doing so regardless of the baserunning abilities of those runners. That is a good segue into the obvious caveat that not all RISP opportunities are created equally, even for comparable hitters. Thus, I’d put my money on Freddie Patek driving in Willie Wilson from second over, say, Mark Belanger doing the same with Brooks Robinson on base.

Some thoughts on this list:

Combining the two results, each player is assigned a ranking for RBI and RBI-HR, with the harmonized mean of those rankings presented as a Total Rank, and Average Rank being just that, the average of the two rankings. The harmonized mean, calculated as twice the product of the ranks divided by their sum, has the effect of basing the Total Rank more on the metric in which a player did better, whereas the Average Rank weights each metric equally. Shown below are the top 50 by Total Rank.

RBI Rankings Since 1961

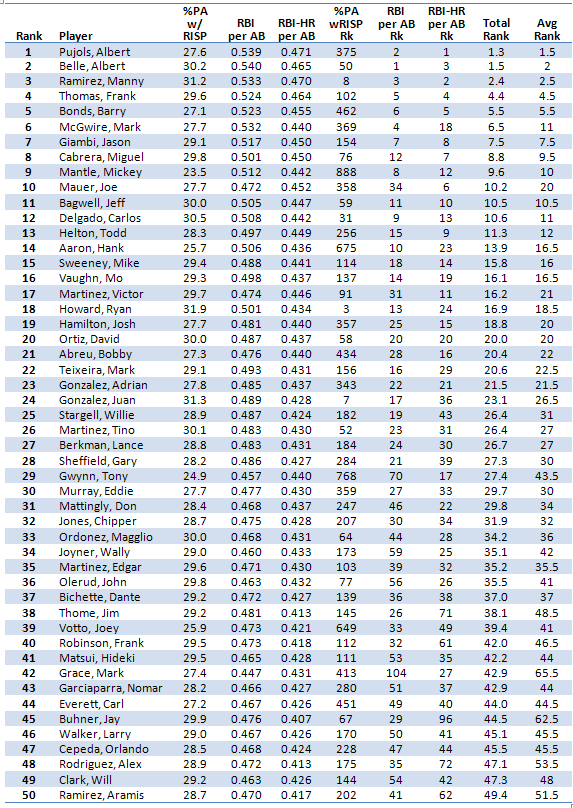
Some thoughts on the rankings.

  • People discount Ryan Howard‘s RBI totals because he gets a lot of RBI opportunities. Well, they’re right about the latter point as Howard ranks 3rd in % of PA w/RISP. But, Howard makes the top 25 in both of our metrics, so he is doing something right.
  • Big differences in rankings for the two metrics for some of these players, particularly Mark Grace (focus on making contact) and Jay Buhner (focus on going yard).
  • Others have very similar rankings, particularly the top of the list plus David Ortiz, Adrian Gonzalez, Eddie Murray, Dante BichetteChipper Jones and Orlando Cepeda.
  • Would anybody have guessed Mickey Mantle would make the bottom 15% of players in % of PA with RISP? Yes, the Yankees were awful his last 3 years, but they were AL champs for half of the seasons represented here.

Didn’t see your favorite player? Not to worry. Data for all 1026 players in the study are available here.

As a follow-up to this post, I’ll compare these results with RE24 performance in the same RISP situations.

0 0 votes
Article Rating
Subscribe
Notify of
guest

34 Comments
Oldest
Newest Most Voted
Inline Feedbacks
View all comments
Dr. Doom
Dr. Doom
9 years ago

You know, I hate to be “that guy,” but you’ll notice that the list is completely dominated by players from the Selig years. I would bet that a higher percentage of RISP scored during those years overall. I would guess that one would have to context-adjust those numbers by scoring environment in order to really get an accurate picture of who the best at driving in runners are.

brp
brp
9 years ago

I disagree with your contention here: “I’ve presented RBI per AB instead of RBI per PA because players who walk (or are walked) frequently in these situations would be disadvantaged by a per PA metric, and probably unfairly so.” Excluding INTENTIONAL walks I understand, but not all walks. If the point of this exercise is to identify proficiency at driving in runs, then the hitters who “choose” to take a walk instead of driving in a runners are fairly disadvantaged, to some degree. Yes, pitching around hitters is a real thing, I get it, but it’d be interesting to see… Read more »

brp
brp
9 years ago
Reply to  Doug

Thanks!

I think people gloss over how good Albert Belle was because he was apparently a horrible human being. But the man could flat-out play baseball.

oneblankspace
oneblankspace
9 years ago
Reply to  brp

When Cal Ripken took the night off for the first time in forever, Belle had the longest active consecutive-games played streak in MLB (I think it was in the 160s).

brp
brp
9 years ago
Reply to  Doug

Using that data, provided HARMEAN is the right Excel formula, here’s what I get for the top 20 for the PA Total (calculated same as RBI total):

Pujols, Albert 1.0
Belle, Albert 2.4
Cabrera, Miguel 2.4
Ramirez, Manny 4.8
Bichette, Dante 5.3
Aaron, Hank 7.4
Gonzalez, Juan 8.2
Gwynn, Tony 8.8
Vaughn, Mo 9.5
Hamilton, Josh 9.9
Clemente, Roberto 10.7
Gonzalez, Adrian 12.0
Mattingly, Don 13.2
Howard, Ryan 13.4
Delgado, Carlos 14.7
Martinez, Victor 14.7
Sweeney, Mike 14.9
Puckett, Kirby 15.5
Stargell, Willie 16.5
Ortiz, David 17.5

Fun stuff.

mosc
mosc
9 years ago

but but but…

“As a follow-up to this post, I’ll compare these results with RE24 performance in the same RISP situations.”

YAY!!! haha, you read my damn mind.

Richard Chester
Richard Chester
9 years ago
Reply to  mosc

RE24 performance makes more sense, it takes into account the actual number of runners on base, which PA with RISP does not do.

Paul E
Paul E
9 years ago

Doug:
Could we divide the pertinent ratios further by AIR on the Baseball-Reference website:-(

brp:
Albert Bell was a great human being. It was just the steroids that made him such an angry horse’s ass.

I’m ready to pretend 1994-2008 didn’t happen

mosc
mosc
9 years ago
Reply to  Paul E

Braun in 2011 and 2012 didn’t happen either I would guess. Or greenies. Or Cocaine. Or segregation. I mean, we still going to do this?

RJ
RJ
9 years ago

“Is Mike Sweeney baseball’s best pinch-hitter of the past half century? If RBIs are what it’s about, then YES.”

Are you getting your Sweeneys muddled Doug? Mike Sweeney only had 8 pinch hit RBI. MARK Sweeney was the noted pinch hitter, with 102 pinch-hit RBI.

Good stuff though. Thanks for making the full data available. If I’m reading it right, Frank Taveras ranks last by these measures. I can believe that: despite seven seasons of over 125 games played, Taveras never bested 38 RBI.

PaulE
PaulE
9 years ago

Mosc: I hate to do this, but greenies and cocaine aren’t exactly performance enhancing unless one is “night-clubbing”. And as for segregation, all the Negro Leaguers in the US integrated into MLB couldn’t change the fact that Jimmie Foxx was about the same size as Ryne Sandberg and probably half the athlete. We keep on trying to compare eras and it just can’t be done. George McAfee and Doak Walker couldn’t play in the NFL today….just have a hard time with “eras” and the steroid era and the cartoon batting stats produced just stink and distort history and the differences… Read more »

aweb
aweb
9 years ago

Looks like there might be an effect of all those lefty relievers late in games – RH hitters top the list.

Cyril Morong
Cyril Morong
9 years ago

Do you know the correlation between RBI per AB and some other stat like SLG?

I have found that even if you take opportunities into account, ISO and AVG are still significantly related to RBIs.

http://cyrilmorong.com/WEB.htm

I have also found that “If we assume hitter’s hit the same way with runners on base as they do all the time, they generally get about the number of RBIs we would expect based on how many base runners they are on when they bat and what bases they are on.”

http://cyrilmorong.com/RBIEXP.htm

Cyril Morong
Cyril Morong
9 years ago
Reply to  Doug

Thanks. But there will always be players who hit better in the clutch than others. But is it a clutch ability or just luck that they performed better? Usually we get just about the number of players performing very well in clutch situations that would occur by chance. See

Clutch Hitting One More Time By Pete Palmer

http://www.philbirnbaum.com/btn1990-03.pdf

bstar
9 years ago
Reply to  Cyril Morong

This is why I remain a bit skeptical about clutch hitting. It’s not clear to me that if we measured how all hitters hit on Tuesdays, we wouldn’t find a very similar distribution, complete with outliers on either side. And no one would argue that hitting on Tuesdays is actually a skill. And, Cyril, don’t let your hitters grow up to be RHH sluggers, either. 😉 Very interesting read here: http://cybermetric.blogspot.com/2010/07/dont-let-your-little-leaguers-grow-up.html It appears we should expect high-BA, low-walk, low-power guys to hit better in the clutch than a RHH slugger-type with a lot of K’s, simply because making contact is… Read more »

bstar
9 years ago
Reply to  bstar

And we should expect the exact opposite for high-BA, low power guys who never strike out. Nellie Fox, Gwynn, Grace, Pete Rose, Bill Buckner, etc. It’s hard to not notice that a lot of the highest marks for Clutch (measured by B-Ref’s WPA-dependent Clutch measurement) are from hitters who fit this profile, and the laggards on these leaderboards are often RHH slugger types. The bottom twenty for Clutch, with at least 6000 total PAs, includes the likes of Jim Rice, Big Hurt, Andruw Jones, Jeff Kent, ARod, Konerko, Lance Parrish, Mike Schmidt, Beltre, Frank Robinson, and Sosa. All these guys… Read more »

Cyril Morong
Cyril Morong
9 years ago
Reply to  bstar

Thanks for mentioning my work

bstar
9 years ago
Reply to  bstar

Honestly, I wrote something similar yesterday but deleted it. Ironic that you would post here today. Of course, I’m also blaming you for my inability to now get the Willie Nelson version of that song out of my head.

oneblankspace
oneblankspace
9 years ago
Reply to  bstar

I’ve heard that the only way to get a song out of your head is to get a new one stuck in there.

Cyril Morong
Cyril Morong
9 years ago
Reply to  Doug

“More than anything else, that speaks to the effect that late inning relief specialists have had on today’s game.” (a quote from the link you gave)

That is probably the case. I have 2 studies that support that idea

http://cybermetric.blogspot.com/2010/07/was-it-easier-to-be-good-clutch-hitter.html

http://cybermetric.blogspot.com/2009/10/did-increased-use-of-relief-pitching.html

http://cybermetric.blogspot.com/2009/09/clutch-hitting-over-time-1952-2008.html

Richard Chester
Richard Chester
9 years ago
Reply to  Doug

It is possible to do it using the PI Event Finder but it would take quite a long time.

Richard Chester
Richard Chester
9 years ago

Actually it’s easy to do one player at a time. I did Ken Griffey Jr.’s career RE24 with RISP. If I did it correctly I calculated 14.69 but I’m watching the Yankee game at the same time so I can’t say it’s accurate. Maybe later today I’ll try a couple more players.
Doug: You seem to have a knack for posting blogs just prior to the start of Yankee games. 🙂

Richard Chester
Richard Chester
9 years ago

I checked Pujols and got a career RE24 of 293.14 with 2520 PA. I rechecked Griffey and saw that I added the wrong column. Adding the right column shows 188.55 RE24 with 3121 PA.

Richard Chester
Richard Chester
9 years ago

I checked Pujols for RE24 with no RISP and got 399.53. Combining that with his RE24 with RISP totals 692.67. Then I ran Pujols again for all PA and got the same 692.67. But his stats on BR show 720.6. I don’t know what causes the discrepancy.

bstar
9 years ago

Richard: the discrepancy should be from RE24 for baserunning.