
Defensive metrics, while still controversial, have come a long way from the raw fielding percentages and error counts that once were all that was commonly available. In Part 1, this post presents a view of team defensive statistics from 2014, using two of the advanced defensive metrics in use today. Part 2 will focus on individual players, identifying the best and worst fielders at each position.
More after the jump.
This post looks at defense from the perspective of two advanced defensive metrics: Defensive Runs Saved (DRS); and Ultimate Zone Rating (UZR). DRS is the metric now used in Baseball-Reference.com’s defensive WAR (dWAR) statistic. Both DRS and UZR (and other defensive statistics) are available for teams and players at FanGraphs.com.
DRS and UZR are both calculated from data collected by Baseball Info Solutions (BIS) on every play in every major league game. Those plays that result in balls in play are evaluated based on how often similar balls in play are fielded and turned into outs. Similarity is mainly to do with how hard and where a ball is hit, as recorded in BIS by human scorers. If a fielder makes a play, he is credited with the difference between 1 and the percentage of times that play is usually made. If a fielder doesn’t make the play, he is docked that percentage. Thus, making a play that is seldom made earns a high score but not making that play yields only a small deduction. Conversely, making a routine play garners only a tiny positive score but muffing that play earns a hefty deduction.
All of the pluses and minuses are added up and eventually turned into Runs saved or lost. That is done a bit differently for the two metrics, but the final result is usually fairly similar. There are also a host of small adjustments for various factors (e.g. park effects, base/out context, defensive shifts, etc.) that are made by both metrics. Those interested in the details are invited to consult the links below.
With those preliminaries out of the way, here are how DRS and UZR saw each team in 2014. The teams are ordered top to bottom by best to worst UZR score.
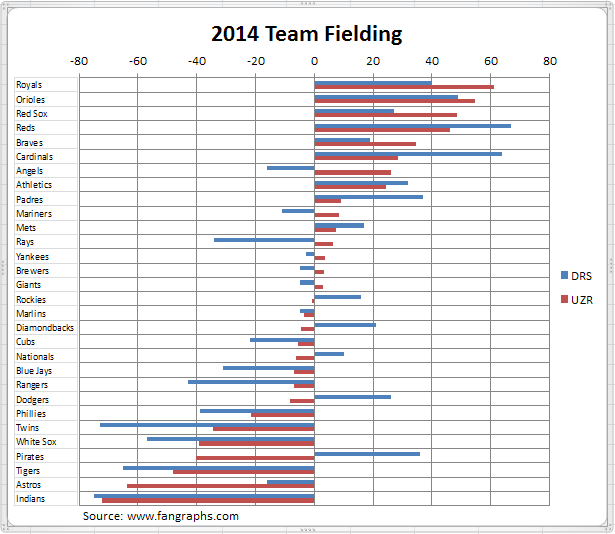
One note for the chart above is that UZR does not calculate results for fielding of pitchers and catchers, while DRS does. Thus, the DRS total is a more complete picture of team defense which explains, in part, why the DRS totals, whether positive or negative, tend to be of larger magnitude than the UZR scores.
That said, there are still reasonably similar results between DRS and UZR for many teams, particularly the Orioles, Athletics and Indians, plus the Yankees, Brewers and Giants in the middle of the pack. The Pirates have the widest divergence, with a spread of 75 runs between the two ratings. Other differences are with the Dodgers, Cardinals and Astros being more favored by DRS, and the Rays, Red Sox, Angels and Twins by UZR.
Breaking down these scores yields this result, first for UZR.
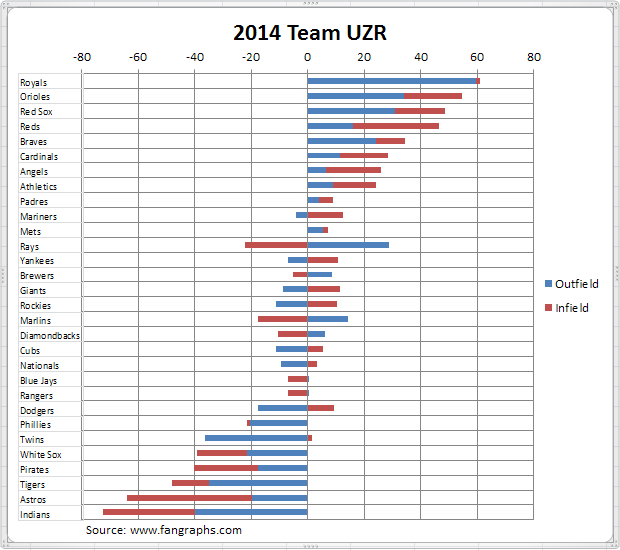
Good balance for the Orioles, Reds and Red Sox with sound defense all over the ballyard. Also a good balance, but a less desirable one, for the White Sox, Pirates and Indians. But, as might be expected, just about every other team is markedly better in either the outfield or the infield.
Looking at the same results for DRS yields this picture.
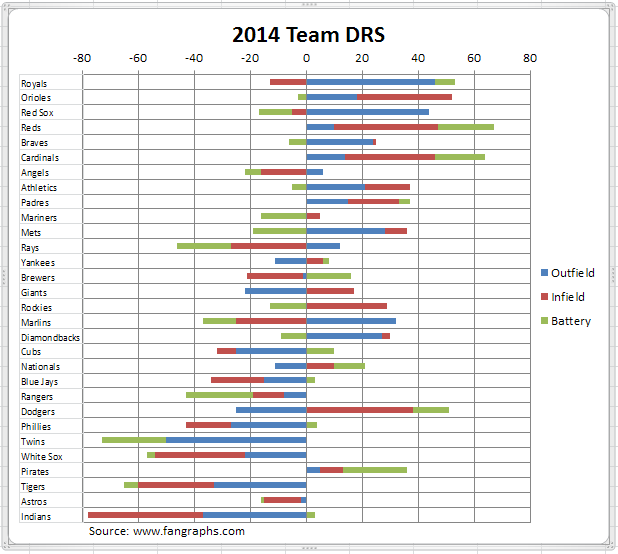
DRS does include scores for pitcher and catcher, so they are represented here as they appear on Fangraphs. With DRS, it’s the Athletics and Padres with similar defensive skill between infield and outfield, with the Blue Jays, White Sox, Tigers and Indians having similar defensive liabilities. The rest, as with UZR, are more adept defensively in either the infield or outfield, with a few teams (Mariners, Rangers, Pirates) showing battery defense as the biggest component of overall team defense.
Drilling down to individual positions, team rankings are represented and color-coded from best (1=green) to worst (30=red). These are the UZR results.
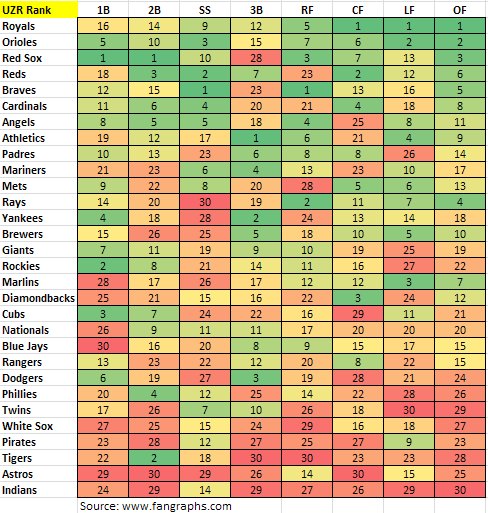
Outstanding defense (as we all witnessed in the World Series) in the Royals outfield but middling on the infield. The Reds are the opposite, though having a top defender in centerfield certainly helps mitigate their weaker flanking outfielders. The Orioles look solid everywhere, but the Red Sox only on the right side of the infield and outfield. The Florida teams are both decent in the outfield but dreadful in the diamond.
Here are the same rankings for DRS.
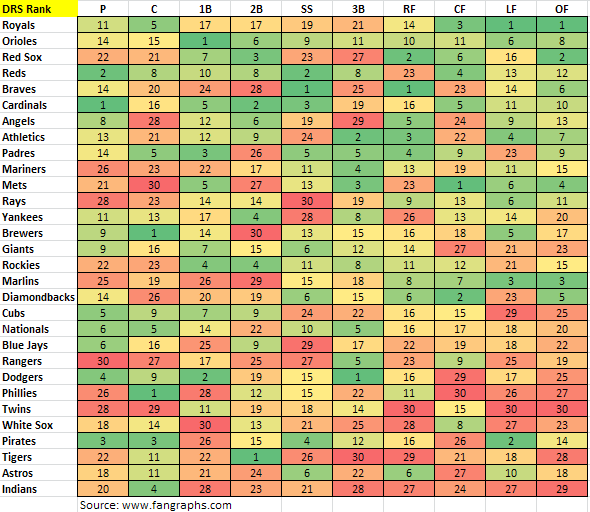
Some differences from UZR, particularly at the bottom of the chart, where the colors are not quite so uniformly orange and red. The Braves, Tigers, Red Sox and Yankees all paired one outstanding and one mediocre fielder at the middle infield positions. But only the Braves had that outstanding fielder at shortstop, where those skills will help to offset the weakness at second base, more so, I think, than the other way round. The Blue Jays’ new acquisitions should help their defense, upgrading from middle-of-the-pack to top 3 at both 3B and catcher.
For those with penchant for the details, here are all the numbers. You can scroll through the table or search for a team or statistic by typing in the search box. To sort the data, select a statistic (UZR or DRS) in the Search box, and then click on one of the positions to sort the teams.
[table id=241 /]
.
For further analysis, these data can be accessed here. Feel free to download your own copy.
Now it’s your turn. What surprised you, or left you scratching your head?