COG Round 103-105 Results: Collins on Big Train to Georgia

I’ve fallen behind on the posts for our COG election winners, so here’s a recap post on the most recent inductees: Eddie Collins, Walter Johnson and Ty Cobb. All were deservedly no-doubters as COG honorees, so much so that Grover Cleveland Alexander, another most worthy candidate, is still waiting his turn. More on this illustrious trio after the jump.

The accomplishments of these three honorees are immense, each surpassing 120 WAR and 75 WAA, with Johnson and Cobb topping the 150 WAR mark, and Cobb also besting 100 WAA (Johnson just missed with 97.3 WAA). Each has had an excellent biography written as part of SABR‘s Biography project, which I commend to your reading.

Rather than document these players’ superlatives, I thought I’d try something a bit different. As all three were contemporaries and all played their entire careers in the AL, I thought I’d look at their performances against each other using Baseball-Reference‘s box scores. B-R has these for games back to 1914, so they comprise the larger portion of each player’s career, albeit not necessarily all of their prime seasons.

Johnson pitched 95 complete games against Cobb’s and Collins’ teams from 1914 to 1927, compiling a 59-36 record with a 2.07 ERA, dominating totals that would be expected of Johnson, even late in his career. Of those 95 games, Cobb and Collins each appeared in 39, with neither player appearing in the remaining 17 contests (there were no games with both players appearing, when they were teammates in 1927). Here’s how Johnson fared against Collins and Cobb in those games.

Johnson vs Cobb Collins 1914-27

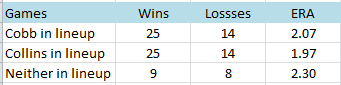
Pretty consistent results for Johnson in these games. It might be tempting to suppose that Johnson’s lesser performance in games without Cobb and Collins was because he lost a bit of edge, relieved that they were not in the lineup. It is likely, though, that that is not the case as 7 of the 17 games were in Johnson’s final two seasons when even Big Train was not quite the pitcher he had been earlier in his career.

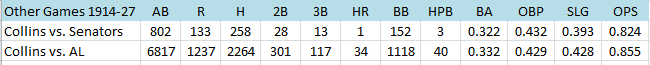
Separating Collins from the rest of his team when he opposed Johnson in those 39 complete games yields this result.

Collins vs Johnson

As might be expected, Collins easily outshines the rest of his team, though with decidedly un-Collinesque numbers, as indicated below.

Collins vs Senators

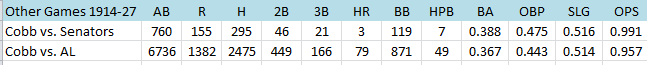
But, a bit different story for Cobb.

Cobb vs. Johnson

As with Collins, Cobb enjoyed far better results against Johnson than his teammates. But, his results against Big Train were hardly different from his performance against every other pitcher.

Cobb vs. Senators
In Cobb, Johnson had evidently met his match (though, he did have the last laugh with that 25-14 record). Johnson could at least take a tiny bit of solace in that he at least fared a bit better against Cobb than his teammates.

0 0 votes
Article Rating
Subscribe
Notify of
guest

13 Comments
Oldest
Newest Most Voted
Inline Feedbacks
View all comments
Hartvig
Hartvig
8 years ago

It would appear that your examples- especially Cobb- give at least some credence to the old adage that baseball is 75 or 90% pitching. Or maybe it means that to be a good pitcher you only have to be effective vs. 75 to 90% of the batters. Or maybe I’m just babbling. That leaves us with a handful of on-everybodys-list, hands-down, no-doubt-about-it, everyone-agrees certified immortals left to enshrine: Alexander, Mathewson, Wagner, Lajoie and Young. And Old Pete will drop off that list on this ballot. But these elections are actually kind of boring. We know the outcome before the first… Read more »

Brent
Brent
8 years ago

Cobb’s secret against Johnson was, not surprisingly, one of intimidation. Here is a quote I found from Tyrus Raymond about facing Johnson: I had to figure Johnson out. I realized quickly that he wasn’t a vicious pitcher, despite all that speed. I saw him wince when he fired one close to somebody’s head, and he used to tell me that he was afraid someday that he would kill a man with that fireball. So I used to cheat. I’d crowd that plate so far that I was actually sticking my toes on it when I was facing Johnson. I knew… Read more »

Hartvig
Hartvig
8 years ago
Reply to  Brent

I was looking thru the list of most batters hit in a season on Baseball-Reference leader board and the numbers are staggering. There are no seasons after 1907 in the top 80 or so and at least 90% of the top 250 happened prior to that date. Even down in the top 500 range they make up more than half of the list. Both the single-season and career HBP leader board have a fair number of players from that era but it’s nothing like the pitching- more on the lines of one-quarter or at most one-third. Dunno what that signifies… Read more »

Artie Z.
Artie Z.
8 years ago
Reply to  Hartvig

Hartvig – I think part of it can be explained by innings pitched. When Phil Knell hit 54 batters in 1891 he pitched 462 innings. Will White is 9th on the all-time single season HBP list with 35. But he pitched 456 innings in 1884. Kerry Wood hit 21 in 211 innings in 2003. The most recent season with more HBP than Wood’s is, I think, Howard Ehmke’s 1922 season when he had 23 HBP in 279.2 IP. So on a rate basis Wood has more HBP per inning than many of those earlier seasons. Not doing a thorough study… Read more »

Hartvig
Hartvig
8 years ago
Reply to  Artie Z.

Ach- how could I not realize that.

I would imagine the shorter distance from the mound to the plate for pre-1893 pitchers would probably be a factor as well.

Does make it kind of impressive however that Bob Feller only hit 3 batters in 370+ IP’s one season however.

brent
brent
8 years ago
Reply to  Hartvig

About Feller, I know I have read somewhere that he had the same aversion to hitting opposing players as Walter Johnson apparently had. He didn’t like it, didn’t want to do it. Considering the year that you referenced he walked something like a bazillion batters, he pretty obviously made sure he was missing away or up or down, but never inside.

Kahuna Tuna
Kahuna Tuna
8 years ago

In support of your main point, Artie, here are the eight qualifying pitcher’s seasons (IP more than team games played) since 1930 in which HBP exceeds one tenth of IP:

Jeff Weaver, 1999 (17 HBP in 163.2 IP)
Jamey Wright, 2000 (18 HBP in 164.2 IP)
Jamey Wright, 2001 (20 HBP in 194.2 IP)
Tim Wakefield, 2001 (18 HBP in 168.2 IP)
Victor Zambrano, 2003 (20 HBP in 188.1 IP)
Bronson Arroyo, 2004 (20 HBP in 178.2 IP)
Casey Fossum, 2005 (18 HBP in 162.2 IP)
A.J. Burnett, 2010 (19 HBP in 186.2 IP)

Richard Chester
Richard Chester
8 years ago
Reply to  Kahuna Tuna

It is interesting to follow the roller coaster variations in HBP rates over the years. In 1887 the HBP/G rate was 0.35. From then through 1900 the rate steadily increased to a high of 0.49 in 1900. An increase of the pitching distance to 60’6” in 1893 had little effect. In 1900, well before the introduction of keeping a fresh ball in play in 1920, began a long steady downward trend culminating at 0.12 in 1947. 1948 marked the start of an upward trend, rising to 0.24 in 1968. Then came along another steady downward trend bottoming out at 0.16… Read more »

Brendan Bingham
Brendan Bingham
8 years ago

Good stuff, Richard; thanks for posting. Do you have HBP rates broken down by pitch count? I would expect higher rates early in the count (if the pitcher is intent on popping the batter, why wait?) and lower rates when the count includes three balls (walk has the same payoff to the batter, minus the bruise).

Richard Chester
Richard Chester
8 years ago

Pitch count data is available on the PI Batting by Team Event Finder and is complete to around 1997. I did an analysis for 2014. The first column in the table below is the pitch count number for the HBP and the second column is the number of players. There were a total of 1352 players HBP.

1…….301
2…….357
3…….338
4…….311
5…….183
6…….101
7……..44
8……..12
9………4
11……..1

mosc
mosc
8 years ago

This data needs to be normalized by the number of at bats for given counts.