
But, not the numbers (with lots of zeros after them) that you’re probably thinking about. Baseball’s annual rite of fall and winter has just about run its course. As of this writing, Baseball-Reference is recording 414 free agent signings since the end of last season, with only 8 more players still on the market.
How did your team do in the free agent sweepstakes? Find out after the jump.
This is a visual analysis by team of the free agents that each team re-signed, did not re-sign, or signed from another organization. Let’s start with the raw numbers. How did those 414 signings break down?
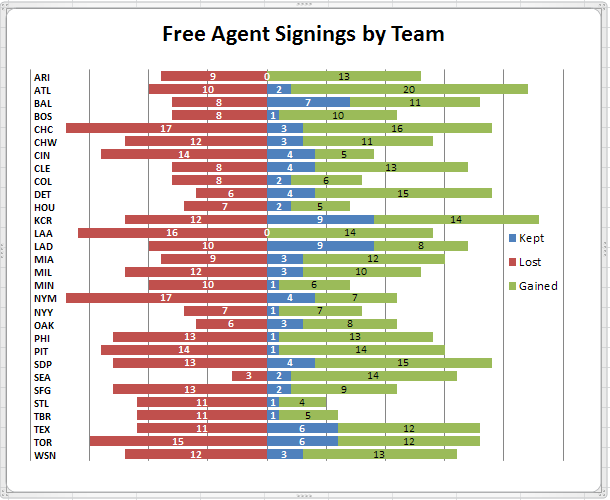
Many of those 414 players have had brief major league careers or none at all. And, for many of those fringe players, being signed as a free agent likely won’t change that status significantly. Still, most teams replenished their lost free agents with new signings in approximately equal quantities. Those who acquired significantly more new free agents than they lost include the Braves, Tigers and Mariners. Those who lost significantly more free agents than new signings include the Reds, Mets, Cardinals and Rays. Most teams were not too particular about retaining their own free agents (or, at least, they weren’t too successful doing so) but a few (the Dodgers, Royals and Orioles, in particular), did re-sign a goodly number of their own free agents.
As mentioned, not all free agent signings are of equal importance. The next chart shows the same breakdown, but based on WAR for the past 3 seasons instead of numbers of free agents.
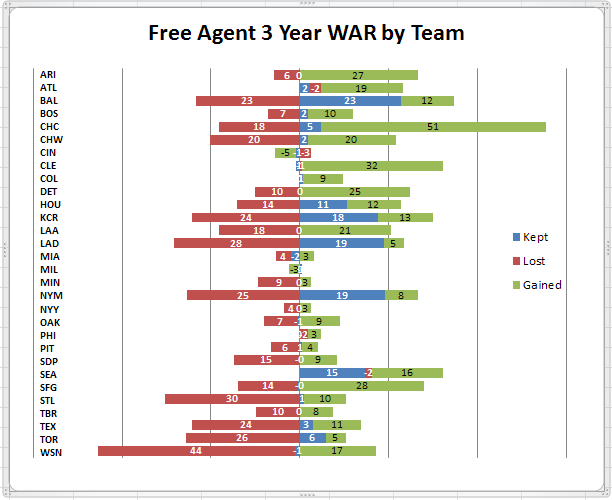
The chart above shows WAR lost on the left side of vertical axis, and WAR gained on the right. Teams who kept or acquired players with combined negative 3 year WAR are shown as a negative on the left of the axis. Similarly, teams who lost players with combined negative 3 year WAR are shown as a positive on the right side of the axis.
Possibly the biggest free agent signing was the Red Sox inking David Price, with 13.4 WAR since 2013. But the rest of Boston’s signings were of dubious value with a combined total of less than -3 WAR since 2013. The three teams (Dodgers, Royals and Orioles) who retained the largest number of their own free agents did so with good reason, preserving on average about 20 WAR produced over the past three seasons. The Mets and Mariners also kept a nice chunk of WAR by keeping their own UFAs. Teams that lost sizable WAR potential by failing to re-sign their own UFAs include the Nationals, Cardinals, Dodgers, Blue Jays, Mets, Rangers and Orioles. The big winners in new free agent signings were the Cubs, Indians, Giants, D-Backs and Tigers, each acquiring players who totaled at least 25 WAR since 2013. Four teams at the bottom of the chart (the Cardinals, Rangers, Blue Jays and Nationals) were the biggest losers, showing the largest deficits of 3 year WAR between free agents lost and those re-signed or acquired.
Free agents tend to be older players, so looking at WAR production from prior years may not be a reliable indicator of future value. Here’s how team fared in terms of getting older or younger as a result of their free agent dealings.
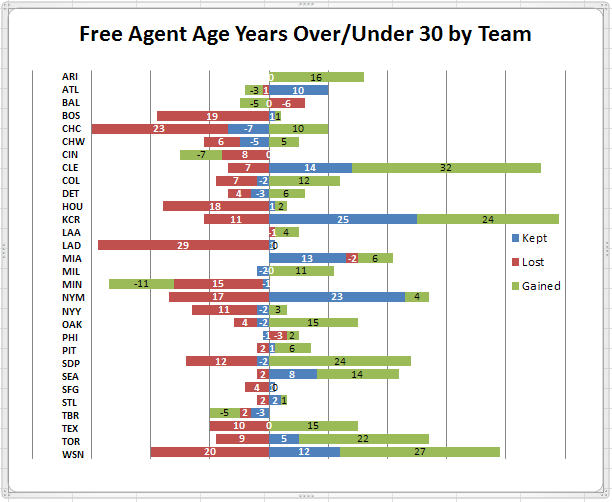
For this chart, each free agent signing is shown based on the players’ ages, represented by the number of years above or below 30. The numbers shown above are the total sum of those positive (over 30) or negative (under 30) age differences. Losing older players or keeping or signing younger ones are shown on the left side of the axis. Keeping or signing older players, or losing younger ones are shown on the right side of the axis.
The Royals and Indians seem to most resemble a “win now” mindset, showing heavy skewing to the right side of the axis. The Twins are more in the “build for the future” mode with skewing to the left side of the axis accomplished both by not keeping older free agents and acquiring younger ones.The Dodgers, Astros and Red Sox have also parted company with older free agents and, on the whole, acquired considerably younger replacements. So too have the Cubs who acquired three year WAR totaling 51 despite adding only 10 net years above 30 for those new additions. The Mets and Nationals also lost a sizable number of older free agents, but re-signed or acquired replacements even older.
The last chart is similar to the one above, showing the years of major league experience by free agents lost, kept or acquired.
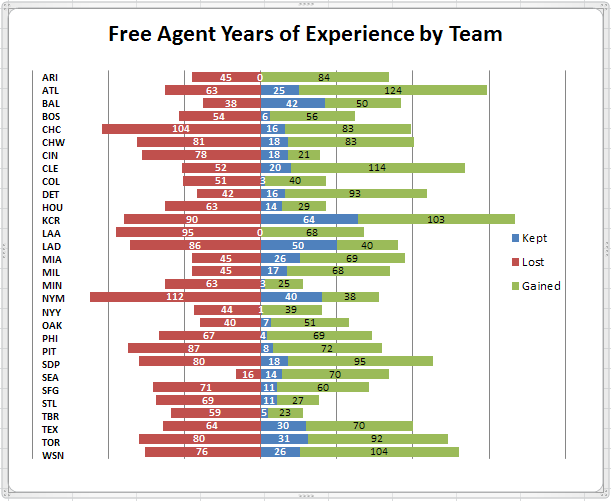
Consistent with the surmise from the Age chart, the Royals and Indians both acquired significant experience through signing of older players (the Indians also got a decent amount of 3 year WAR from those acquisitions). The Braves also added many years of experience but, like the Royals, didn’t get a huge amount of 3 year WAR to go with it. The Mets and Cubs lost the most experience, but re-signed or acquired a goodly amount of experience to replace those losses. The Twins, Rays, Rockies, Astros and Yankees acquired relatively little free agent experience (a novel approach for the Pinstripers), but didn’t lose a lot either. The Mariners lost the fewest number of free agents and, consequently, also the least amount of free agent experience.