I’m working on a USA Today Sports Weekly piece, and there sure is a lot of interesting stuff that happens in April.
We know that relievers have tossed an increasingly large fraction of innings over the years. In the 1970s, relievers tossed about 20% of all innings. In recent years, the percentage has been closer to 24%. That may not seem like a lot, but with a little over 43,000 innings last year, that extra 4% represents more than 5000 outs being recorded by relievers instead of starters.
It’s interesting to break down relief pitching even a little further, looking at what happens in all MLB games through the end of April vs the remainder of the regular season after April. Here is the percentage of innings pitched by relievers in those two conditions:
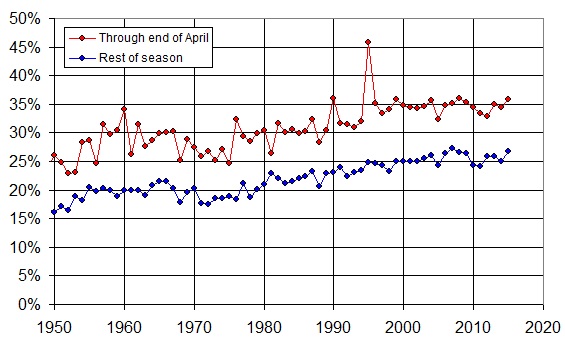
Both lines trending up over the years indicate what we already knew: relievers are throwing more and more innings, and it’s true for both April and the rest of the months. Incidentally, that spike for April in 1995 is due to the delayed start of the season from the 1995 strike–both a small sample size of games, and pitchers who had very little spring training to get ready.
Relievers have tended to be more effective than starters, especially as bullpen specialization (9th-inning closer, 8th-inning setup guy, and LOOGY) has increased. Because relievers roles are better defined, they can warm up more efficiently and not worry about leaving anything in the tank. This leads to harder pitches, more strikeouts, and less offense.
Take a look at the ratio of the two lines in the plot above. This quantifies how much more pitching relievers do in April vs the rest of the season. For example, in a given year, if they threw 30% of April innings and 20% for the rest of the season, that would register as 150% for that year, since they threw 1.5 times as many of the April innings (on a percentage basis).
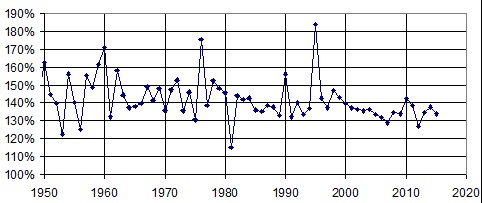
Throughout the 1970s, relievers pitched about 1.45 times as many innings than they did during the rest of the season (again, on a percentage basis). In the 1980s, it was about 1.40. In the 1990s, when offense spiked, so did the relievers’ innings (as starters were getting knocked out like crazy) but over the 2000s the value dipped as low as 1.30, a value it has hovered around in recent innings.
This makes sense for a couple of very different reasons:
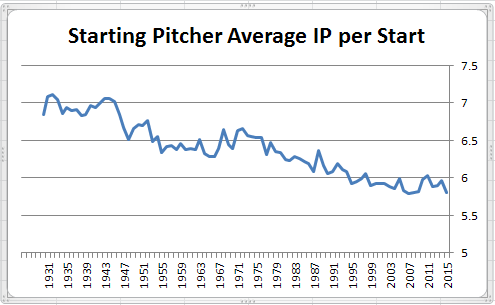
- First of all, there are only so many innings. It’s hard to imagine starters averaging less than 6 IP per start, league-wide. So whereas they once averaged 8 IP per start, that slid down to 7, then down to 6.5, and now is approaching 6. But it just can’t fall much lower. So, we’ll likely never reach the point where relievers are tossing 40% or more of innings over any significant period of time.
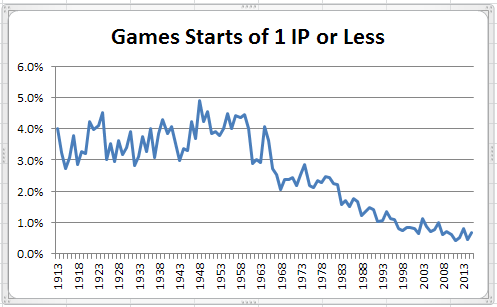
- Secondly, imagine the patterns of relief pitching over the years. When complete games were still common (think 1950s through 1970s on these graphs), pitchers at the start of the season were a little less likely to toss a complete game because they weren’t yet stretched out. Therefore, in years gone by, relievers were more likely to appear in April than later in the season. hence the larger percentage difference during those eras. Once we got into the 1980s, complete games started to become less common overall, and relievers started appearing more consistently during the season, April and otherwise alike. Now that the complete game is for all intents and purposes the dodo, relievers appear all the time, season-long, and the difference between April and the rest of the season is diminished.
Do you realize what this means? It means the notion that “pitchers are ahead of hitters early in the season” is wrong. The more likely explanation is that “relievers were used more frequently in April in years gone by, and were more effective, hence lower April offense, but now that there is much less difference in relief pitcher usage, there is little difference in April offense and that of the other months.”