Building a Simpler Pitcher WAR Metric – Part 3

Hello again, my HHS friends! Dr. Doom here again. Thanks for bearing with me through those first two parts; I know they were review for most of us, but I figured I should make sure to explain everything, just in case someone new needed a primer. In any case, welcome to the final part of the series. As always, a special thanks to Doug for posting these, and to the community for tolerating them. This truly is a great place to talk baseball on the web.

As you’ll recall, in Part 1 we discussed the Pythagorean Record and how innings pitched relate to decisions. In Part 2, we saw how ERA+ works. Now, using those tools at our disposal, it’s time to build our WAR paradigm! More after the jump.

Let’s start with getting a record for a pitcher based on ERA+. I’m going to pick on Dizzy Dean in 1937, because… why not? This is always what Bill James does in his writing – just picks a random player in a random year to make a point about something unrelated. So I figure I’m in good company. Regardless, in 1937, Dizzy Dean had his last halfway-decent season. He went 13-10 with a 2.69 ERA. He was no longer leading the league in strikeouts, but he still posted the best walk rate in the league.

Anyway, germane to our discussion, he posted a 147 ERA+ in 197.1 innings. The first thing we need to ask ourselves is, “How many decisions did he deserve?” To discover the answer, we simply divide innings pitched by nine. 197 1/3 divided by 9 is 21.93, which we’ll call 22. He actually got 23 decisions, so we’re starting by removing one of those. Hopefully, you’re with me so far.

Now, the next step is the “math” step. If you’re squeamish about math, I will try not to lose you, but it’s pretty simple arithmetic. What you’re going to do here is figure out the Pythagorean Winning % based on the pitcher’s ERA+. Now, when I introduced the Pythagorean Record, I pointed out that it’s figured by putting runs scored in the numerator and both runs scored and runs allowed in the denominator. Of course, what we don’t have today is runs scored. So what we’re going to do is assume an average offense. We do this with the number 100. Pythagorean records hold with ratios. In other words, plugging in 800 runs scored and 600 runs allowed will give you the same Pythagorean Record as 4 runs scored and 3 allowed. So what we do here is use 100 as an average offense (since a 100 ERA+ would be an average pitcher).

Normally, what this would look like is this:

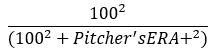
That might seem right to you… but it’s WRONG. You see, this is where we get into the problem of reciprocals. ERA+ is “inverted,” as you may remember, meaning that the “wrong” thing is in the numerator and the wrong thing in the denominator. If you use ERA- or FIP-, the above formula is correct. If you use ERA+, you have to turn it around. It looks, correctly, like this:

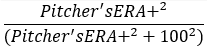
In the case of Dizzy Dean in 1937, we have:

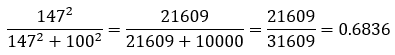
Now that we know his “winning percentage”, we can apply it to his number of decisions – which, you’ll recall, was 22. That gives us 15.04 wins (we can safely round down, I think), for a 15-7 record. Dizzy Dean was actually 13-10 in 1937, but deserved to be 15-7. Dizzy Dean was 2.5 games better than his record indicates in 1937.

So, to recap, we’ve used wins, winning percentage and ERA+ to arrive at the number of wins we think a pitcher deserved (as an aside, Bill James, in his Hall of Fame book titled, in different versions, Whatever Happened to the Hall of Fame or The Politics of Glory, introduced a cute little method to bring wins and winning percentage into a single unit: it’s simply wins * winning% + wins – losses. It’s a cute little formula, and works decently for putting a whole career on a one-number scale. Play around with it, if you like.) 

But, how does this get us to WAR? Well, this is the fun part. First, you pick a replacement level. Let’s say you think “replacement” is nonsense, and it’s all about average. Fine. That’s easy. In Dizzy Dean’s 22 appearances, an average pitcher would’ve gone (duh) 11-11. Dizzy “went” 15-7. That means he’s 4 wins above average, as he won four games that an average pitcher would’ve lost.

But let’s say you think it’s more complicated than that. Let’s say you think a replacement pitcher would’ve had a .375 winning percentage – this is what the Baseball Gauge uses for its “bench” feature – 75% of average. Fine. That works out to a replacement pitcher winning 8.25 games out of 22. Dizzy won 15, which makes him 6.75 Wins Above Replacement. If you like the .294 winning percentage used by Baseball-Reference and FanGraphs, you get 6.5 replacement level wins, which gives 1937 Dizzy 8.5 WAR (rather than the 4.5 and 4.8 WAR that B-R and FanGraphs actually credit him with).

So… why look at WAR this way? Well, it’s easy to calculate, it’s a FUN way to play with sabermetrics, and it lets us compare starters to relievers. For example. In part two, I told you about Rollie Fingers‘ 333 ERA+ in the 1981 strike year. That’s great, obviously. But what does it mean? How do I compare it to Dizzy Dean in 1937, for example? Well, Diz was 4 games better than “average,” right? I have Rollie in 1981 deserving 8.66 decisions, which we’ll call 9, giving him the benefit of the doubt. This method has him deserving an 8-1 record. That’s 3.5 wins above average, which allows me to definitively say that, relative to average, Dizzy Dean’s 1937 was a better season than Rollie Fingers’ 1981 – in spite of Fingers’ season having more than double the ERA+.

As shown above, this method lets us figure out how many wins we think a pitcher really deserved. Was Walter Johnson hosed by playing with the Senators? Sure he was. How much, though? Well, his historical record will tell you that he went 417-279. By this method, I have him deserving of a 449-207 record for a .684 winning percentage, instead of the .599 he actually posted (applying that .684 to Johnson’s 696 actual decisions yields 476 wins, 59 more than his actual total). Bottom line is Johnson was SUPER cheated toiling for the Sens, and we can put a number on it. If we use a .300 winning percentage as “replacement,” a replacement-level pitcher would’ve gone 197-460. That means Johnson deserved to win 252 more games than a replacement player! 

Some other notables look like this: Cy Young is at 291 wins above replacement level; Sandy Koufax at 86; Bob Gibson at 137; Randy Johnson at 160; Kevin Brown at 115 (note that Kevin Brown is well ahead of Sandy Koufax; I think I’ve made my position on that matter clear in COG voting, but just wanted to reiterate). In case you’re wondering about our test case: while Dizzy Dean’s 1937 record is improved by this method, he actually loses his 30-win season and moves down to a total of 138 wins, rather than the Gashouse-Gang-inflated 150 that he actually won.

I like to think this is a fun little tool for comparing pitchers, for a “20-win season” to still mean something (no one can manage a 20-WAR season as standard WAR is calculated), and I think it’s fun to develop little tools (much as Bill James does, the master at this sort of thing). It’s fun to remember that ANYONE can do this kind of thing, if we just give it some time and thought.

Well, I hope you all enjoyed this little tool. Feel free to play around with it. Find something interesting? Pass it on! Think it’s cool that Mariano deserves a 115-27 record (not 82-60)? I think so, too! (And it’s darn close to Dizzy Dean’s numbers, considering Mariano was just a ninth-inning guy basically his whole career, while Dean is in the Hall of Fame as a starter). Did those few years as a reliever cost John Smoltz the chance at 300 wins? No; but you’re welcome to try to make the numbers work out, if you’d like. Would Catfish Hunter be in the Hall if he had a 199-184 record, like he actually deserved?  I doubt it. How would we feel about Pedro‘s 2000 season had he gone 22-2 (!!!!!), like he should’ve? I don’t know, but that would’ve been awesome. Should Bob Gibson have won 30 in 1968? I’ll let you figure it out, in case you want a little homework. I’d love to hear if you have any thoughts on this. I look forward to your comments, and thank you for tolerating my ramblings in this series!

For those who would like to try out the new metric, a spreadsheet with a pivot table has been prepared for expansion era pitchers, and includes every 50+ IP season since 1961. There you can select individual pitchers and compare FanGraphs WAR (fWAR) with the new WAR metric (nWAR) based on FanGraphs ERA+ measure (it’s actually 10,000 divided by FanGraphs ERA- metric). To use the Pivot table:

  1. Download the spreadsheet from the link above, and open in Excel. 
  2. In the top left of the Pivot table, click on the filter symbol (hourglass) beside the pitcher’s name and search for the pitcher you want to see by typing his name (first and last) in the Search box and click on his name when it appears in the search results.
  3. Wait a second or two, and the individual season results will be displayed in the table.

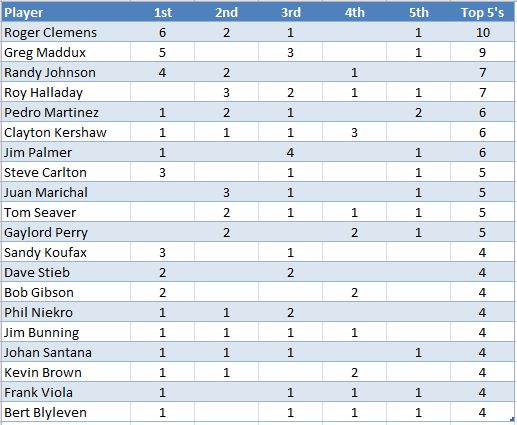
Also in the spreadsheet is a list of the Top 5 nWAR results for each season since 1961. The tale of that tape looks like this:

0 0 votes
Article Rating
Subscribe
Notify of
guest

117 Comments
Oldest
Newest Most Voted
Inline Feedbacks
View all comments
Dr. Doom
Dr. Doom
5 years ago

Thanks to Doug for posting and to all of you for dealing with the boring posts in the series. Hope you liked this one!

Dr. Doom
Dr. Doom
5 years ago
Reply to  Doug

Doug is correct, everyone. Perhaps you haven’t figured out WHY Doug is correct, though. And maybe my posts in the series didn’t explain well enough why this is true, so I’ll shoot for you. The WAR formula, as constituted at baseball-reference and Fangraphs, has the same 162 games as a team. However, they only deal in one dimension – wins, naturally – so that takes 81 of those games (for an average team) away. Then, of the 81 remaining games, 49 get swallowed up by replacement level. And of the 32 remaining wins, they are distributed among all players on… Read more »

Brett Alan
Brett Alan
5 years ago

Jacob DeGrom’s Pythagorian record, by this formula: 14-3
Jacon DeGrom’s actual record: 6-7

Mets = Must Endure The Suffering

Dr. Doom
Dr. Doom
5 years ago
Reply to  Brett Alan

I have myself checked DeGrom’s record by this formula several times already this season (mostly when I thought my Brewers were still in contention for his services). He’s having a heckuva year. Too bad the Mets are making an utter mockery of it.

Dr. Doom
Dr. Doom
5 years ago

Here’s a fun one: There are people out there who will tell you that Steve Carlton in 1972 was hosed by pitching on SUCH an awful team. “What would his record have been,” they say, “If only he’d had an AVERAGE team to pitch in front of?” Well, as we talked about in Part 2, this stat doesn’t adjust for defense, so maybe there’s an argument to be made that Carlton would’ve been much better. But check this out: Carlton ’72 had 346 1/3 innings pitched. That’s 38.5 decisions for Imaginary Steve. Carlton ’72 had a 182 ERA+. That’s a… Read more »

no statistician but
no statistician but
5 years ago

Doom: Your use of absolute language here is unfortunate, I think. To illustrate my objection with a single example, you state with no qualifiers that in 2000 Martinez “should’ve” gone 22-2. Looking at the actual game logs, what do we find? Yes, he lost two games in which his team was shutout, but he also lost two games when his team scored a single run and one in which they scored twice. I don’t honestly think you’re being fair to Pedro to insist that he “should’ve” pitched shutout ball in those two one run support games and allowed a single… Read more »

Dr. Doom
Dr. Doom
5 years ago

Haha, oh nsb. When I wrote this post, I thought, “I’m interested to see what nsb complains about when this posts.” Here are my counterarguments for you. Let’s start with Pedro’s 2000. First of all, there are three entire posts about this methodology. I don’t think that each sentence also needs additional qualifiers to explain that this method isn’t absolute. Think about the way we use the words “won” and “lost” in baseball. We might say, “Pedro won last night due to his overpowering fastball.” Well, actually, no player in the history of baseball has ever won a game by… Read more »

e pluribus munu
e pluribus munu
5 years ago
Reply to  Dr. Doom

I’d like to agree with Doom, without losing nsb’s points, which I think are valuable. I’ll try to keep it short because I haven’t yet had time to play with Doom’s toy and assess it (or to figure out what Doug means by “scroll to the bottom of the pivot table editor,” so I can make use of what seems to be a heroic effort by Doug to make Doom’s idea operable). I’ve spent a lot of time preparing HHS posts by poring over game logs to discover the granular components underlying umbrella stats like WAR, and even ERA. It… Read more »

e pluribus munu
e pluribus munu
5 years ago
Reply to  Doug

#2 doesn’t result in anything for either of my PCs, Doug. When I click anywhere on the table (which just now features Andy Pettitte), my computers just shrug, “So?” I’ve tried clicking off the table, looking on function drop-down lists, logging on to my Google account, and so forth. My computers just reply, “What?” The older one is getting cranky, too.

I wonder whether others are getting results.

no statistician but
no statistician but
5 years ago

My result is the same as epm. But also, under the heading at the top there is a small blue rectangle with the old CBS eye and the words “View only.” Clicking on the rectangle produces the comment: “You can only view this document. To make changes ask the owner for edit access.” An additional note states “REQUEST EDIT ACCESS. I have just now clicked on this note and a new window has appeared from which, one assumes, I can do just that. Let’s try. Hm. Presumably the request is now on it’s way through the ether to you, Doug.

e pluribus munu
e pluribus munu
5 years ago
Reply to  Doug

Still a no-go for me, although the “Anonymous Badger” button in the upper right has been replaced by “Anonymous Duck” — makes me wonder whether you’re not secretly some sort of a quack, Doug.

I’ll wait to see whether the permission-slip tactic nsb tried may work, and if it does, I’ll ask the hall monitor for one too. . . . It used to work, in the old days.

Doug
Doug
5 years ago

Well, somebody managed to delete the pivot table. But, I’ve recreated it. Link now is:
https://docs.google.com/spreadsheets/d/1w1ipoJBkxuvS73cJYZ2vkWvj23YSkqLtIcAOre3sYQY/edit?usp=sharing

e pluribus munu
e pluribus munu
5 years ago
Reply to  Doug

That worked, Doug. But when I typed in a name (Johnny Antonelli), the table wiped clean and I got an #ERROR message in place of table contents — and since each time I reload from your link, the error message is all I get, I’m worried that my ‘editing’ may have affected the file.

Doug
Doug
5 years ago

I see. Sorry it’s not working. I’ve posted it to the HHS site so you can download and use it in Excel.

Instructions and link (http://www.highheatstats.com/wp-content/uploads/2018/08/fWAR-and-nWAR-for-50-IP-Seasons-from-1961.xlsx) are in the updated post.

e pluribus munu
e pluribus munu
5 years ago
Reply to  Doug

Cool stuff, and no shortage of it. Thanks, Doug!

no statistician but
no statistician but
5 years ago
Reply to  Dr. Doom

As penance I’ve tried to use your formula on some career pitching records from the era I know best. If I’m doing it wrong, I wouldn’t be surprised, but anyway, my results are these (Any calculating errors are the errors of my calculator): In the controversy of whether Billy Pierce was really the star and Whitey Ford was a flim-flam artist simply buoyed by an outstanding defense, these are the results: Pierce’s record changes from 211-169 to 215-152. Ford’s goes from 236-106 to 233.5-118.5. How does Hoyt Wilhelm, the star reliever of the era fare? His 143-122 W-L changes to… Read more »

Dr. Doom
Dr. Doom
5 years ago

Thanks for giving it a try, nsb! I think what you come to find when you do this is the thing people have said for a long time: over the course of a career, in general, these things even out, and career W-L records are pretty accurate assessments of the quality of pitchers. Of course, you get some guys (many of them Yankees) who benefit from great team, and some guys (Bert Blyleven, for example) who pitched with bad squads and lose some they perhaps didn’t deserve to. But, overall, you see that most people are right in the same… Read more »

yippeeyappee
yippeeyappee
5 years ago

Speaking of pitchers, any comments on Kevin Cash pulling Blake Snell, after throwing just 47 pitches in a perfect game through 5 innings? Maybe the best opportunity of his career, against the poor-hitting Blue Jays.

e pluribus munu
e pluribus munu
5 years ago
Reply to  yippeeyappee

Well, YY (if I may), the odds for four more perfect innings were super low, and Snell’s still more or less in rehab after a recent DL stint, so he was on a pitch-count limit well under the normal 100. If Cash knew there was no way he was going to let Snell finish the game anyway, it may be better that he pulled him earlier, rather than later. With a 4-0 lead and no possibility of allowing even a low pitch-count CG, there was nothing to gain by leaving him in longer.

Doug
Doug
5 years ago

I don’t know about that. His pitch count may have been under 100, but it certainly wasn’t 50. Let him pitch another inning or two and, if he continues to be effective, it’s that many fewer innings that you have to ask of your bullpen.

Every time you go to your pen, you’re putting the game in jeopardy because you risk bringing in a guy who doesn’t have it on that night. Better to stick with someone who does have it working on that day.

e pluribus munu
e pluribus munu
5 years ago
Reply to  Doug

Ok, let’s get into it!

Your calculation is unquestionably right: you’re thinking in terms of winning the game with the best balance of stress on the pitching staff. But I think you’re ignoring the unique situation we’re talking about, which is at the focus of my thinking: the increased pressure/outrage the further into a game you pull a perfect-game throwing
pitcher.

Snell threw 59 pitches in his first post-DL start, so presumably he had 1-2 innings left. If your calculation pays off with its best result, you’ll be pulling Snell seven innings into a perfect game. . . . Oy!

Doug
Doug
5 years ago

I guess my only comment would be that if Kevin Cash took out his starter after five innings because it would be harder (i.e. more controversial) to do so if the perfect game or no-hitter was still intact later in the game, then that is flawed judgment. If the Rays were fortunate enough to be in that situation after six or seven innings, then that’s a good “problem” to have, but the strategy should remain the same: manage to win the game by using your pitching staff in an optimal manner based on whatever constraints the manager deems prudent in… Read more »

e pluribus munu
e pluribus munu
5 years ago
Reply to  Doug

Doug, I think perhaps you’re more of a purist than I.

Dr. Doom
Dr. Doom
5 years ago

Some interesting people here, for those intrigued. I’m not sure these are correct; they ARE the answers in my original table, but that used Fangraphs ERA-, which is just different enough to potentially skew some of these things. Anyway, hope you enjoy. I will list pitchers with their true W-L record first, then the adjusted one I’ve shown how to calculate in these posts. Pitchers most-helped by this analysis: Walter Johnson, 417-279 –> 449-208 (+103 G vs. 500) Dutch Leonard, 171-192 –> 210-148 (+83 G vs. .500) Bob Friend, 197-230 –> 214-187 (+60 G vs. .500) Bert Blyleven, 287-250 –>… Read more »

Doug
Doug
5 years ago
Reply to  Dr. Doom

Largest differences in “deserved” Wins vs. actual Wins, for starters, since 1961 (excl. seasons under 50 IP). Positive differences mean pitcher was short-changed in the win column. Negative differences mean actual wins are inflated. +38.2 – Bert Blyleven +34.7 – Gaylord Perry +28.3 – Phil Niekro +24.7 – Steve Rogers +24.2 – Jon Matlack +23.7 – John Smoltz +22.2 – Jose DeLeon +21.3 – Matt Cain +20.4 – Tom Seaver +20.1 – Jim Barr … -25.3 – Aaron Sele -26.1 – LaMarr Hoyt -27.6 – Tony Cloninger -29.7 – David Wells -30.2 – Jack Morris -30.2 – Rick Porcello -30.8… Read more »

Mike L
Mike L
5 years ago
Reply to  Doug

OMG, the “Pitched to the Score” table.

no statistician but
no statistician but
5 years ago
Reply to  Mike L

For the most part, the table shows pitchers with long careers, the big names divided among those who spent a lot of seasons with weak teams, and those who spent few seasons with weak teams. The surprises to me are Cain, Barr, Hoyt, Cloninger, and maybe Sele, because they didn’t have particularly long careers. Smoltz only makes the list, I’d opine, because of his early years when the Braves stank combined with his four years as a reliever, since the formula rewards relievers by essentially converting non-decision appearances to W-L.

Dr. Doom
Dr. Doom
5 years ago

Doug’s table only shows gains in wins; in mine, I took changes to W-L record, which includes losses. Once you’ve fooled around with this for a while, you find that perhaps the BIGGEST factor for guys who improve is not really the turning of ND into W; it’s basically that they took WAY too many losses. For example, Bob Friend. In reality, he won 197. I have him worthy of 214. That’s not a huge difference. But you know what is? The fact that he was actually saddled with 230 losses, when he may have deserved the 187 I show… Read more »

Mike L
Mike L
5 years ago
Reply to  Dr. Doom

Intuitively, the “more losses than merited” makes some sense. Weaker teams would score fewer runs and have thinner bull-pens (although for pitchers like Walter Johnson, who completed 531 out of 666 starts) and just wouldn’t have that cushion. On a hunch, I looked at Johnson’s 1924 season, 23-7 that season, Washington wins WS. That team actually had a serviceable bullpen. His losses: April 25, 6-5 loss with three unearned runs scored (total of five errors in game), May 8, 4-2, CG loss May 14, 5-2, 4IP (game was shortened, he was taken out after 4), June 30, 2-1 Complete Game… Read more »

Dr. Doom
Dr. Doom
5 years ago
Reply to  Mike L

On the other hand, I have Johnson worthy of a 21-10 record that year. Yes, he had tough losses. But he also got quite lucky. He gave up 4+ seven times all year, and went 2-2 in those 7 games. (The league ERA was 4.23, but Johnson, based on ballparks and such, was expected to have a 4.05 ERA, so anything above a 4 is definitely in “L” territory.) He did pitch insanely well in 1924, but it was far from his best work, and I don’t think he was really terribly cheated that year. As you say, they had… Read more »

no statistician but
no statistician but
5 years ago
Reply to  Mike L

Mike L:

“Serviceable bullpen”? In that year Firpo Marberry set what was then a major league record with 15 saves for the team. The next year he led with 16, another record. Then 22 in 1926, a record that stood until 1949. If not the absolute first, Marberry was certainly the premier early relief specialist. In the 1924 Series he had a pair of saves.

Mike L
Mike L
5 years ago

Well, NSB, it certainly served…
Fun fact about Marberry: He was 0-5 against the St. Louis Browns in 1924

Doug
Doug
5 years ago
Reply to  Dr. Doom

Same idea except looking at largest differences in “deserved” W-L% vs. actual W-L%, for starters (min. 1000 IP in 50+ IP seasons since 1961, partial careers with asterisk). Positive differences mean pitcher was short-changed in W-L%, negative differences mean actual W-L% is inflated. +.121 – Jim Beattie +.116 – Matt Young +.102 – Bob Friend* +.100 – Tomo Ohka +.094 – Jose DeLeon +.093 – Jim Abbott +.093 – Jason Johnson +.093 – Jesse Jefferson +.091 – John Thomson +.090 – Rick Langford … -.090 – Kirk Reuter -.090 – Mark Mulder -.090 – Tom Browning -.096 – LaMarr Hoyt… Read more »

no statistician but
no statistician but
5 years ago
Reply to  Doug

Bob Friend. He makes it into Doom’s comment above also. A regular point of discussion back in the late Fifties was what he might do on a better team than the then-lowly Pirates, so his appearance here isn’t too surprising, even though it only cover his later years. Like some other pitchers from earlier times, he was such a valuable asset, an inning eater who kept the team competitive, as well as being popular with the fans, that the Pirates wouldn’t entertain trade offers, not after unloading Ralph Kiner in 1953—a good move, actually, but one that had the Pittsburgh… Read more »

Mike L
Mike L
5 years ago

I almost expected Dick Ellsworth to be on here.

no statistician but
no statistician but
5 years ago
Reply to  Mike L

Ellsworth was one of those players for whom the term ‘career year’ was invented. Rookie seasons are most often the career year of this type of player, especially pitchers—Mark Fidrych leaps to mind, but so do Joe Black, Jim Turner, Vida Blue, and these are just off the top of my head. Ellsworth’s 1963 year is supposedly attributable to his acquiring a slider, learned from new Cub acquisition Larry Jackson—a real pitcher who labored a decade and a half for mostly bad teams who would have been far worse without him. But I digress. The fact that there is a… Read more »

Doug
Doug
5 years ago

I think Vida Blue is in a different category from the others you mentioned. Yeah, his 9.0 WAR rookie season (technically, he wasn’t a rookie, but sure seems like he should have been) stands out (how could it not?), but he also had a 7 WAR season, two with 5 WAR, another with 4, and five more with 2 WAR. I think that’s a solid body of work for a career, more especially for one that was basically over at age 32. Incidentally, the 1976 AL CYA would be an interesting topic for an Awards post. Palmer won it, because… Read more »

no statistician but
no statistician but
5 years ago
Reply to  Doug

I can’t disagree, except to say in my own defense that his ’71 season is all that sticks in my mind or most anyone else’s, even though his career wasn’t a failure after that. What it reminds me of—has anyone else had this thought?—is the career of Dwight Gooden. They aren’t exactly alike, but close enough. Both pitchers had a huge season very early that was never matched subsequently, both missed a full year of play, both won 24 games in the big season, both had drug issues, both switched leagues mid-career, both were miserable failures in World Series play… Read more »

Doug
Doug
5 years ago

You could add that Blue is the last pitcher aged 21 or younger to throw 300 IP, and Gooden the last to throw 250 IP, reaching that total at age 20 and 21.

The last ten 250 IP seasons aged 21 or younger belong to Gooden (2), Tanana (2), Blyleven (2), Blue, Fidrych and Fernando. But, can you guess the 10th?

no statistician but
no statistician but
5 years ago
Reply to  Doug

Doug:

Seems like nobody’s guessed, so why not clue us in.

Doug
Doug
5 years ago

Roger Erickson is the answer, with 265 IP as a rookie (but no RoY votes). He went 14-13 in that debut season, but 21-40 for the rest of his career. Erickson pitched well in his 3rd season (one of the extremely unlucky W-L seasons mentioned elsewhere in the comments), but that was the only bright spot after his debut season.

Richard Chester
Richard Chester
5 years ago
Reply to  Doug

Gene Bearden is a good comparison for Erickson. Bearden was 20-7 in his rookie year, then went 25-31 for the rest of his career.

e pluribus munu
e pluribus munu
5 years ago

nsb, I agree with your comparison of Blue and Gooden; they’re resemblances have occurred to me too. However, I’ve always placed Blue in a separate category from Gooden and everyone else, because I think of his career as sabotaged by his own ill-advised (if justifiable) decision to hold out in the Spring of ’72. I think all of us were anticipating a drop off from that amazing ’71 season, but that was magnified several times over by Blue missing Spring Training and the first six weeks of the season, and returning only after being humiliated by a vindictive SOB of… Read more »

Dr. Doom
Dr. Doom
5 years ago

Regarding Gooden and Blue, here are their actual records, and then applying my formula:

Gooden 194-112 –> 176-135
Blue 209-161 –>207-165

As we can see here, Blue was a little bit lucky relative to his run prevention (6 games). Gooden was EXTREMELY lucky (41 games). I’m shocked, actually.

They other interesting note about comparing these two is that, by this formula, Gooden is 41 games over .500, while Blue is 42 games. Very close; much closer than the 84 actual games Gooden was over .500, compared to Blue’s 48.

Mike L
Mike L
5 years ago
Reply to  Dr. Doom

Gooden was basically a 4th or 5th starter after 1993, his age 28 season. His career mark was 132-53 (Spud Chandler territory) through his age 26 season.

Doug
Doug
5 years ago
Reply to  Dr. Doom

On the EXTREMELY unlucky list, I give you Steve Rogers with a 158-152 record, but a 181-134 mark based on his B-R ERA+ score, matching Gooden’s 41 game shift. Exhibit A in Rogers’ career is his 7-17 record with a 116 ERA+ in 1976, understandable given the Expos’ 107 losses, but still the only post-WWII season by a starter with 4 WAR and W-L% under .300.

Dr. Doom
Dr. Doom
5 years ago
Reply to  Doug

A few other famously unlucky seasons come to mind in light of Rogers’ 1976. Jacob DeGrom 7-7 –> 14-3 (+11)… in progress, obviously Kevin Brown, 1996: 17-11 –> 21-5 (+11) Phil Niekro, 1978: 19-18 –> 25-12 (+12) Bob Gibson, 1968: 22-9 –> 29-4 (+12) Jim Bunning, 1960: 11-14 –> 19-9 (+13) Sam McDowell, 1968 15-14 –> 22-8 (+13) Felix Hernandez, 2010: 13-12 –> 21-7 (+13) Steve Rogers, 1976: 7-17 –> 15-11 (+14) Walter Johnson, 1919: 20-14 –> 27-6 (+15) Nolan Ryan, 1986: 8-16 –> 16-8 (+16) Those were the ones that sprung immediately to mind, but once I got to… Read more »

Richard Chester
Richard Chester
5 years ago
Reply to  Dr. Doom

Possibly Ned Garver in 1950. Maybe you’ve done him and I missed it.

Doug
Doug
5 years ago
Reply to  Dr. Doom

Jim Abbott, 1992: 7-15 s.b. 16-7 (+17) Shelby Miller, 2015: 6-17 s.b. 14-9 (+16) Ned Garver, 1950: 13-18 s.b. 20-9 (+16) Dutch Leonard, 1948: 12-17 s.b. 18-7 (+16) Hal Newhouser, 1942: 8-14 s.b. 15-5 (+16) Turk Farrell, 1962: 10-20 s.b. 16-11 (+15) Brandon Webb, 2004: 7-16 s.b. 14-9 (+14) Matt Cain, 2007: 7-16 s.b. 13-9 (+13) Roger Erickson, 1980: 7-13 s.b. 14-7 (+13) Dennis Lamp, 1978: 7-15 s.b. 15-10 (+13) Al Benton, 1942: 7-13 s.b. 16-9 (+13) Corey Kluber, 2015: 9-16 s.b. 15-10 (+12) Greg Swindell, 1991: 9-16 s.b. 15-11 (+11) Warren Spahn, 1952: 14-19 s.b. 19-13 (+11) Bill Wight,… Read more »

no statistician but
no statistician but
5 years ago
Reply to  Dr. Doom

If John Autin were still contributing he would undoubtedly bring up Clemens 10-13 year in 1996—of which, incidentally, I remember instigating a lengthy discussion by challenging his interpretation on the basis of Clemens’ erratic performance. In games Roger won his ERA was 1.54. In losses it was worse than inverted: 5.14, maybe not as bad as the little girl with the little curl, but tending much that way. Doubtless looking at the season as a unit using Doom’s formula won’t take that erratic performance into account, but I still maintain that it precludes 1996 from being a particularly fine season… Read more »

Doug
Doug
5 years ago

Responding to nsb, Clemens’ 1996 performance in wins versus losses is not particularly unusual, being close to his career marks of 1.73 ERA in wins and 5.80 in losses.

For the AL in 1996, ERA in wins was 2.49, and in losses was 8.61. These numbers are for the pitcher of record, not for starting pitchers who record a decision (which would be a better comparison), but they do provide an indication of how different ERA results are in wins versus losses.

Richard Chester
Richard Chester
5 years ago
Reply to  Dr. Doom

DR. Doom: To zero in the pitchers you are looking for you can do this:
Run the BR PI season pitching finder and set it for L=15 and ERA+ =15,W=130.
Of course you don’t have to use the particular numbers that I mentioned.

Richard Chester
Richard Chester
5 years ago

That comment of mine did not post as I wrote it. I’ll do it again.
Run the BR PI season pitching finder for L=15 and ERA+ =15, W=130.
Of course you don’t have to use the particular numbers that I mentioned.

Richard Chester
Richard Chester
5 years ago

My second attempt did not work either. I’ll try again.
Run the BR PI for losses fewer than 10, wins greater than 15 and ERA+ less than 90.
Then run it for losses greater than 15, wins fewer than 10 and ERA+ greater than 130.
Of course you don’t have to use the particular numbers that I mentioned.

CursedClevelander
CursedClevelander
5 years ago

Off topic, but did you guys see the news about the signed baseball that just broke the auction record for a signed ball? It belonged to Marv Owen, a 3B from the 1930’s, and was signed by 11 of the first 13 inductees to the HoF at the 1939 induction ceremony. Only missing were Wee Willie Keeler, who passed away in the 20’s, and Gehrig, who was too ill to attend. That leaves Ruth, Wagner, Cobb, Mathewson, Big Train, Cy Young, Lajoie, Speaker, Alexander, Sisler and Collins. How’s that for your mantel? And you could have had it with that… Read more »

Dr. Doom
Dr. Doom
5 years ago

That’s less than I would’ve expected, honestly. That one Honus Wagner baseball card fetched $2.8 mil. A Mickey Mantle rookie once sold for $525K. I would WAY rather have that baseball, if I had the money for any of those things. Seems like a pretty good deal for whoever bought it, as these things go, anyway.

CursedClevelander
CursedClevelander
5 years ago
Reply to  Dr. Doom

I’d agree, especially since the old records were for a Gehrig/Ruth dual signed ball and a Ruth-only ball. Those went in the high $300k’s. If you’re an uber wealthy baseball collector, adding 10 Hall of Famers for another $250k or so seems like a fantastic deal.

I’d also probably choose this ball over the fabled “Card,” the T-206 Wagner that graded as an 8, especially since that card has been found to be trimmed to increase its grading.

CursedClevelander
CursedClevelander
5 years ago

Minor correction: Mathewson isn’t there either, as he died in the 20’s from tuberculosis. The 11th Hall of Famer on the ball is Connie Mack.

Apparently there are two balls like this – Owen was getting them signed on behalf of Hank Greenberg, who was apparently too shy to ask. Greenberg let Owen keep one, which was immediately placed in a safe deposit box in a fur lined glove. There are some pictures of the ball here.

https://www.beckett.com/news/623k-for-ball-signed-by-ruth-cobb-wagner-and-8-other-original-hall-of-famers/

Jeff Harris
Jeff Harris
5 years ago

What? No Jack Morris in the table? But he’s in the HOF! 😉

Dr. Doom
Dr. Doom
5 years ago
Reply to  Jeff Harris

Doug included two separate things: those who gained/lost wins, and a second table of those whose winning % changed most. The winning % table favors those with fewer innings pitched – the more innings you pitch, the more you regress toward the mean. The other table, dealing with Wins, doesn’t factor in losses. I could’ve included Morris in my table, though, in which I consider both change in W and change in L. Morris both loses quite a few W AND gains a few L, which makes his record substantially worse: 254-186 (actual) –> 223-202 (estimated) That’s a 47-game swing!… Read more »

no statistician but
no statistician but
5 years ago

Off topic: Last night for the Cubs David Bote hit a walk-off grand slam when the Cubs were behind 3-0. Surely a rare occurrence, even if you include games when a shutout wasn’t at stake.

Dr. Doom
Dr. Doom
5 years ago

17th “ultimate slam” since 1974, according to MLB. I’d be curious how many of those came with 2 outs, as this one did.

Not only that, but the rally in the 9th for the Cubs included only ONE hit – Bote’s slam. The bottom of 9 went Out, E-4, HBP, Out, HBP, HR.

Also, 6 of the 7 runs in the game were scored in the 9th. The Nats had 2 in the top of the inning. I imagine a lot of Cubs fans wanting to beat everyone to the L leaving Wrigley early. Ain’t baseball great?

Richard Chester
Richard Chester
5 years ago
Reply to  Dr. Doom

The BR PI indicates 23 GS with a team down by 3 runs since 1925 including last night’s. 13 have been with 2 out. There are no such GS in extra innings.

Richard Chester
Richard Chester
5 years ago

One other such HR has been with a 3-0 score. Sammy Byrd did it on 5-23-1936, Reds over the Pirates.

Dr. Doom
Dr. Doom
5 years ago

I mentioned 300-game winners above. In other words, I may have missed someone. But it bears thinking: what affect would these estimated records have on the 300-win club? Here are the players REMOVED from the 300-win club: 1. Tom Glavine – goes from 305 W to 285. 2. Randy Johnson – 303 to 297 3. Mickey Welch – 307 to 299 4. Old Hoss Radbourn – 309 to 295 5. Eddie Plank – 326 to 299 6. The aforementioned Early Wynn – 300 to 271 (look higher up the thread to my dialogue with nsb for context) Here are the… Read more »

Dr. Doom
Dr. Doom
5 years ago

Here are some nuggets from the past you all might find interesting: In 1968, Bob Gibson was great. Everyone knows that. But what some people don’t know is that he was second in the NL in wins that year, going 22-9 for the pennant winners, while Juan Marichal went 26-9 for the Giants. I have Marichal deserving a 22-14 record, with Gibson coming in at 29-4. Similarly, that year, Denny McLain famously became the last 30-game winner, going 31-6 for the pennant-winning Tigers. This method reckons that he won 5 he should’ve lost, crediting him with a 26-11 record. Relative… Read more »

e pluribus munu
e pluribus munu
5 years ago
Reply to  Dr. Doom

Doom, The actual answer to your first question is that Koufax’s season ended August 16. Chance had a terrific year in ’64 and deserved the CYA. But in thinking about Koufax, it’s good to remember that he was dealing with chronic arthritis that made his arm look grotesque after he pitched, even after it was soaked in ice (there were photos in the papers), and prevented him from being able to lift it for about a day. In ’64, he hit the wall in August; the Dodgers were more or less out of the race by that time, and he… Read more »

Dr. Doom
Dr. Doom
5 years ago

I would say that 1965 and 1966 make 1964 MORE puzzling, rather than less. I’m not denying Koufax’s pain. But that was true in ’63, ’65, and ’66, as well. He was hurt, yes, but he also had those fabulous seasons. It’s also tough to look at those 5-straight ERA titles, and it’s weird to think that someone else, not only WON a Cy Young, but was actually BETTER than Koufax in one of those years. Not in the NL (unless you prefer Drysdale), but it’s just weird to think of that anyone was better than Koufax in that stretch.… Read more »

e pluribus munu
e pluribus munu
5 years ago
Reply to  Dr. Doom

Well, on August 14, Chance pitched a shutout in the Angels’ 119th game; Koufax finished two days later, in his team’s 177th game. If we freeze the season there, with Koufax already done, this is what we see: Koufax: 19-5… 1.74 ERA… 223 IP… 15 CG… 7 ShO… 223 K … 0.926 WHIP… 4.21 K/W Chance: 13-5… 1.67 ERA… 188 IP… 9 CG… 7 ShO… 138 K … 0.982 WHIP… 2.42 K/W Chance continued to pitch about as well for the rest of the season, while Koufax was out of action, and that’s where the “more innings, more runs prevented”… Read more »

e pluribus munu
e pluribus munu
5 years ago

Just noticed: “177th game” should have been 117th. Sorry. (When Doom replies, I’ll probably be sorry for lots more.)

Dr. Doom
Dr. Doom
5 years ago

I actually figured out that you meant 117th… but I was VERY confused for a moment. Thanks for the research. I had no idea on all of those details, so I appreciate the research. I didn’t realize that the swelling in ’64 was so extreme in comparison to the other years. I guess what I’m thinking most of is last year’s Mike Trout. Best player, injury-curtailed season, middle (I think, anyway) of a phenomenal run… and one day, my son will look back and try to figure out why there was that ONE year when he didn’t finish top-2. We’ll… Read more »

e pluribus munu
e pluribus munu
5 years ago

I’m having fun with Doom’s tool, like everyone else, but I’m getting disturbed by the easy acquiescence a lot of comments seem to be showing to the idea that the discrepancy between nWAR and W-L has to do with what a pitcher “deserves,” or with good or bad “luck.” As I said somewhere on the string, in essence at least, I think nWAR is neat because, like pWAR, it raises the issue of whether pitchers got good or bad breaks, but the answer, as I see it, is absolutely not revealed by comparing nWAR to W-L: it’s only revealed by… Read more »

no statistician but
no statistician but
5 years ago

If we’re talking about Clemens in 1996, Here’s what he did in the month of April: 6 starts, 4 losses, 6 team losses (on top of his 10-13 lies the 14-20 record of the team in games he started). His ERA was 4.17 that month. The only time the team scored less than 3 runs in his starts was in a 6-1 loss where he was shelled, so no joy there. The season struggles along. Through August 10, Clemens is 4-11. His ERA stands at 4.36 on the season, and in games he starts the team is 6-18. In those… Read more »

Doug
Doug
5 years ago

No argument here. I saw that 7.7 WAR and thought it must be a misprint. Yet, the numbers don’t lie. B-R estimates that an average pitcher with Clemens’ defense (which was the worst of his career) facing the same opponents in the same parks would have allowed 6.08 runs per 9 innings, compared to Clemens’ 4.70. Clemens threw 242.2 IP, or one out shy of 27 nine inning games, so that’s over 37 runs above average, or about 5.3 WAA, figuring one WAA per 7 RAA (it was actually 5.4 WAA). But, I still agree with you – seven weeks… Read more »

Dr. Doom
Dr. Doom
5 years ago

epm, Here’s what I’d say. You’re disturbed by “by the easy acquiescence a lot of comments seem to be showing to the idea that the discrepancy between nWAR and W-L has to do with what a pitcher ‘deserves,’ or with good or bad ‘luck.'” I want to address all of those things here for a second: 1. “Luck”: You and I (and many others) have gone round and round and round on that term before. I don’t know if “chance” works better for you, or “factors beyond a pitcher’s control,” or what. But there is NOTHING in baseball that isn’t,… Read more »

e pluribus munu
e pluribus munu
5 years ago
Reply to  Dr. Doom

Wow — that’s a lot to respond to, Doom. I think to some extent you’ve read more disagreement with you in my post than I intended. My point isn’t that your nWAR stats are wrong in pointing to a disparity between the two W-L calculations, any more than pWAR stats are wrong when they evaluate a mediocre W-L pct. as an outstanding season. The point I was making is that we don’t know what accounts for that discrepancy till we research it, and we shouldn’t assume that the analysis implied by the aggregate stat is more accurate than the traditional… Read more »

Dr. Doom
Dr. Doom
5 years ago

Okay… “chance.” So, back to this theoretical McGwire pitch. It’s not random, but it is chance. Those can be different. McGwire faced that PARTICULAR pitch, while Edgar Renteria (don’t know why the example team is the 2001 Cardinals… just go with it) faced a different one. Why did one get one and one the other? We don’t know; there could be a million factors. What we don’t get to know, though, is how one would’ve done facing the pitch the other faced. That’s “chance,” because you don’t get to face the pitch of your choice. Hitting off a tee would… Read more »

e pluribus munu
e pluribus munu
5 years ago
Reply to  Dr. Doom

Doom, I think we need to distinguish three very different types of events: 1) events under the control of a single human agent; 2) events under control of multiple human agents; 3) events under the control of no human agent. I reserve “chance” for (3). I use “luck” to refer to the elements of (2) not under control of one of the engaged agents, when speaking of the relation of that agent to those elements. Obviously, (1) is not problematic, unless we want to go down the rabbit hole of all events having multiple causes. In your opening sentences, you… Read more »

Paul E
Paul E
5 years ago

FWIW, this season, Jacob deGrom has more “pWAR” than actual Wins. No one, apparently, has ever had at least 7 wins and had pWAR greater than Wins……IF I ran the PI correctly

e pluribus munu
e pluribus munu
5 years ago

Just because I think a site like HHS should note it: Babe Ruth died 70 years ago today.

no statistician but
no statistician but
5 years ago

Doom:

Is there any chance that you and/or Doug could shrink the window for us duffers by listing, say, the career result for pitchers currently in the HOF using your new WAR metric vs. the traditional one? That might help illustrate how they differ. Additional critical stats—since they are both cumulative measures—of W-L, innings pitched, ERA+,and you name it—would be helpful for comparison, but not the whole boatload, unless that’s actually easier on your end.

e pluribus munu
e pluribus munu
5 years ago

Given my discussion with Doom about the uses of nWAR, I thought I’d explore in detail an interesting case, using game logs (just as nsb initially did). I thought Carlton in 1972 would be good to choose, since Doom already raised it. Carlton went 27-10 for the last place Phillies, a .378 team, worst in the NL. How good would he have been with an average club? Doom did the math, and nWAR gives the answer as 29.5-9, so either 29-9 or 30-9. Doom points out this may seem less than we’d expect, given the raw W-L and the quality… Read more »

no statistician but
no statistician but
5 years ago

I have no credentials that make me an expert in group psychology, but I won’t let that stop me from observing that if I were a position player on a really hangdog team that had one outstanding hurler who gave the team a far better chance against the likelihood of losing when he took the mound, I would probably consciously, and almost certainly unconsciously, be upping my game and feeling more confident when he toed the rubber. In other words, part of the reason why Carlton’s teammates played better when he was pitching was because he was pitching. It’s a… Read more »

e pluribus munu
e pluribus munu
5 years ago

nsb, Like a set of Russian wooden dolls, your approach tries to open up the “why” within my analysis that tries to open up the “why” within Doom’s nWAR finding. You may well be right. Everything you write makes sense. But in ’73, the Phillies R/G rate was a below-average 3.96, behind Carlton it was 3.62. Of course, Carlton ’73 wasn’t Carlton ’72, but he could have come closer with good team support (I’m not planning to devote another day to error counts while my computer thinks big thoughts about whether it’s a propitious moment to connect up). And naturally… Read more »

no statistician but
no statistician but
5 years ago

epm: First off, I was merely suggesting a possible and reasonable explanation that would fit the discrepancy you highlighted, based on some common sense and personal experience. One thing I insist on—to the point, I’m sure, of irritating the heck out of people—is that the map is not the territory, especially in human experience. As to the difference between the 1972 and ’73 seasons, a possible or partial reason for the change could be that Carlton was simply terrible in a huge number of games in the first half of ’73, so that element of hope no longer existed. And… Read more »

e pluribus munu
e pluribus munu
5 years ago

Well, you’ll get no argument from me on any of these statements, nsb. I took your original statement to be a thought experiment, and it was easy to confirm its plausibility and common sense. I believe state of mind has a lot to do with individual and team performance. My response was meant to point out what you probably intended to convey by your initial disclaimer: that an explanation that is plausible and intuitive is not necessarily right.

Dr. Doom
Dr. Doom
5 years ago

nsb, I think epm is spot-on here, in that the problem with the, “They hit better behind him,” argument can go either way. Just as easily, you COULD make an argument for, say, Bob Gibson in 1968, “Well, yes; the Cardinals took it easy those days, knowing that they didn’t have to hit as well since Gibson was SO good and it might only take 1 run to win.” The problem with those arguments is that players seem to react in a way that matches the argument people are making about the pitcher, to the extent that you can’t predict… Read more »

Mike L
Mike L
5 years ago

Interesting theory. I wonder whether the opposite might also be true—whether the “snake-bit” pitcher helps create his own doom. I remember when Anthony Young was on his horrific run in 1992/3. In 1993 he gave up 42 ER in 100.1 IP and had an ERA+ of 107, but another 20 Unearned Runs. Earned or not runs lead to losing

CursedClevelander
CursedClevelander
5 years ago

“Oh, those bases on balls!” was a Frankie Frisch-ism.

e pluribus munu
e pluribus munu
5 years ago

Perhaps, but there are multiple stories that connect the complaint with George Stallings (explaining to a doctor why he had heart trouble; on his deathbed to a friend who asked what was wrong; etc.). Stallings had an exceptional record as a manager of teams that walked on offense and avoided walks on defense.

e pluribus munu
e pluribus munu
5 years ago

Good grief! I wrote my last comment from memory, and when I Googled (and found lots of references to both Frisch and Stallings) I discovered we actually had this conversation on HHS five years ago — the quote being initially attribute by John Autin to his Dad! Well, it’s fitting. That string included JA and Jim Bouldin, who used to get into the issue of luck/chance with such ferocity that it wound up driving Jim off the site. And here we are once again, with Doom and me going at it while we worry about those bases on balls .… Read more »

e pluribus munu
e pluribus munu
5 years ago

Here’s an example of a case that I assume we all know where aggregate figures are deeply misleading, and nWAR is pulled into the same trap: John Smoltz 2002. The example is an outlier, and is all about outliers, and it just says something we all know: outliers screw up aggregate stats. The fact that nWAR is misleading in this case is not a weakness of nWAR; it’s a weakness of aggregate stats — virtually all of ’em (oddly, excepting things like W-L and Saves, which have their own deep flaws). In the CYA voting, Smoltz, playing a reliever role,… Read more »

mosc
mosc
5 years ago

I agree wholeheartedly. I think we should look at production, and WAR type stats, in three different timeframes. They’re all equally valid and cumulative but they can’t be lumped together. To me, you have some type of player rate stat, some type of accumulated value (which would allow for more than 1 game’s value) and a situational based stat like RE24 to talk about game situation specific production. I don’t think Doom’s talking about anything fundamentally different than any other accumulation stat. It’s still an accumulation stat that should be complemented with a rate based value stat and a situational… Read more »

e pluribus munu
e pluribus munu
5 years ago
Reply to  mosc

I agree fully with your first paragraph, mosc. On tossing out Gagne’s worst game — yeah, it’s a perfectly valid point. I actually did the calculation and wrote it in, but I deleted it. The Smoltz vs. Gagne / CYA vote theme was just a frame I decided to use to help illustrate the major point of outlier distortion in aggregate stats. When I started to add the Gagne forgiveness factor, it just seemed to push the post over from its main theme to the frame issue. I apologize for being unfair to Gagne and treating him like a prop… Read more »

Voomo Zanzibar
Voomo Zanzibar
5 years ago

Useless Stat:

Wade Davis currently has 35 Saves and a 4.99 ERA
Highest ERA with 35+ Saves:

7.11 … Shawn Chacon (yes, also played in Denver (2004))
5.28 … Todd Worrell
5.07 … Joe Borowski (led league with 45 SVs)
4.99 … Davis (active)
4.98 … Jeff Mongomery
4.85 … Jeanmar Gomez
4.81 … Joe Nathan

mosc
mosc
5 years ago

sorry to clutter your post Doom. I want to link to a youtube video, I hope that’s OK: https://www.youtube.com/watch?v=JwMfT2cZGHg So I didn’t know this guy existed until recently but it seems like for years he’s been making some very statistically based content, a lot of it on baseball. Probably should be a member on here. I found this video particularly interesting and wondered if you guys had seen it and had some thoughts. I had a few thoughts: 1) There’s a statistical error in that Bonds did swing and miss on pitches outside of the zone occasionally. I mean, he… Read more »

no statistician but
no statistician but
5 years ago
Reply to  mosc

I don’t have any way to simulate whether or not it was a good idea to walk Bonds intentionally, but here’s some data that to me gives a big clue. Runs scored plus runs batted in minus home runs in 2004, selected players: Bonds—129+101-45=185—BB 232 Abreau—118+105-30=193—BB 127 Cabrera—101+112-33=180—BB 68 Rolen—109+124-34=199—BB 72 Pujols—133+123-46=210—BB 84 Tejada—107+150-34=223—BB 48 Other players who produced 180 or more runs by this formula: Drew, Berkman, Helton, Castilla, Guerrero, Sheffield, Ramirez, Ortiz, Michael Young, A-Rod, Damon, Blalock, Mora, Matsui. If the object is to get runs across the plate, then Bonds, despite his flashy .609 OBP and record… Read more »

e pluribus munu
e pluribus munu
5 years ago

I’d prefer to frame the issue this way, nsb (since the result’s a happier one): The object of the pitcher facing the Giants is to keep runs from crossing the plate. In 2003, with Bonds walking at a 27% rate, the Giants scored 4.69 R/G; in 2004, with Bonds walking at a 38% clip, the Giants scored 5.25 R/G. In both our approaches, there’s be lots more to do before we could know how meaningful our quick choice of stats may have been. My thought, on seeing your list, was that the apparent depression in Bonds’s totals had to be… Read more »

Paul E
Paul E
5 years ago

FWIW, Bonds created 185 runs in 2004 at a 20.21 RC / 27 outs pace……If he received the league-average 4 IBB’s and swung away at a .362 batting clip and slugged the same .812 in those extra 116 AB’s, he would create 192 runs but at a less efficient 16.94 RC/27 . Which, IMO, kind of proves the superiority of pitching to the guy – even if he’s juiced out of his eyeballs and not missing strikes

e pluribus munu
e pluribus munu
5 years ago
Reply to  Paul E

I always appreciate your use of RC/27, Paul, and this seems a sensible and interesting application of the stat. After a reminder from one of your posts, I go back to consulting RC/27 for awhile, but it hasn’t quite become a habit or intuitively clear for me, and so I lapse again, until your next reminder.

mosc
mosc
5 years ago

maybe I don’t understand RC/27 well enough but it seems situational to me. Clearly you walk bonds with second and third, one out, and nobody on first right? That would just seem impossible to justify relative production. I think it’s also key to point out that pitching to him, he’s still going to walk a lot. You can’t remove the potential of a walk entirely by pitching to him. Your choices really have to be looked at as IBB or his rate stats without IBB. It’s not that simple it’s true (the unintentional walk) but it’s hard to go completely… Read more »

e pluribus munu
e pluribus munu
5 years ago
Reply to  mosc

I’m sure you’re right, mosc. I think Paul, like nsb and me, was just trying to find a quick method to estimate what we might find if we took the time to do this sort of calculation thoroughly.

Paul E
Paul E
5 years ago
Reply to  mosc

Mosc,
right you are….if those 116 IBBs were taken off the board and he walked at his Non-IBB rate, he’d have 36 BBs and, at a .362 clip, and additional 42 base hits . This would raise his ‘projected’ RC/27 in the calculation above to 19.04, and increase his overall runs created to 220.
So, short of mandatory testing, walk him. Yeah, pitch to Pedro Feliz whenever possible

e pluribus munu
e pluribus munu
5 years ago
Reply to  mosc

Interesting stuff, mosc. Very classy video presentation, with cool graphics. Thanks! I do think Jon Bois glossed over some issues to frame his presentation by portraying Bonds as near-superhuman: most obviously, PEDs. When he noted that Mays, Aaron and others who played through the ’60s (including, according to the subtitles, a terrific batter called “well-in-the-cubby,” though McCovey actually played at his ordinary level against Chicago) never came close to an OPS exceeding 1.250, he then put aside the issue of era norms by looking at Bonds’s margin of superiority over other hitters in 2004. Seemed like a dodge to me.… Read more »

mosc
mosc
5 years ago

I’d theorize the “league average” assumed rest of guys in the lineup have a huge impact on what production you would require to deserve a BB in each of the RE24 states. For example if everyone is hitting .500, it’d be pretty hard to deserve a walk because the guys behind you is likely to make you pay. Gut feel is the .500 batting average if that became a league wide number would have such astronomical R/G scores that no individual player would be approached any differently at all, it’d be REALLY hard to be that far from average in… Read more »

e pluribus munu
e pluribus munu
5 years ago
Reply to  mosc

mosc, I think it’s hard to say that McCovey should have had more IBBs in 1969. His 45 IBBs broke the record of 33 by more than a third, and was only the second season of 30+ IBBs. It wasn’t till Bonds that anyone even approached McCovey’s IBB levels. I guess you’re applying to ’69 an analysis derived from metrics that weren’t developed until decades later. I’m not sure I follow the succession of issues in your last paragraph, but I’m pretty sure that, as a business and spectator sport, it can’t be naive to take into consideration what makes… Read more »

mosc
mosc
5 years ago

Going back to your three true outcomes comment, the relative value of a walk depends heavily on the average production of a lineup. If the average BA was exceedingly low, walking guys would not be particularly costly. In other words the more offensive an era, the more valuable a walk would be. People who don’t like three true outcome baseball should root for a higher runs coring environment. In that environment, walks are more valuable and pitchers would avoid them more. Hitters would also have less incentive to swing away vs avoid the out. Basically backwards from the actual complaints,… Read more »

e pluribus munu
e pluribus munu
5 years ago
Reply to  mosc

I don’t know, mosc. Average BA doesn’t seem to me to be the key issue: it’s the BA and SA of the hitter(s) following the BB target. I think the calculation on the IBB has to do with the likelihood of subsequent hitters making outs and of their hits advancing runners multiple bases. What players further down in the order do has increasingly less bearing on the decision. (As far as actual behavior goes, note that in 1968 the IBB rate was almost twice what it was last year.) More basically, I don’t think the complaint about TTO-weighted games is… Read more »

e pluribus munu
e pluribus munu
5 years ago

There’s a new article on FiveThirtyEight.com that seems to me to illustrate in interesting ways the TTO direction we’re seeing in MLB now. It’s an analysis of the hitting approach that has turned Franciso Lindor and Jose Ramirez into HR hitters. These are exciting players with lots of elements in their games, but the implications of the article are that we may be looking forward to a lot more short HRs down the line by players who would traditionally have been BiP-oriented, as the approach that Cleveland has taken with these two relatively small infielders catches on. No need to… Read more »

trackback

[…] season of the 1980s, behind only Doc Gooden’s legendary 1985. (For those who remember my model for estimating pitcher W-L records, Carlton nails his right on the head in ’80.) Carlton and Mario Soto became the 24th and 25th […]