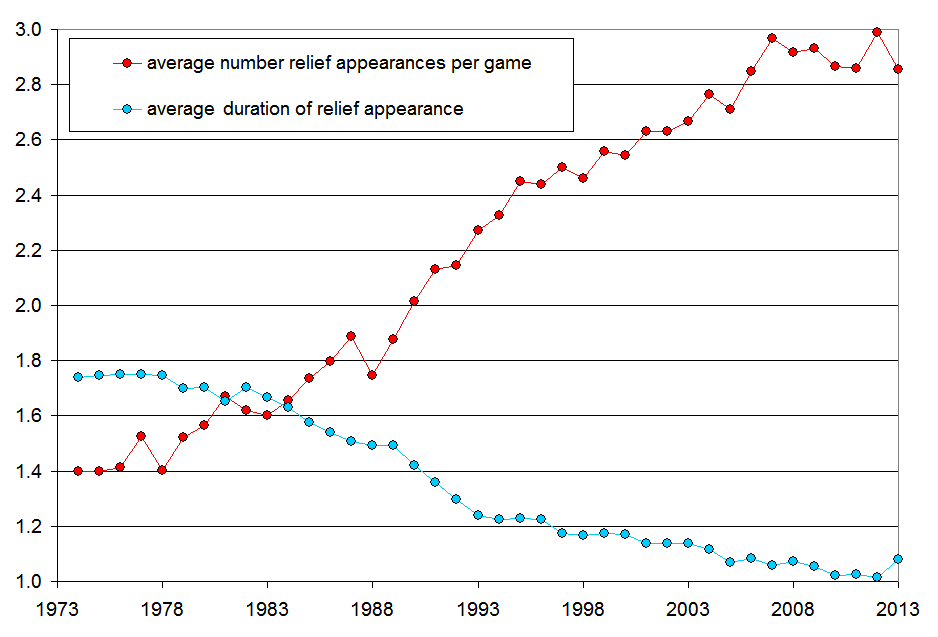
Interesting trend reversal (at least so far) in 2013.

Interesting trend reversal (at least so far) in 2013.
Here’s something I’ve never understood:
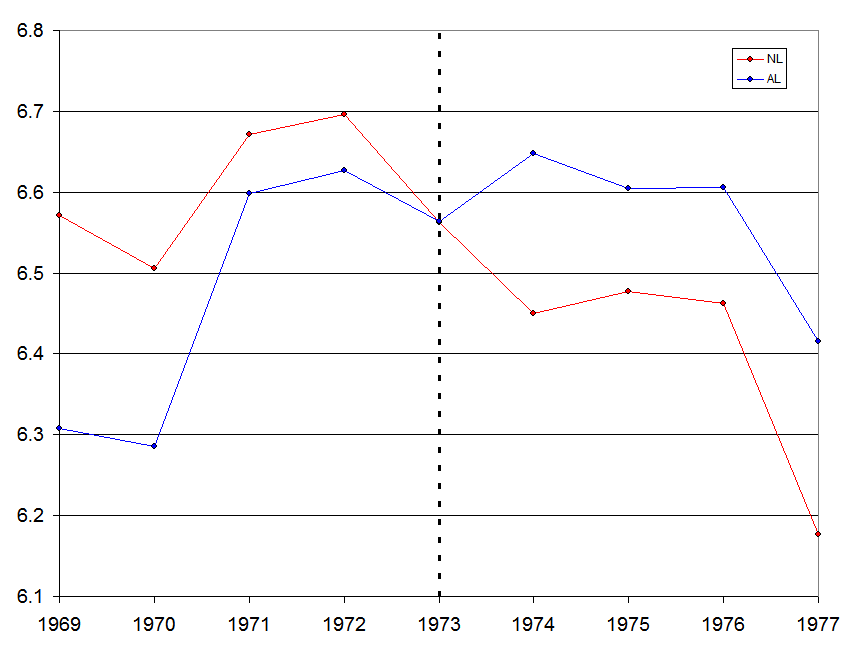
This is the average innings pitched by the starting pitcher, by year, broken down by leagues.
There are at least two things about this plot that make no sense to me. Click through for more.
Here’s a plot showing the percentage of balls in play each year. Specifically, this refers to the fraction of plate appearances that result in a ball being handled by the defense.
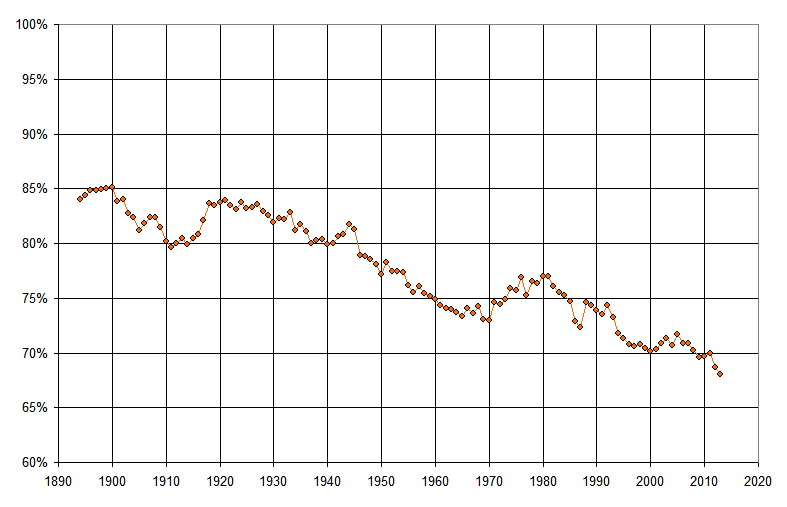
The formula uses at-bats in the numerator, subtracting out home runs and strikeouts, and adding sacrifice hits and sacrifice flies. That total is then divided by plate appearances, which of course includes walks and hit-by-pitch.
As you can see, 2013 is on pace to have the lowest percentage of balls put in play in MLB history. And even though 2013 is far from over and could change, 2012 itself set the all-time record, at just 68.7%.
The two biggest factors are, of course, home runs and strikeouts. Even in this year of very low offense, home runs are still quite high. I wrote about that in my USA Today Sports Weekly piece this week. Strikeouts continue to go higher and higher, and drive the percentage of balls in play lower and lower.
Some comments and implications about the above graph:
The game is changing, for sure…
We’ve been discussing just how commons shutouts have been in recent years, particularly in 2013 so far. Here’s a little bit of a look at the numbers.
This week’s Sports Weekly piece by High Heat Stats was written by our own Adam Darowski. You can read it online here:
http://www.usatoday.com/story/sports/mlb/2013/04/17/team-defense-plays-large-role-in-era/2091049/
As you can see from the URL, it’s about the role that team defense plays in a pitcher’s ERA.
Through last night, just about every team has played 12 games so far this season, and we’ve already had 36 shutouts in 2013. With 358 total games having been played so far, that’s 10% of games ending in a shutout.
By comparison, in all of 2012, there were 310 shutouts in 4860 games, just 6.4%. And in the first 12 games of the season for each team, there were 24 shutouts out of 36o games (6.7%).
Going back as far as we’ve had 30 teams, here are the number of shutouts within the first 12 games for each team:
2013: 36
2012: 24
2011: 20
2010: 17
2009: 22
2008: 23
2007: 18
2006: 15
2005: 20
2004: 17
2003: 26
2002: 23
2001: 16
2000: 16
1999: 15
1998: 20
1997: 15
So, the most shutouts in the first 12 games of any season from 1997 to 2012 was 26, and this year we have 36. Over those previous 16 years, there were 19.2 shutouts on average, and this year we have close to double that…
If you subscribe to USA Today Sports Weekly (which grew from Baseball Weekly) or buy it in your local news stand, you may have noticed that High Heat Stats is now a contributor:
This week’s piece is about high-leverage RBI as a fraction of a player’s total RBI, and shows how much better Prince Fielder was than Miguel Cabrera, and why the Angels might be in trouble.
Please pick up a copy locally if you’re not already a subscriber!
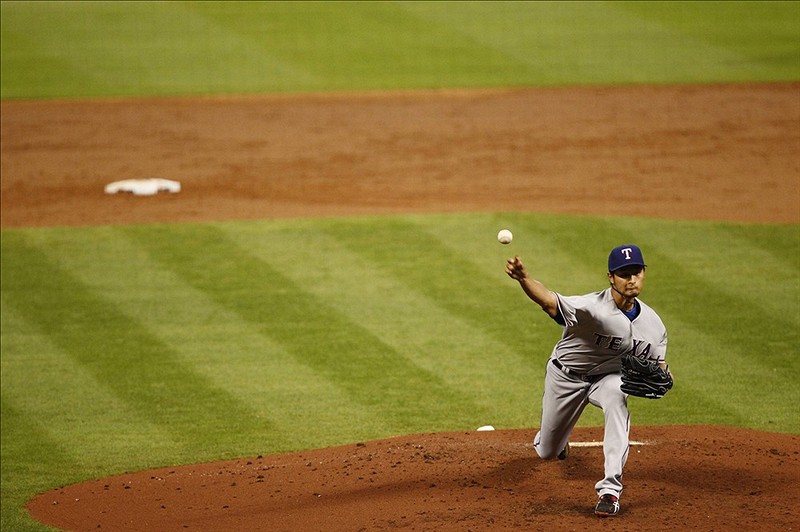
Here are some quick thoughts on Yu Darvish’s near-perfecto last night.
Thomas Campbell-USA TODAY Sports
Justin Maxwell / Brett Davis-USA TODAY Sports
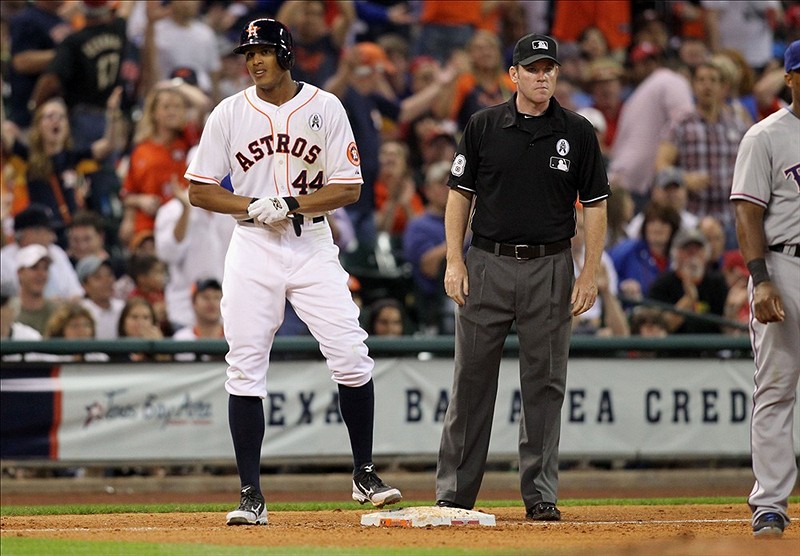
There’s Justin Maxwell, standing on third base after tripling, as he did twice last night. Here are the only other guys since 1916 to hit two triples on Opening Day:
| Rk | Player | Date | Tm | Opp | Rslt | PA | AB | R | H | 2B | 3B | HR | RBI |
|---|---|---|---|---|---|---|---|---|---|---|---|---|---|
| 1 | Tony Pena | 2007-04-02 | KCR | BOS | W 7-1 | 4 | 3 | 2 | 2 | 0 | 2 | 0 | 1 |
| 2 | Tommy Henrich | 1950-04-18 | NYY | BOS | W 15-10 | 6 | 6 | 2 | 2 | 0 | 2 | 0 | 1 |
| 3 | Arky Vaughan | 1941-04-15 | PIT | CHC | L 4-7 | 5 | 5 | 1 | 2 | 0 | 2 | 0 | 1 |
| 4 | Bubbles Hargrave | 1924-04-15 | CIN | PIT | W 6-5 | 4 | 4 | 2 | 4 | 0 | 2 | 0 | 0 |
| 5 | Tillie Walker | 1917-04-11 | BOS | NYY | W 10-3 | 5 | 5 | 0 | 3 | 1 | 2 | 0 | 4 |
Tillie Walker didn’t score after either triple, but he did drive in 4.
Rick Ankiel hit a pinch 3-run homer. Although this is also a pretty rare Opening Day feat, George Kottaras did it last year for the Brewers.
Since 1916, he’s only the 11th player to hit a 3-run pinch-HR (or grand slam) on Opening Day:
| Rk | Player | Date | Tm | Opp | Rslt | PA | AB | R | H | 2B | 3B | HR | RBI | BB | SO | WPA | BOP |
|---|---|---|---|---|---|---|---|---|---|---|---|---|---|---|---|---|---|
| 1 | George Kottaras | 2012-04-06 | MIL | STL | L 5-11 | 1 | 1 | 1 | 1 | 0 | 0 | 1 | 3 | 0 | 0 | 0.000 | 9 |
| 2 | Mendy Lopez | 2004-04-05 | KCR | CHW | W 9-7 | 1 | 1 | 1 | 1 | 0 | 0 | 1 | 3 | 0 | 0 | 0.443 | 9 |
| 3 | Mark Sweeney | 1999-04-05 | CIN | SFG | L 8-11 | 1 | 1 | 1 | 1 | 0 | 0 | 1 | 3 | 0 | 0 | 0.204 | 9 |
| 4 | Geno Petralli | 1992-04-06 | TEX | SEA | W 12-10 | 1 | 1 | 1 | 1 | 0 | 0 | 1 | 3 | 0 | 0 | 0.589 | 1 |
| 5 | Terry Whitfield | 1984-04-03 | LAD | STL | L 7-11 | 4 | 2 | 1 | 1 | 0 | 0 | 1 | 3 | 2 | 0 | 0.120 | 6 |
| 6 | Bobby Murcer | 1981-04-09 | NYY | TEX | W 10-3 | 1 | 1 | 1 | 1 | 0 | 0 | 1 | 4 | 0 | 0 | 0.029 | 8 |
| 7 | Norm Miller | 1970-04-07 | HOU | SFG | W 8-5 | 2 | 1 | 1 | 1 | 0 | 0 | 1 | 3 | 1 | 0 | 0.451 | 9 |
| 8 | Duffy Dyer | 1969-04-08 | NYM | MON | L 10-11 | 1 | 1 | 1 | 1 | 0 | 0 | 1 | 3 | 0 | 0 | 0.030 | 8 |
| 9 | Charlie Maxwell | 1959-04-10 | DET | CHW | L 7-9 | 1 | 1 | 1 | 1 | 0 | 0 | 1 | 3 | 0 | 0 | 0.442 | 8 |
| 10 | Frank Welch | 1925-04-14 | PHA | BOS | W 9-8 | 1 | 1 | 1 | 1 | 0 | 0 | 1 | 3 | 0 | 0 | 0.000 | 2 |
These were all 3-run shots, save Bobby Murcer’s pinch homer, which was of the bases-full variety. Note there may be other players who entered as a pinch-hitter and amassed 3 RBI over more than 1 plate appearance, but these are the only guys to get at least 3 RBI on the homer.
Erik Bedard got a save the easy way, pitching 3+ innings in a game that was pretty much out of reach. He’s the first guy to get an Opening Day save while pitching at least 3 innings in a long time:
| Rk | Player | Date | Tm | Opp | Rslt | App,Dec | IP | H | R | ER | BB | SO | HR |
|---|---|---|---|---|---|---|---|---|---|---|---|---|---|
| 1 | Terry Adams | 2000-04-03 | LAD | MON | W 10-4 | 7-9f ,S | 3.0 | 2 | 1 | 1 | 1 | 1 | 1 |
| 2 | Kevin Jarvis | 1997-04-01 | CIN | COL | W 11-4 | 7-9f ,S | 3.0 | 2 | 0 | 0 | 2 | 5 | 0 |
| 3 | Mike Perez | 1995-04-26 | CHC | CIN | W 7-1 | 7-9f ,S | 3.0 | 2 | 1 | 1 | 0 | 1 | 1 |
| 4 | Terry Leach | 1993-04-06 | CHW | MIN | W 10-5 | 7-9f ,S | 3.0 | 2 | 1 | 1 | 0 | 0 | 0 |
| 5 | Wilson Alvarez | 1992-04-07 | CHW | CAL | W 10-4 | 7-9f ,S | 3.0 | 0 | 0 | 0 | 0 | 2 | 0 |
| 6 | Jeff Robinson | 1988-04-05 | PIT | PHI | W 5-3 | 6-9f ,S | 3.2 | 2 | 1 | 1 | 0 | 4 | 1 |
| 7 | Bill Dawley | 1987-04-07 | STL | CHC | W 9-3 | 6-9f ,S | 4.0 | 1 | 0 | 0 | 0 | 3 | 0 |
| 8 | Mark Davis | 1986-04-08 | SFG | HOU | W 8-3 | 7-9f ,S | 3.0 | 0 | 0 | 0 | 0 | 1 | 0 |
| 9 | Ron Robinson | 1986-04-07 | CIN | PHI | W 7-4 | 6-9f ,S | 3.1 | 1 | 0 | 0 | 0 | 2 | 0 |
| 10 | Bruce Sutter | 1984-04-03 | STL | LAD | W 11-7 | 7-9f ,S | 3.0 | 0 | 0 | 0 | 2 | 0 | 0 |
Before Sutter in 1984, as you would guess, it was done quite often.
The Astros played their first game as an AL team 15 years to the day after the Brewers played their first game as an NL team. In that game, Bob Wickman took the loss in the 9th as Kerry Ligtenberg won despite walking 4 while recording only 4 outs. I would love it if somebody could find a link between these two games–maybe a guy who coached in one but played in the other?
I’m very, very sorry to announce the High Heat Stats Player Quiz, as whatever free time you had is about to be sucked up.
This quiz is totally free (at some point you might have to watch a video ad when you begin a new session).
To learn more about the quiz, go to the quiz page. Note that you can reach this page from the button on the navigation bar at the top saying “Player Quiz”. From there, there’s a link to launch the actual quiz.
Thanks to Sean Lahman for the use of his database, and to Aaron M. for coding this to my specifications.
Go crazy, folks!