I would like to hire someone who is handy with WordPress for a couple of hours to update my installation of WordPress and do a few other things. Please email me if interested. I’ll pay $50/hr.
Author Archives: Andy
Happy birthday to us!
High Heat Stats turns one year old today!
This blog, on highheatstats.com, has been around since February, but I first opened our temporary home on Blogger 1 year ago today.
I just wanted to say thanks to all of our great readers and writers for making this such a great place.
Also, here’s a little more info on the project I’m working on. I mentioned before that something big is brewing. I told you that some of our writers will be involved. I have also commissioned several artists to produce original artwork, and this artwork is a key part of what we’re doing–meaning it’s NOT that I’m just getting a few book illustrations. I can also share that the final product of this effort will be something physical, as opposed to an e-book, web site, or other electronic medium.
All will be revealed in the first week of December when we launch a major campaign around this project.
Top ten part-time batter seasons from the last 30 years
Here’s an interesting set of players–these are guys with at least 20 batting runs, no more than 400 plate appearances, and a ratio between the two of at least 8 batting runs per 100 PAs.
| Rk | Player | PA | Rbat | Year | Tm | G | AB | R | H | 2B | 3B | HR | RBI | Pos | ||||
|---|---|---|---|---|---|---|---|---|---|---|---|---|---|---|---|---|---|---|
| 1 | Kevin Mitchell | 380 | 36 | 1994 | CIN | 95 | 310 | 57 | 101 | 18 | 1 | 30 | 77 | .326 | .429 | .681 | 1.110 | *7/3 |
| 2 | Justin Morneau | 348 | 34 | 2010 | MIN | 81 | 296 | 53 | 102 | 25 | 1 | 18 | 56 | .345 | .437 | .618 | 1.055 | *3/D |
| 3 | Jim Thome | 340 | 32 | 2010 | MIN | 108 | 276 | 48 | 78 | 16 | 2 | 25 | 59 | .283 | .412 | .627 | 1.039 | *D |
| 4 | Hubie Brooks | 338 | 28 | 1986 | MON | 80 | 306 | 50 | 104 | 18 | 5 | 14 | 58 | .340 | .388 | .569 | .956 | *6 |
| 5 | Mark McGwire | 321 | 39 | 2000 | STL | 89 | 236 | 60 | 72 | 8 | 0 | 32 | 73 | .305 | .483 | .746 | 1.229 | *3/467 |
| 6 | Matt Williams | 318 | 30 | 1995 | SFG | 76 | 283 | 53 | 95 | 17 | 1 | 23 | 65 | .336 | .399 | .647 | 1.046 | *5 |
| 7 | Gary Sheffield | 274 | 26 | 1995 | FLA | 63 | 213 | 46 | 69 | 8 | 0 | 16 | 46 | .324 | .467 | .587 | 1.054 | *9/7 |
| 8 | Jack Clark | 249 | 22 | 1984 | SFG | 57 | 203 | 33 | 65 | 9 | 1 | 11 | 44 | .320 | .434 | .537 | .971 | *9/3 |
| 9 | Johnny Grubb | 243 | 20 | 1986 | DET | 81 | 210 | 32 | 70 | 13 | 1 | 13 | 51 | .333 | .412 | .590 | 1.002 | *D79 |
| 10 | Frank Thomas | 240 | 20 | 1990 | CHW | 60 | 191 | 39 | 63 | 11 | 3 | 7 | 31 | .330 | .454 | .529 | .983 | *3/D |
Pretty interesting, huh?
A few random notes:
- It’s awesome to see two members of the 2010 Twins on the same list.
- Kevin Mitchell (1994), Matt Williams (1995), and Gary Sheffield (1995) all did it in strike-shortened seasons.
- Johnny Grubb rarely played full-time. After his Age 27 season, he had 10 years where he didn’t top 400 plate appearances, and only 1 where he did. The guy finished with a 121 OPS+ in his career.
- Hubie Brooks put up his best season (rate-wise, at least) in 1986, posting a 161 OPS+ despite a career mark of 100.
Quick notes on Raul Ibanez’s epic game
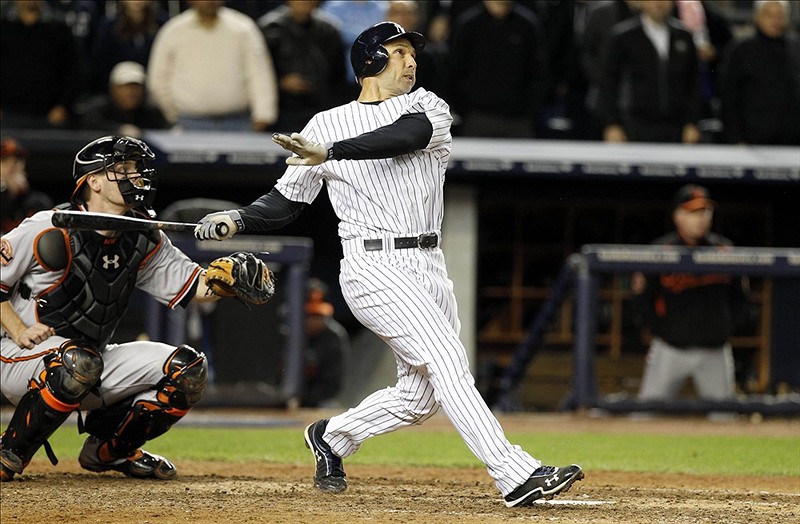
I don’t have time to write a proper post, but here are some quick notes on last night’s performance by the man Lou Piniella used to call “Rawl EYE-buh-nez”.
- His 2-homer game carried the 5th-highest Win Probability Added in playoff history.
- It was the 2nd-highest WPA by a non-starter (behind you-know-who)
- It was only the 5th playoff game in history where a non-starter had 2 extra-base hits. He’s the only guy to have both be homers. Amazingly, also yesterday was the 4th such game, a few hours beforehand, when Joaquin Arias came in as a sub and hit two doubles.
- Ibanez has had only 2 regular season games with greater WPA. Number 1 on that list is a game from a few weeks ago where he also entered as a pinch-hitter and ended up with 2 homers.
- Ibanez had another pinch-hit game-tying 9th-inning homer against the Red Sox less than 2 weeks ago.
- And courtesy of our friend Sean Forman at Sports-Reference, Alex Rodriguez is the greatest player to ever be removed for a pinch-hitter in a clutch post-season moment.
Behind the scenes at High Heat Stats
I just wanted to give a little info on why I haven’t posted much lately. I am working behind-the-scenes on a colossal High Heat Stats project. Ever since Sky Kalkman and Marc Normandin put out The Hall of Nearly Great, I have been carefully considering how best to leverage the collective talents of our community here to create a product that would be greatly satisfying to a wide baseball audience and also generate a small chunk of revenue we can use to further upgrade this blog. (My idea of upgrading includes paying our writers, making the server even faster, and adding more features.)
Anyway, after the better part of a year of laying out ideas, scrapping them, and reforming them, I’ve finally come upon a winning formula. Adam deserves a lot of thanks for that by enduring many open-ended questions and posits from me and playing a key role in developing the framework.
So, the big idea is….well, you’re going to have to wait for that. (Sorry!) I’ll release more information around Thanksgiving. For now I’ll just say this much:
– A lot of baseball talent is going to be involved in this project, including numerous folks who have never contributed to HHS before (although many of our existing writers will be involved too and just don’t know it yet)
– Everybody involved with HHS, including our readers (even lurkers) will have an opportunity to get involved early and contribute to the shaping of this big project.
If things go as planned, HHS is going to new places. I look forward to seeing you all along for the ride!
More to come late next month…
Ryan Vogelsong’s statistically odd 2011 and 2012

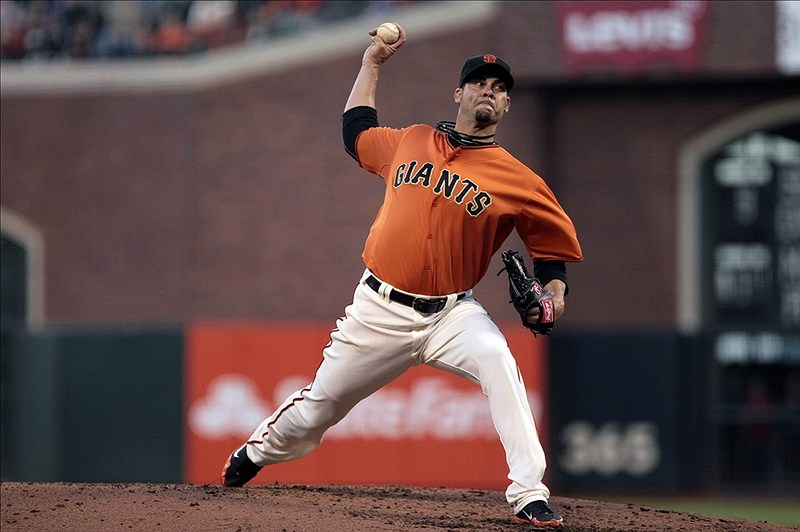
Ryan Vogelsong / USPRESSWIRE
Check out some of Ryan Vogelsong’s stats in 2011 and 2012:
Stat     2011     2012
G         30       30
IP       179.2    184.2
H        164      169
HR        15       17
BB        61       61
SO       139      151
WHIP       1.25     1.24
The numbers above are, for all intents and purposes, identical. But there’s one big difference: in 2011, he allowed 54 earned runs, whereas in 2012 he’s allowed 71. Those translate into seasonal ERAs of 2.71 (2011) and 3.46 (2012), and ERA+s of 129 in 2011 and 101 in 2012.
Why has a guy who has seemingly performed exactly the same on the mound allowed such different amounts of earned runs?
Let’s dig in to find out… Continue reading
Going the way of the dodo: Complete-game losses
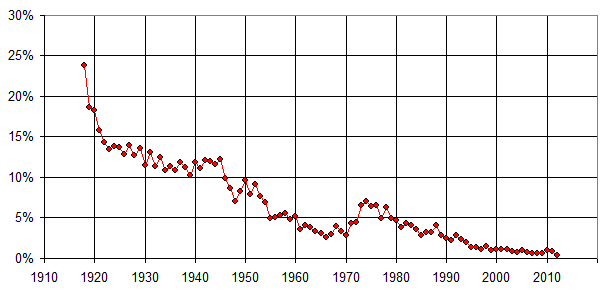
Pick any 2012 MLB team. There’s just about a 50-50 chance that that team has a pitcher with a complete-game loss this year. Behold the percentage of all starts that have ended in a CG-loss:

Back in 1918, nearly a quarter of all starts ended in CG losses. That’s because most starts were completed, and a lot of those were on the losing side. It was fairly unusual for a pitcher to get lifted at all.
In 2012, though, the percentage has fallen all the way down to 0.4%, meaning that only about 1 out of every 250 starts ended in a complete game loss. This is the lowest rate in major-league history, even after a bump up in the rate in 2010 and 2011.
One reason why CG losses are so rare is, of course, because complete games themselves are so rare. Only about 3% of all 2012 starts have ended as complete games, just about the lowest rate in history. In 1918, 63% of all starts turned into CGs.
These days, managers follow a pretty strict strategy will bullpens. It’s obvious when they’re ahead–a middle-relief guy in the 7th if needed, then then 8th inning setup guy and the closer for the 9th. But when they are behind, they are just as likely to bring in a middle reliever either mid-inning to try to stem the tide of a rally, or to start the 6th or 7th to prevent a new rally from starting.
Anyway, whenever you see a complete game loss, try to appreciate it. Soon, like the dodo, it may be extinct.
The first of many strikeout records
ESPN.com reported that the Rays set the AL single-season record for staff strikeouts last night. The previous record was 1,266 by the 2001 Yankees and after last night the Rays’ team total was 1,275.
Strikeouts across MLB have increased at a ridiculous rate. In 2011, the MLB average was a record 7.1 strikeouts per 9 innings. That was an all-time record. This year? It’s 7.5 per 9.
Calculating out to another significant digit, 2012’s number is 7.54 K/9. In 2011, it was 7.13. That’s a 5.8% increase over what was already a record number–and there are no obvious rules or game changes that would account for it.
To put it in further perspective, the 2012 Rays broke the season record despite having 11 games–6.8%–of their season left to play. They are on pace to finish with 1,367 strikeouts, which would break the old record by 8%. That’s as crazy as Mark McGwire hitting 70 homers to break the previous record of 61.
Want a little bit more? In addition to the Rays, this year’s staffs on the Tigers and Yankees are also on pace to break the 2001 record, and the Rangers’ is on pace to tie it. That’s 4 out of 14 AL teams on pace to tie or break the record.
It’s a dramatic shift, folks. The big questions are–how much further will strikeouts increase in the coming years and how will it change the game?
Which player has the more impressive 200-hit seasons…Derek Jeter or Lou Gehrig?
As was widely reported last night, Derek Jeter has tied Lou Gehrig with the most 200-hit seasons by a Yankee. Each fellow now has 8 such seasons.
I got in a little Twitter debate last night about which guy has been more impressive in those 8 years.
(Jeter lovers, please read the very last sentence at the bottom before you leave a nasty comment.)
High Heat Stats is kicking ass
Is it just me, or has this blog been on fire? Both the new and established writers are cranking it up and hitting triple digits on the radar gun.
Just a friendly reminder that you can help us out by hitting the “like” button on the Facebook ap down on the sidebar and by following me and the other writers on Twitter (you can find everybody’s Twitter handle on the ‘About’ page linked at the top.)
We have another surprise in the works–I won’t say too much other than that it takes advantage of one of the special talents of someone on our writing staff.

