Reliving the hits: how hit distribution has changed in MLB history

Here’s a pretty simple graph showing the breakdown each year of hits distribution.

hitpercentage


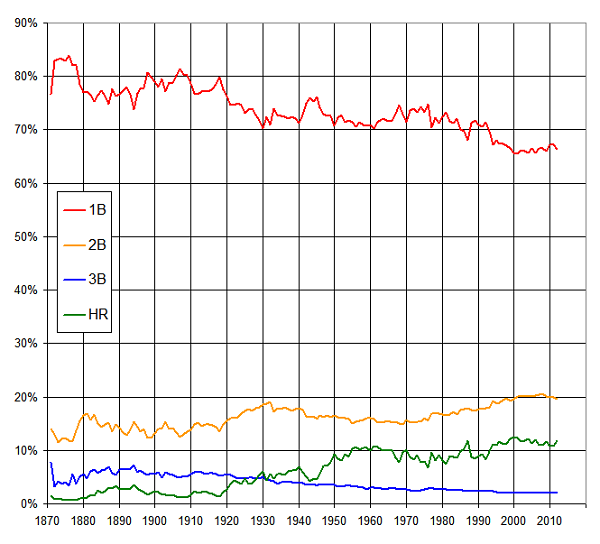
So, for any given year, this shows the percentage of total hits for that year that were singles, doubles, triples, or homers.

Some observations / conclusions:

  • Singles have, understandably, fallen off considerably. At the dawn of the game, they represented more than 80% of all hits but in recent years have been right around two-thirds. 2012’s percentage of 66.4 is among the lowest ever–just slightly above figures between 65 and 66 in the 2000’s.
  • Triples increased in the 1880s and 1890s but have declined pretty steadily since except for renaissances in the 1910s and 1970s. The rate has hovered right around 2% for several years now.
  • Doubles are quite interesting. You might have expected that they peaked in the late 1990s or early 200s (like homers) but their two peak seasons are actually 2007 and 2008, at 20.4% and 20.5% respectively. Doubles are off a bit in the last couple of years, probably largely because home runs have spiked again.
  • Homers took a huge upward turn when Babe Ruth came on the scene, then took subsequent big jumps in the 1940s and the 1990s. They peaked in 2000 at 12.6%, fell as low as 10.8% in 2011 but rebounded last year to 11.8%.
  • 1987 shows up again as a really fluke year. Home runs spiked up that year (then back down in 1988) and singles spiked way down (and then back up in 1988).

I wonder what singles will look like 50 years from now. The decline has been remarkably linear so far, losing just about 8/10ths of a percentage point each decade. I’m sure that rate will slow, or else singles will account for fewer than half of all hits by about the year 2206. (Although this is an accurate projection from the data, rest assured that my tongue is planted firmly in my cheek right now.)

Pitchers Who Bested Barry Bonds

I’ve been staring at my computer for hours, trying to figure out a poetic way to summarize Barry Bonds‘ career. In between bouts of writer’s block, I’ve gawked at his career stats so many times that I’ve memorized them: a batting line of .298/.444/.607, 762 home runs, 688 intentional walks, 514 stolen bases, a 158.1 bWAR.

Bonds is undoubtedly one of the game’s most powerful and feared hitters. Over 22 seasons, 1,224 pitchers helped pave his path to Cooperstown, and I can’t help but wonder how many of those received even a modicum of success against his 1.051 OPS and .435 wOBA.

Continue reading

One and done: the best players to fall off the Hall of Fame ballot after their 1st year of eligibility

Kenny Lofton / Kelley L Cox-USA TODAY Sports

Kenny Lofton / Kelley L Cox-USA TODAY Sports

With Kenny Lofton receiving a miserable 3.2% of the vote in yesterday’s Hall of Fame balloting, he’s gone from future consideration despite 6 All-Star appearances, 4 Gold Gloves, and 64.9 career WAR (greater than the totals of more than 50 players already enshrined.)

With a hat tip to @phungo2008 for asking the question, here are the players with the highest career WAR totals who fell off the Hall of Fame ballot in their first year of eligibility:

Lou Whitaker    (71.4 WAR, 2.9% in 2001)
Bill Dahlen     (70.9 WAR, 0.4% in 1938)
Bobby Grich     (67.3 WAR, 2.6% in 1992)
Kenny Lofton    (64.9 WAR, 3.2% in 2013)
Kevin Brown     (64.3 WAR, 2.1% in 2011)
Willie Randolph (63.0 WAR, 1.1% in 1998)
Buddy Bell      (61.6 WAR, 1.7% in 1995)
Reggie Smith    (60.8 WAR, 0.7% in 1988)
David Cone      (58.8 WAR, 3.9% in 2009)
Sal Bando       (57.1 WAR, 0.7% in 1987)

A new notes:

  • All of these guys fell off the ballot because they didn’t receive 5% of the vote. There are other players with higher WAR totals, such as Ken Boyer and Wes Ferrell, who received less than 5% in their 1st year but didn’t fall off the ballot because the rules were different.
  • There are a bunch of 19th-century players, Jim McCormick chief among them, who have enough WAR to qualify but were never listed on any HOF ballot.
  • And of course, Pete Rose and Shoeless Joe Jackson would make this top 10 but also have never appeared on any HOF ballot.

Beating a Dead Horse

What hasn’t been written about the 2013 Hall of Fame ballot? You’ve got the law and order folks keeping out Barry Bonds and Roger Clemens, the traditionalists putting in Jack Morris and Dale Murphy, and those of questionable sanity voting for Sandy Alomar, Jr. And let’s not forget the blank ballots. On second thought, let’s try to. That being said, everyone has a voice, regardless of whether or not they are a part of the BBWAA.

That’s where I come in. Player-by-player analysis and commentary after the jump.

Continue reading

1918 Box Score Review

September 2, 1918 — Senators 8, Athletics 3

There is a sort-of point to this one, believe it or not. It started with a search for the lowest team-leading home run total. Result: Three teams in modern history were led by players with exactly one home run. They are the White Sox of 1908 and ’09 — the tail end of the “Hitless Wonders,” who shocked the mighty Cubs in the 1906 World Series — and the 1918 Senators, on whom we’ll focus.

Continue reading

Quiz – Jeff Cirillo (new follow-up quiz added)

Jeff Cirillo is a true throwback player, the only player in the expansion era with an unusual batting feat, accomplished since 1935 only by these hitters. What is this now rare seasonal feat?

Player
Jeff Cirillo
Ted Williams
Jackie Robinson
Joe DiMaggio
Lou Gehrig
Zeke Bonura
Luke Appling
Charlie Gehringer
Gus Suhr
Joe Medwick

Hint: from 1920 to 1934, this feat was accomplished a total of 30 times by 20 different players.

Congratulations to Artie Z! He correctly identified the players in the quiz as those since 1935 to have one or more seasons driving in teammates and being driven in by them 100 or more times each. That is, R – HR and RBI – HR are both 100 or more. Jeff Cirillo, with 11 HR, 111 Runs and 115 RBI in 2000, is the first and only player since 1949 to accomplish this feat. The 43 times this has been done since 1920 are here. The 6 times this was done from 1901 to 1919 are here.

And, congratulations to Richard Chester! He solved the follow-up quiz, identifying Sammy Sosa’s 2001 season as the first and only season since 1949 with Runs plus RBI totaling to 300 or more. Here’s that list.
Continue reading

2012 Box Score Review, Chapter 2

April 8 in Detroit — Tigers 13, Red Sox 12 (11 innings):

In one of the year’s wildest tilts, Detroit rallied twice from death’s door to complete an opening-series sweep. After 4 innings it was tied at 7, with both starters drubbed and departed. Boston forged ahead in the 6th when Adrian Gonzalez punished the first pitch from lefty Daniel Schlereth, and behind Vicente Padilla‘s four scoreless innings, they took a 3-run lead into the 9th. It seemed a routine first save try for the newly anointed closer, Alfredo Aceves.

Continue reading