Messrs. October

A World Series Most Valuable Player has been named each year since 1955, except of course in 1994, when no World Series was held. The World Series MVP originated as an invention of the old Sport magazine (which had developed the entire genre of mass market general sports magazines several years before Time, Inc. began producing Sports Illustrated). The League Championship Series in each league began in 1969, but there were no formal MVPs named for this new round of post-season play until 1977 for the NL and until 1980 for the AL. And there remains today no formal MVP process for earlier rounds of MLB’s post-season.

It may be that the Major League Baseball post-season has now grown so substantial that it is appropriate to treat the post-season as a whole entity deserving its own over-arching Most Valuable Player process. In 2013, for example, there were 38 post-season games, which makes 76 team games, almost half a regular season for an individual team.

There is no Wins Above Replacement for the post-season; the nature of post-season play isn’t really amenable to the kind of calculations that go into WAR. But we do have Win Probability Added (WPA) numbers for the post-season. Indeed, because we have play-by-play records for every post-season game from the first World Series in 1903 and onwards, we can look at WPA numbers for any and all post-season games back to the earliest post-season games.

Just to give a flavor for how WPA can be applied to help inform the identification of MVP-type candidates for post-season play, I’ll list below in this post some recent post-season WPA leaders. If you need an introduction to Win Probability Added, you can check out glossaries at Fangraphs or Baseball-Reference; but the basic concept is relatively simple. WPA looks at every plate appearance during a game and determines the probability that, as that plate appearance begins, the hitter’s team will win the game, based on the inning, the score, the outs and the men on base. Then WPA determines whether the outcome of that plate appearance increased or decreased the probability of the hitter’s team winning, and by how much. The amount of such change in probability, positive or negative, is assigned to the hitter, and the reverse amount to the pitcher. The change in probability amounts for each hitter’s, and each pitcher’s, plate appearances for the game are added up (netting the positive and negative plate appearance results) and the resulting number is that hitter’s or pitcher’s Win Probability Added for that game. WPA game numbers can then be added for a series, season, career, and so on.

Thinking about recent post-seasons, a few names jump out as leading their teams at critical moments. David Freese in 2011, Raul Ibanez in 2012, Madison Bumgarner in 2014, all seem to jump out as high-value performers of their respective post-seasons. Does Win Probability Added reflect these recollections? Let’s see. Highest WPA totals for the postseason periods in each of the last six years:

2010
Brian Wilson 1.3
Tim Lincecum 1.2
Matt Cain and Cody Ross 1.0

2011
David Freese 1.9
Lance Berkman 1.3
Mike Napoli 1.0
Chris Carpenter 0.9

2012
Raul Ibanez 1.2
Darren O’Day 1.1
Justin Verlander and Marco Scutaro 0.9

2013
Carlos Beltran 1.5
David Ortiz 1.2
Justin Verlander 1.1

2014
Madison Bumgarner 1.7
Eric Hosmer 1.4
Wade Davis 1.1
Alex Gordon, Greg Holland and Yusmeiro Petit 0.9

2015
Wade Davis 1.0
Jose Bautista 0.9
Eric Hosmer and Curtis Grandson 0.8

David Freese’s 2011 World Series Game 6, in which he tripled with two outs to tie the game in the bottom of the ninth inning, to keep the Cardinals alive in the series, and then hit a walk-off homer in the bottom of the 11th to send the series to a seventh game, is the highest single WPA game by a hitter in MLB post-season history. The second-highest is Kirk Gibson’s walk-off pinch-hit homer game in Game 1 of the 1988 World Series, even if Gibson gets no extra WPA credit for hobbling around the bases in that famous home run trot. The highest post-season WPA of all, higher even than Freese’s Game 6, was the epic pitching performance by the precocious 21-year old Boston Red Sox pitcher Babe Ruth, who threw a 14-inning complete game in Game 2 of the 1916 World Series, allowing Boston to defeat Brooklyn 2-1. Although Ruth hit like a typical pitcher that day, going 0 for 5 with two strikeouts and a batter WPA of -.191. Just wasn’t fated to be a big contributor with the bat in the majors, I guess.

At the moment of publication of this post, just before Game 3 of the World Series begins, the leaders in WPA for the 2016 post-season so far have been the Cubs’ starter Jon Lester and the Cleveland relievers Cody Allen and Andrew Miller, all at at WPA of 1.0, and Indians starter Corey Kluber just behind at 0.9. Who ends up as the 2016 WPA post-season MVP remains very much up in the air at the moment. Now I’ll settle in to watch Game 3.

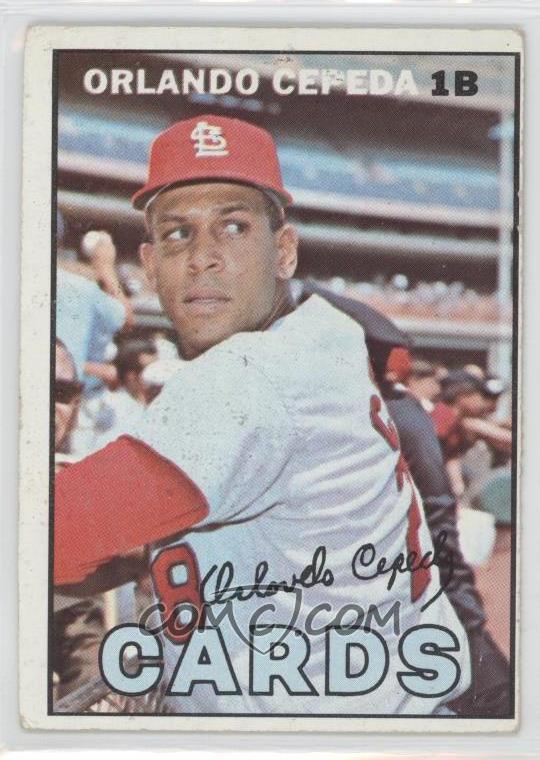
MVP Elections – 1967 NL

orlando-cepeda1967 was an odd year for MVPs.  There was a unanimous choice that year, which certainly happens, but I think most baseball fans, if they’re not familiar with irregularities in MVP voting, would assume that Carl Yastrzemski would have earned that distinction with his AL Triple Crown season (alas, some writer chose the Twins’ Cesar Tovar, of all people, leaving Yaz one vote shy of a clean sweep). Instead, the unanimous selection came in the NL in the person of Orlando Cepeda, which some will cite as one of the more egregious examples of the “RBI leader + Pennant winner = MVP” trope.  To others, though, this is an example of leadership being provided by an outstanding player in a new and difficult circumstance, justifying his MVP selection and creating a narrative worthy of the award.  So let’s step back to 1967 in the NL.

Continue reading

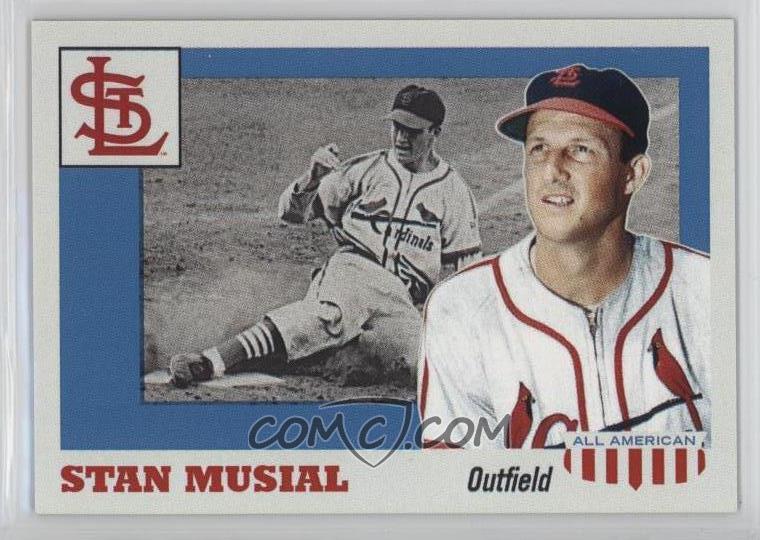
The Mount Rushmore of the St. Louis Cardinals

stan-musial

This much belated post finishes our first pass of each franchise in the Mount Rushmore series.

The St. Louis Cardinals franchise traces its origins to the American Association and the St. Louis Brown Stockings who began play in that league’s inaugural 1882 season. In addition to four AA pennants, the Cardinals have also enjoyed the most success among NL franchises, with 19 pennants and 11 World Series titles. Your task is to choose the four players who best represent this franchise that has operated continuously and always in St. Louis for the past 135 seasons. Have fun!

Continue reading

Bend Sinister

This past September 26, when Dee Gordon came to the plate as the first Marlins hitter to bat after the passing on September 25 of the team’s young star Jose Fernandez, Gordon, who bats as a left-handed batter, took the first pitch as a right-handed batter. That was done in honor of Fernandez, a righty pitcher and batter. After that first pitch from Mets pitcher Bartolo Colon, Gordon turned around and hit from his usual side, as a left-handed batter. From his normal side, Gordon promptly hit a home run off of Colon, to give Florida a lead, and the Marlins went on to win a game that was deeply haunted by the death of Fernandez the previous morning.

By a strange coincidence, Gordon’s homer as a lefty batter, coming after his first-pitch appearance from the other side of the plate, caused an all-time MLB record, specific to lefty hitters, to be tied (the record was then subsequently broken a few days later).

Here are the pitchers who have allowed, over a career, the most home runs to batters hitting from the lefty side of the plate (including both regular and post-season home runs allowed):

1. Bartolo Colon 231
2. Robin Roberts 230
3. Catfish Hunter 224
4. Jack Morris 214
5. Ferguson Jenkins 213 (or 214)
6. Bert Blyleven 206
T7. Phil Niekro and Don Sutton 203
9. Javier Vazquez 202
10. Dennis Eckersley 198

Bartolo, who himself hit a memorable home run this season (albeit as a right-handed batter), tied the all-time career HRs-allowed-to-lefties record, previously held by Robin Roberts, when he allowed the Dee Gordon homer on September 26. Colon then broke the record when he allowed another memorable homer on October 1, to Ryan Howard. It was Howard’s final HR for the Phillies, and perhaps of his career (I’m not sure Ryan Howard will find another MLB spot next season — he’s been a rather consistently sub-replacement level performer since he badly injured his Achilles tendon making the final out of Philadelphia’s 2011 post-season; the Phillies have not been back to the post-season since that play). That final homer for Howard, the record-breaker for Colon, came as the Mets sought to clinch a post-season berth on the second-to-last day of the season. Howard’s blast off Colon tied the game, and put the Mets’ post-season hopes in jeopardy, but another left-handed hitting first baseman, James Loney — owner of one of the lowest HR per PA ratios of any recent long-term first basemen — hit a homer of his own to restore the Mets lead, allowing Colon, the new all-time leader in homers allowed to lefties, to get the win and the Mets to grab a wild card spot. The Mets then went on to lose the wild card game — on a ninth-inning homer by unheralded lefty batter Conor Gillaspie.

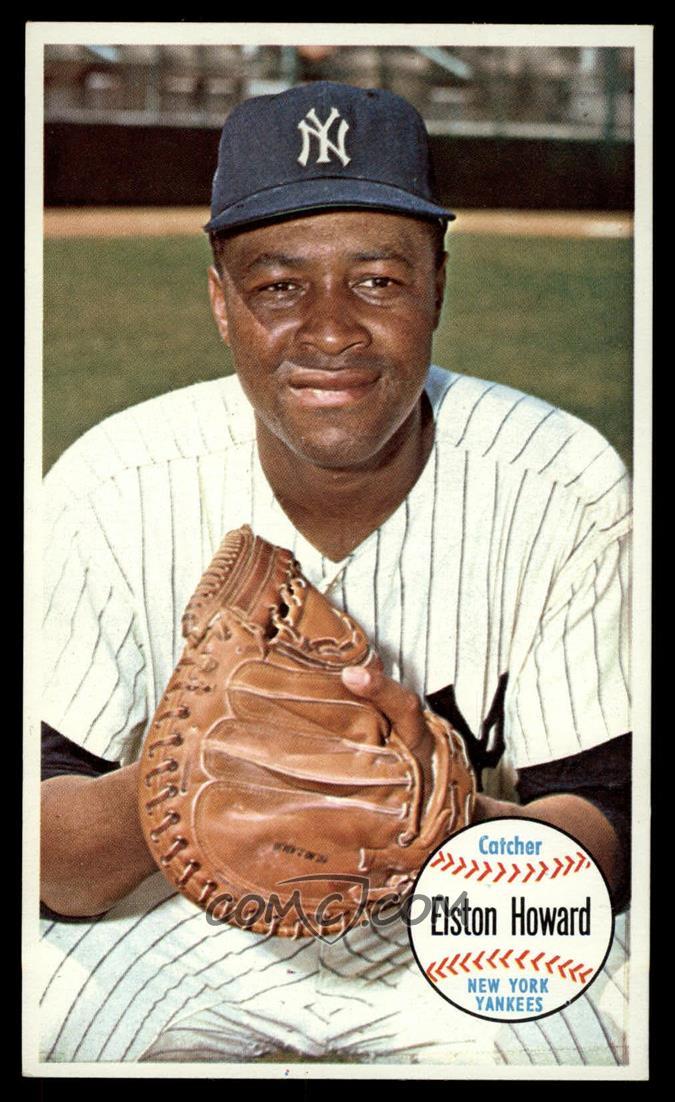
MVP Elections – 1963 AL

elston-howardHowdy, everyone! It’s our first AL post – though, admittedly, we’re still stuck in the early-60s.

1963 was oddly typical (that may be an oxymoron, but I’m going to let it stand). The Yankees won the AL for the 13th time in 15 years (they’d win the next year, too), so that was no change. A Yankee was named MVP for the 10th time in that 15 year span – so again, nothing new, particularly since Yankees catchers won more MVPs in this stretch than their teammates at other positions. Pythagoras had the Yankees and White Sox two games apart, but the Yanks actually won it by 10 in the win column, with each team missing its expected wins by four, but in opposite directions.

Continue reading

Quiz – HOF Sluggers … and some other guys (solved)

What do three HOFers have in common with several other less celebrated players? In fact, all of them share the distinction of a certain seasonal batting accomplishment of which no others can boast. What is it?

Congratulations to Voomo Zanzibar! He knew that these players have hit the most home runs in a season from each of the nine batting order positions.

The list of players is after the jump.

Continue reading

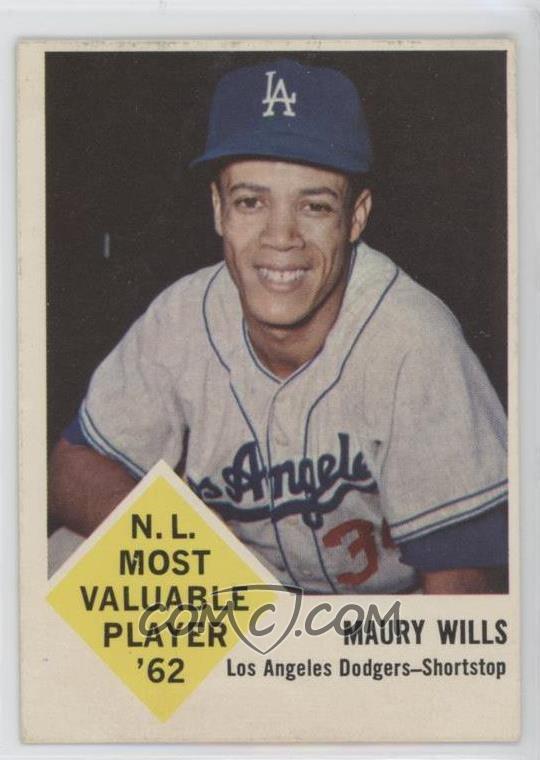
MVP Elections: 1962 NL

maury-willsWe just finished up our discussion on the 1960 NL MVP, so you’d figure that we’re going to zip ahead a few years, maybe switch leagues.  But here’s the thing – the next really interesting election is in the same league, just two years later.  Which brings me to our next election:  the 1962 National League.

The NL in 1962 had its first ten-team, 162-game season.  Everyone knows that this was the year of the Mets‘ miserable 40-120 season.  But what else do you know about 1962?

Continue reading