When it comes to allowing unearned runs, are pitchers masters of their own fate, or innocent victims of circumstance (or, perhaps, not so innocent)? That is the question I’ll look at in this second installment on unearned run prevention.

In Part 1 of this series, I looked at what evidence there might be to support the hypothesis that unearned run avoidance was a skill that some pitchers could consistently demonstrate over their careers. The major conclusion was that, since 1961, team ERA and team unearned run prevention showed positive correlation. That is, of those teams successful in limiting unearned runs, the proportion with better pitching (i.e. lower ERAs) was higher than for groups of teams having less success in preventing unearned runs. This conclusion also seems intuitively correct – pitchers who are good at preventing earned runs are probably also good at preventing unearned runs.

In Part 2, I’ll take the next step and try to identify those pitchers who seem most and least adept at the skill of preventing unearned runs. Yes, I called it a skill because, while some errors lead immediately and unavoidably to runs scoring, many times the consequences are not so dire, affording pitchers the opportunity to work out of jambs caused by their defense. Whether because of temperament or determination, some pitchers seem to do this quite well, while others … well, not so much.

After the jump, more on pitchers and unearned runs.

Unearned Runs – a “treasure” to be shared

To properly evaluate a pitcher’s ability to prevent or limit unearned runs scoring, it would be appropriate to consider the “opportunities” that a pitcher has to practice this skill – a euphemism for how frequently a pitcher is victimized by his teammates’ (or his own) errors. Unfortunately, I haven’t been able to find these data. So, I will instead use estimation techniques to derive how many unearned runs individual pitchers on a given team would be expected to give up based on the team’s total unearned runs allowed. In Part 3, I’ll look at whether a team’s unearned runs seem low or high relative to the number of errors committed, and then see if those indicators correlate with the presence or absence of pitchers skilled in limiting unearned runs.

To quantify pitchers’ abilities in preventing unearned runs, I chose to view a team’s unearned runs as a pool of runs to be shared across the pitching staff. This premise is based on the notion that a team is always trying to play at its best, but that, unfortunately, errors still occur and can happen at any time. Thus, pitchers don’t cause the defense to commit errors, and the fact that some pitchers happen to have to deal with more errors than other pitchers on the same team is as much a matter of luck as anything else.

The premise in the preceding paragraph is fine as far as it goes. However, while pitchers may not cause errors, their pitching may influence the frequency of errors committed behind them. Pitchers who limit balls in play generally stand a better chance of having fewer errors committed behind them than do pitchers who have more “exciting” innings. The strikeout pitcher who is also stingy with hits and walks is probably ideally suited to limiting the errors his defense makes. In Part 3, I’ll more into what type of pitcher is best suited to limiting unearned runs. But for now, let’s get back to that concept of unearned runs as a team commodity to be shared among the pitchers.

Unearned Run Allocation

So, how should unearned runs be shared among pitchers? I tried two different methods that I’ll describe this way:

(1) Workload-based allocation

  • a team’s unearned runs are shared among the team’s pitchers according to the proportion of the team’s innings that each pitcher worked
  • pitchers who work more innings are allocated more unearned runs, and those working fewer innings are allocated fewer unearned runs
  • pitchers with similar workloads are allocated similar numbers of unearned runs, regardless of the relative skill of such pitchers

(2) Skill-based allocation

  • a team’s unearned runs are shared among the team’s pitchers according to the proportion of the team’s earned runs that each pitcher allowed
  • good pitchers are “rewarded” with a lower allocation of unearned runs; bad pitchers are “penalized” with a higher allocation of unearned runs

Unearned Runs Saved

In both allocation methods, what is of interest is not the allocation itself, but the difference between the allocation and the actual unearned runs that a pitcher did allow, which I will call unearned runs saved or URS. Thus, a negative result is good, indicating a pitcher allowed fewer unearned runs than the portion of unearned runs allocated to him. Similarly, a positive result indicates a pitcher whose actual unearned runs allowed were more than the portion of the team’s unearned runs allocated to him.

So, what am I trying to measure here? The workload-based allocation is simply measuring the degree of deviation from a uniform world where all pitchers are equal and all will be equally affected by bad defense behind them. But, all pitchers are not equal, and the results from Part 1 of the study suggest that better pitchers should be more effective at preventing unearned runs. Therefore, the difference between actual and allocated unearned runs will measure how much better or worse pitchers are in unearned run prevention.

Responding to Misfortune

The second allocation is trying to measure something a bit more subtle. In a sense, it’s trying to get into the mind of the pitcher and gauge how he reacts to misfortune, specifically the misfortune of errors committed behind him. For example:

  1. One extreme is the pitcher who is upset with the mistakes of his teammates and loses his cool, affecting his performance in pitching to subsequent batters. Another variant of this extreme is the pitcher who feels sorry for himself and allows his concentration and effort to waver, secure in the self-fulfilling knowledge that “it just isn’t my day”.
  2. The other extreme is the pitcher who empathizes with the teammate who made the error, and wants to “pick him up” by exerting greater effort and determination to overcome the misfortune, and make even better pitches to subsequent hitters.
  3. In the middle are the professionals who just go about their business. Can’t do anything to change the past, so let’s get on with business and get the next out. The only pitch that matters is the next one. Insert your favorite hackneyed aphorism here. 

So, you’re saying “Okay, I know what you’re talking about, but how the heck are you going to measure that?”. Well, as it turns out, the second skill-based allocation, while obviously not directly measuring subjective qualities, does provide some indication of which of those three types a given pitcher might be. That indication can then be “tested” according to anecdotal or even observational evidence for given pitchers

What the skill-based allocation will tell you is, when faced with adversity caused by his team’s defense, does a given pitcher perform better than he normally does, about the same, or worse? Thus, I’ve called this metric Clutch Unearned Runs Saved or CURS, indicating that overcoming the adversity of poor defense is indeed a form of “clutch” pitching.

You will recall that I said that, under skill-based allocation, a pitcher is rewarded by having a lower unearned run allocation. Except, I enclosed “rewarded” in quotations because it isn’t really a reward since what we’re looking at is the difference between actual unearned runs and allocated unearned runs. So, the smaller the allocation, the harder it will be to go even lower. But, that’s reality – if you’re a good pitcher, it’s tough to be even better. In practice, the pitchers who have the best opportunity to do well here are the inferior pitchers of the type 2 variety – with a big unearned run allocation, they have lots of room to improve.

Results

Most pitchers have a small number of unearned runs charged to them each year, though occasionally there can be quite a few more in a given season. The point is that you aren’t going to learn much from looking at a season’s worth of data – the likelihood is too high that what you’re seeing is just good or bad luck. However, over time, luck tends to balance out so that what remains provides an indication of a pitcher’s skill in preventing unearned runs. Thus, the data I’ll be showing you are for entire careers, or portions of careers, for the 589 pitchers with at least 1000 IP since 1961. All data have been extracted from the Fangraphs database.

Here are the moments for our URS and CURS metrics. I’ve converted URS and CURS into per 9 IP quantities, but the distribution is for unweighted values. Thus, all pitchers are equally weighted, regardless of innings pitched.

URS CURS Moments

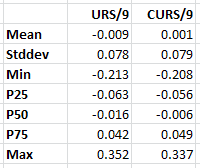
As you can see, there are very similar distributions for both the workload-based and skill-based allocation methods. Also, the mean for the subset of pitchers with 1000+ IP is almost bang on the true mean of zero for the entire population of all pitchers.

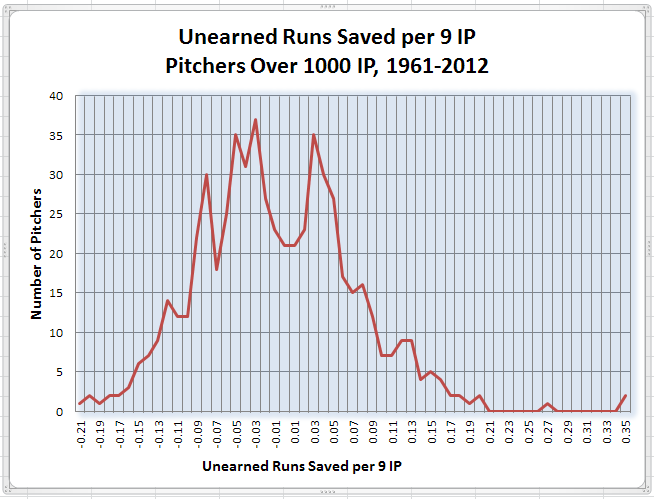
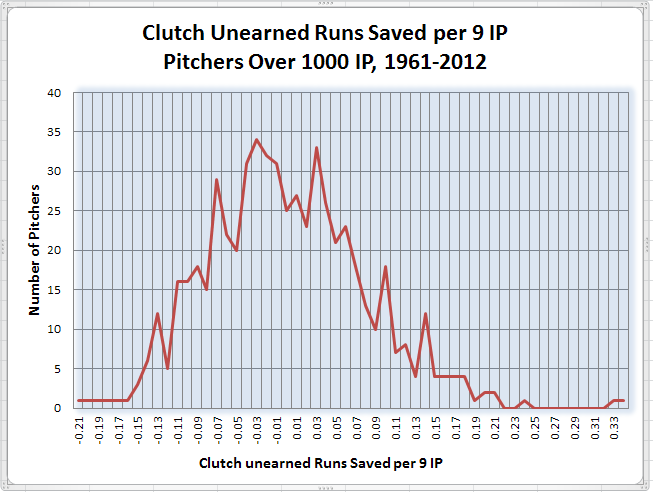
Below are charts visually depicting the two distributions.

URS Distribution 1961-2012

CURS Distribution 1961-2012


The table below shows you all 589 of these pitchers. You can search for a pitcher by entering his name in the Search box, or sort by any of the listed fields. These are:

Unearned Runs Saved (URS) - these are the career totals since 1961 of the difference between a pitcher’s actual unearned runs and the unearned runs allocated to him via the workload-based allocation described above. Negative results are good, indicating a pitcher who allowed fewer unearned runs than those allocated to him.

Clutch Unearned Runs Saved (CURS) – this may not be the best name for this metric, but these are the career totals since 1961 of the difference between a pitcher’s actual unearned runs and the unearned runs allocated to him via the skill-based allocation described above. Negative results, again, are good, indicating a pitcher who allowed a lower proportion of his team’s unearned runs than of his team’s earned runs. A pitcher doing this consistently is probably pitching better in these “clutch” situations (i.e. after an error committed behind him) than he does overall.

As indicated above, pitchers who do well here tend to be of the inferior variety who have lots of room to improve whereas a good pitcher is probably doing well with a score near zero, indicating his normal level of solid performance is maintained in these clutch situations. Probably the most interesting result are the good pitchers who do poorly here – this may be an indicator of those pitchers who do not respond well to errors committed behind them.

URS/162 and CURS/162 - the same metrics as above, but shown per 162 IP as an approximation of runs saved (or not) over the course of a season

URS Rank, CURS Rank - ranking among these 589 pitchers for URS/162 and CURS/162.

NameIPURSCURSURS/162CURS/162URS RankCURS Rank
Curt Schilling3261.00-77.3-50.1-3.840-2.488113
Tom Seaver4782.67-63.2-24.8-2.142-0.84141166
Don Sutton5282.00-61.1-55.4-1.874-1.6986167
Bert Blyleven4970.00-60.9-24.0-1.984-0.78252174
Roger Clemens4916.67-57.1-1.0-1.883-0.03460305
Dennis Eckersley3285.67-55.1-34.6-2.716-1.7051465
Luis Tiant3486.33-53.5-37.9-2.488-1.7602260
Fergie Jenkins4500.67-52.6-29.8-1.894-1.07159141
John Smoltz3473.00-48.5-33.3-2.262-1.5523381
Bob Gibson3722.00-48.2-18.1-2.096-0.78946172
Bret Saberhagen2562.67-44.9-26.5-2.838-1.6741169
Pedro Martinez2827.33-43.1-6.3-2.468-0.36024250
Jim Barr2065.33-38.1-29.8-2.985-2.336819
Javier Vazquez2840.00-36.6-30.9-2.088-1.7624759
Pedro Astacio2196.67-33.6-38.0-2.481-2.802236
Doug Drabek2535.00-33.6-28.6-2.144-1.8283950
Livan Hernandez3189.00-33.4-37.9-1.695-1.9237344
Jim Merritt1483.00-32.5-34.2-3.547-3.74031
Sid Fernandez1866.67-32.0-26.2-2.773-2.2761227
Ron Guidry2392.00-31.6-18.4-2.143-1.24640117
Woody Williams2216.33-31.3-29.5-2.289-2.1573029
Denny Neagle1890.33-31.2-29.0-2.671-2.4871614
Tom Glavine4413.33-31.0-20.3-1.138-0.745148179
Catfish Hunter3449.33-30.9-28.2-1.449-1.325106103
Jim Perry2871.33-30.7-29.5-1.732-1.6667170
Jim Deshaies1525.00-30.4-33.5-3.229-3.56162
Larry Dierker2333.67-30.2-15.6-2.099-1.08245139
Vida Blue3343.33-29.4-21.6-1.424-1.048110143
Denny Lemaster1787.67-29.0-27.3-2.627-2.4771715
Marty Pattin2038.67-28.2-26.0-2.244-2.0633433
Rick Reuschel3548.33-28.1-3.7-1.283-0.167135285
Dave McNally2730.00-27.5-32.7-1.632-1.9428039
Hideo Nomo1976.33-26.8-29.0-2.199-2.3793718
Jake Peavy1800.33-26.6-15.0-2.396-1.3472798
Bruce Hurst2417.33-26.2-22.6-1.754-1.5136884
Mike Mussina3562.67-25.9-6.8-1.176-0.310143259
Kevin Tapani2265.00-25.7-22.0-1.841-1.5706380
Kevin Appier2595.33-25.6-11.9-1.599-0.74086180
Dwight Gooden2800.67-25.0-16.5-1.444-0.952108152
Bob Welch3092.33-24.5-18.6-1.285-0.977134150
Sandy Koufax1632.67-24.31.2-2.4130.11926327
Don McMahon1061.00-24.2-13.0-3.693-1.983237
Doyle Alexander3367.67-24.0-28.5-1.153-1.37314694
David Wells3439.00-23.9-16.7-1.124-0.786150173
Andy Benes2505.33-23.6-21.8-1.526-1.4099691
Steve Rogers2837.67-23.1-6.7-1.320-0.385127241
Jeff Reardon1132.33-23.1-14.2-3.307-2.024535
Gary Nolan1674.67-23.0-14.4-2.224-1.3933592
Frank Tanana4188.33-22.9-0.4-0.888-0.017192309
Jim Bunning2667.33-22.5-9.8-1.369-0.593122206
Dave LaRoche1049.33-22.5-19.2-3.479-2.96845
John Candelaria2525.67-22.5-11.9-1.441-0.765109175
Jered Weaver1320.33-22.2-11.7-2.729-1.4331390
Mariano Rivera1219.67-22.10.6-2.9410.0769316
Nolan Ryan5386.00-22.16.7-0.6650.202230338
Rich Gossage1809.33-22.1-3.3-1.975-0.29954263
Ismael Valdez1827.33-21.8-19.4-1.937-1.7245763
Teddy Higuera1380.00-21.8-11.6-2.562-1.3581896
Freddy Garcia2183.67-21.6-20.3-1.605-1.5078586
Rick Sutcliffe2697.67-21.6-20.0-1.296-1.203132124
Cal Eldred1368.00-21.3-21.3-2.528-2.5212011
Gaylord Perry5350.33-20.917.9-0.6340.543235391
Doc Medich1996.67-20.8-25.6-1.691-2.0767532
Johan Santana2025.67-20.8-4.8-1.665-0.38877240
Trevor Hoffman1089.33-20.7-4.7-3.083-0.6967188
Mike McCormick1642.00-20.6-27.8-2.034-2.745498
Mickey Lolich3638.33-20.6-13.3-0.917-0.593181207
Chris Short2203.33-20.0-10.0-1.471-0.737105181
Rick Helling1526.33-20.0-15.6-2.122-1.6594271
Pat Jarvis1284.00-19.9-18.2-2.510-2.2912125
Don Aase1109.33-19.8-16.4-2.888-2.4001016
Shane Rawley1871.33-19.5-17.4-1.692-1.5037487
Dave Giusti1716.67-19.3-20.9-1.826-1.9716438
Lee Smith1289.33-19.3-4.2-2.428-0.52425224
Kevin Gross2487.67-19.3-27.8-1.257-1.81013752
Rollie Fingers1701.33-19.0-5.8-1.808-0.55465215
Tim Hudson2682.33-19.0-3.4-1.145-0.206147277
Jarrod Washburn1863.67-18.9-14.8-1.640-1.28879109
Jon Lester1163.00-18.3-12.7-2.552-1.7631958
Mark Langston2963.00-18.2-6.4-0.993-0.351169254
Jack Morris3824.00-18.1-16.0-0.769-0.678214190
Kerry Wood1380.00-18.0-10.4-2.119-1.22343121
Roy Oswalt2213.00-18.0-3.5-1.319-0.253128268
Moose Haas1655.00-17.8-16.4-1.743-1.6037077
Pat Hentgen2075.33-17.7-13.2-1.380-1.034119145
Jack McDowell1889.00-17.5-14.1-1.501-1.211103123
Jeff Francis1178.67-17.4-18.9-2.390-2.5952810
Willie Hernandez1044.67-17.3-11.0-2.690-1.6991566
Mark Gardner1764.67-17.3-25.2-1.586-2.3149120
Lynn McGlothen1497.67-17.1-24.8-1.853-2.683629
Jeff Weaver1838.00-17.1-20.3-1.506-1.78710155
Ted Lilly1959.67-16.8-19.5-1.392-1.60811776
Erik Hanson1555.33-16.8-16.2-1.745-1.6886968
Aaron Harang1802.00-16.7-13.6-1.505-1.220102122
Turk Farrell1363.00-16.7-12.3-1.985-1.4575189
Arthur Rhodes1187.67-16.7-15.1-2.277-2.0583134
Tom Browning1921.00-16.7-19.7-1.406-1.65811372
Dave Stewart2629.67-16.6-18.9-1.024-1.163163127
David Cone2898.67-16.4-2.8-0.916-0.154182287
Randy Wolf2268.00-16.4-15.5-1.169-1.105144134
Orlando Hernandez1314.67-16.3-16.2-2.010-2.0015036
Dick Drago1875.00-16.3-14.2-1.409-1.229112120
Jim Maloney1785.33-15.9-6.2-1.447-0.559107214
Mike Scott2068.67-15.9-17.7-1.245-1.38613893
John Montefusco1652.33-15.7-12.6-1.540-1.23394119
Danny Darwin3016.67-15.7-8.6-0.842-0.464197232
Justin Verlander1553.67-15.6-2.2-1.622-0.22782273
Mark Gubicza2223.00-15.5-17.4-1.130-1.271149112
Zack Greinke1492.00-15.4-1.8-1.672-0.19276280
John Hiller1242.00-15.00.8-1.9630.10056323
Steve Busby1060.67-15.0-15.0-2.290-2.2962924
Stan Bahnsen2529.00-14.9-20.3-0.956-1.302175106
Mel Stottlemyre2661.33-14.9-4.2-0.906-0.256186266
Burt Hooton2652.00-14.7-16.2-0.899-0.987189149
Dan Quisenberry1043.33-14.6-0.1-2.273-0.01732308
Matt Cain1536.67-14.6-6.8-1.535-0.71395185
La Marr Hoyt1311.33-14.6-18.0-1.798-2.2196628
Dave Boswell1065.33-14.5-22.0-2.210-3.347363
Joey Jay1132.33-14.4-19.2-2.061-2.747487
Mike Jackson1188.33-14.4-5.0-1.964-0.67955189
Ken Brett1526.33-14.4-18.2-1.523-1.9349840
Eric Show1655.00-14.3-13.8-1.395-1.34611599
Mike Flanagan2770.00-14.2-17.8-0.832-1.042198144
Steve Renko2494.00-14.1-14.0-0.918-0.910180158
Denny McLain1886.00-14.0-14.0-1.205-1.201140125
Jim Bibby1722.67-14.0-13.3-1.314-1.248129116
Pete Smith1025.67-13.9-20.1-2.194-3.176384
Bruce Sutter1042.00-13.60.7-2.1120.10344325
Doug Bird1213.67-13.4-18.7-1.790-2.5016712
George Brunet1346.67-13.4-14.8-1.610-1.7768457
Al Fitzmorris1277.00-13.4-14.4-1.696-1.8297249
Storm Davis1780.67-13.1-16.6-1.190-1.51214185
Dave Roberts2099.00-13.0-9.5-1.006-0.733166183
Robin Roberts1066.33-12.7-11.2-1.927-1.7085864
Moe Drabowsky1032.67-12.6-8.6-1.984-1.34253102
Mark Clark1246.33-12.5-14.7-1.620-1.9118345
Jose Lima1567.67-12.4-23.1-1.286-2.38413317
Dave Stieb2895.33-12.43.6-0.6960.203227339
Doug Rau1261.00-12.4-18.0-1.592-2.3139021
Charles Nagy1954.67-12.4-11.6-1.024-0.963164151
Tom Murphy1444.00-12.3-17.0-1.378-1.90912146
Lindy McDaniel1456.00-12.3-11.1-1.366-1.239123118
Pete Falcone1435.33-12.2-18.5-1.379-2.08412031
J.R. Richard1606.00-12.1-2.3-1.220-0.232139271
Tom Gordon2108.00-12.1-6.4-0.927-0.493178229
Ed Whitson2240.00-12.0-15.5-0.870-1.122194131
Mark Mulder1314.00-12.0-15.4-1.481-1.90410447
Mike Moore2831.67-12.0-16.5-0.686-0.944229153
Skip Lockwood1236.00-11.9-9.6-1.563-1.26293113
Mike Smithson1356.33-11.9-19.3-1.417-2.31111122
CC Sabathia2564.33-11.86.5-0.7460.409219367
Cole Hamels1376.67-11.8-4.6-1.388-0.540118220
Steve Bedrosian1191.00-11.7-3.4-1.597-0.45988233
Mark Davis1145.00-11.7-16.1-1.658-2.2777826
Brett Myers1688.67-11.7-9.5-1.122-0.910151157
Milt Pappas2626.67-11.7-9.5-0.721-0.589223210
Warren Spahn1163.00-11.7-8.2-1.628-1.14181128
Bill Stoneman1236.33-11.6-16.1-1.526-2.1059730
Mario Soto1730.33-11.5-4.0-1.075-0.378158242
John Denny2148.67-11.4-4.3-0.863-0.323195257
Pete Richert1165.67-11.4-9.1-1.585-1.26192114
Jim Beattie1148.33-11.3-11.6-1.593-1.6438974
Jim Lonborg2464.33-11.3-16.5-0.742-1.086220138
Jason Schmidt1996.33-11.2-8.3-0.908-0.673185192
Steve McCatty1188.33-11.2-9.4-1.523-1.27899111
Mike Boddicker2123.67-11.1-3.0-0.846-0.229196272
James Baldwin1322.67-11.1-15.7-1.359-1.92412443
Omar Olivares1591.67-11.0-13.2-1.118-1.344152101
Mike Stanton1114.00-11.0-8.2-1.597-1.18887126
Elmer Dessens1174.33-10.9-12.0-1.509-1.65710073
Scott McGregor2140.67-10.9-13.3-0.828-1.006200148
Earl Wilson1963.00-10.9-6.5-0.900-0.539188221
Jim Colborn1597.33-10.9-9.1-1.106-0.920154155
Jim Palmer3948.00-10.97.4-0.4460.305272354
Ryan Dempster2215.67-10.9-11.2-0.793-0.818206168
Len Barker1323.67-10.8-14.4-1.321-1.75912661
Claude Osteen3400.33-10.7-7.8-0.511-0.369258247
Bill Monbouquette1540.67-10.6-2.0-1.111-0.207153276
Greg Swindell2233.33-10.4-5.1-0.757-0.371217246
Ken Forsch2127.33-10.3-2.5-0.782-0.193212279
Mark Redman1238.67-10.2-12.1-1.336-1.58212579
John Buzhardt1164.67-10.0-16.5-1.392-2.29911623
Oil Can Boyd1389.67-10.0-11.2-1.167-1.300145107
Fred Norman1939.67-9.9-9.7-0.828-0.807199169
Don Robinson1958.33-9.9-13.3-0.818-1.097203136
Pete Harnisch1959.00-9.5-6.7-0.786-0.551210217
Adam Eaton1178.67-9.5-14.0-1.302-1.92613041
Don Gullett1390.00-9.4-4.7-1.098-0.544155219
John Burkett2648.33-9.4-13.9-0.575-0.849247165
Neal Heaton1507.00-9.3-15.2-1.001-1.63516775
Jerry Koosman3839.33-9.0-3.6-0.379-0.152281288
Bill Gullickson2560.00-8.9-9.5-0.565-0.600250205
Brad Radke2451.00-8.9-0.4-0.588-0.025245306
Pedro Borbon1026.67-8.9-9.4-1.400-1.48211488
Jim Nash1107.33-8.9-7.0-1.298-1.024131147
Glendon Rusch1477.33-8.9-16.3-0.971-1.78217456
Frank Castillo1595.33-8.8-13.2-0.896-1.345190100
Odalis Perez1335.00-8.8-15.9-1.066-1.92515942
Kelvim Escobar1507.00-8.6-3.9-0.922-0.418179236
Gene Nelson1080.00-8.5-11.9-1.280-1.78713654
Andy Messersmith2230.33-8.56.6-0.6170.479238379
Joe Blanton1434.67-8.4-13.6-0.946-1.53917782
Bob Moose1304.00-8.4-12.2-1.039-1.51616283
Mark Portugal1826.33-8.3-7.1-0.740-0.630221199
Steve Stone1788.33-8.3-9.7-0.750-0.879218163
Joey Hamilton1340.67-8.0-9.3-0.972-1.122172130
Dan Haren1876.67-8.01.0-0.6870.084228320
Bobby Witt2465.00-7.9-20.8-0.521-1.37025595
Rick Rhoden2593.67-7.7-8.0-0.482-0.498264228
Dennis Leonard2187.00-7.7-7.4-0.568-0.546249218
Brian Moehler1567.33-7.6-10.7-0.783-1.110211132
Dontrelle Willis1221.67-7.5-5.1-0.999-0.671168193
Eric Plunk1151.00-7.5-0.5-1.060-0.067160300
Bill Bonham1487.33-7.5-7.3-0.818-0.799202171
Mudcat Grant1912.67-7.5-7.7-0.635-0.650233195
Jim Brewer1019.00-7.5-3.8-1.190-0.602142204
Bob Friend1359.33-7.4-3.0-0.886-0.355193252
Carlos Silva1241.67-7.3-13.8-0.955-1.79517653
Tim Lincecum1214.00-7.3-3.4-0.971-0.449173234
Adam Wainwright1073.00-7.21.9-1.0920.294156353
Ricky Nolasco1113.33-7.2-10.9-1.044-1.59316178
Rick Langford1491.00-7.2-6.9-0.778-0.747213178
Chuck Dobson1258.33-7.1-14.7-0.911-1.89118448
Camilo Pascual1750.33-7.1-0.8-0.654-0.077231299
Al Leiter2391.00-6.92.8-0.4690.190268335
Joaquin Andujar2153.00-6.9-10.0-0.520-0.750256176
Frank Viola2836.33-6.94.6-0.3920.264277346
Mike Morgan2772.33-6.8-9.8-0.398-0.574276211
Johnny Podres1010.00-6.8-11.3-1.091-1.82015751
Doug Jones1128.33-6.86.9-0.9720.989171452
Mike Marshall1386.67-6.82.6-0.7900.308208355
Armando Reynoso1079.67-6.7-7.3-1.009-1.093165137
Paul Maholm1332.67-6.5-2.5-0.792-0.303207260
Jamie Moyer4074.00-6.3-1.2-0.252-0.050299302
Cliff Lee1852.67-6.31.8-0.5530.160252332
Esteban Loaiza2099.00-6.3-9.2-0.487-0.710261186
Doug Davis1715.67-6.3-4.3-0.596-0.403243238
Ed Figueroa1309.67-6.2-5.7-0.763-0.701215187
Jason Isringhausen1007.67-6.1-0.6-0.984-0.100170296
Shawn Estes1678.33-6.1-9.5-0.587-0.919246156
Dan Plesac1072.00-6.00.5-0.9130.077183317
Todd Jones1071.67-5.90.8-0.8910.128191328
Jose Mesa1548.67-5.8-4.0-0.610-0.414240237
Orlando Pena1041.67-5.8-1.3-0.905-0.208187275
Jason Jennings1128.33-5.7-4.5-0.825-0.646201196
Rick Mahler1951.33-5.7-7.4-0.477-0.614265201
Ryan Franklin1201.00-5.7-4.8-0.762-0.644216197
Larry Christenson1402.67-5.6-8.9-0.649-1.024232146
Joel Pineiro1754.33-5.6-9.3-0.516-0.863257164
John Smiley1908.00-5.6-4.1-0.474-0.344266255
Jose Guzman1224.33-5.5-1.8-0.731-0.234222270
Britt Burns1094.33-5.5-0.7-0.814-0.110204294
Atlee Hammaker1078.67-5.3-4.1-0.798-0.622205200
Rick Waits1427.00-5.2-6.5-0.595-0.736244182
Chris Capuano1162.00-5.1-6.6-0.717-0.922225154
Phil Regan1304.67-5.1-10.3-0.631-1.281236110
Jim McGlothlin1300.33-5.1-7.3-0.631-0.904237161
Joe Horlen2002.00-5.0-3.1-0.408-0.248275269
Mike Norris1124.33-5.0-6.1-0.719-0.882224162
Sammy Ellis1004.00-4.9-10.8-0.787-1.74020962
Ervin Santana1475.67-4.9-9.8-0.535-1.074253140
Ben Sheets1596.67-4.95.3-0.4940.533259390
Jimmy Key2591.67-4.86.1-0.2990.384292362
Ken Hill1973.00-4.7-7.4-0.385-0.607278203
Sam McDowell2492.33-4.67.3-0.3000.472290376
John Tudor1797.00-4.67.6-0.4140.684274411
Sterling Hitchcock1285.67-4.5-8.7-0.573-1.099248135
Omar Daal1198.67-4.5-9.7-0.613-1.312239104
Mike Timlin1204.33-4.53.8-0.6080.505241388
Sidney Ponson1760.33-4.5-9.9-0.414-0.909273159
Scott Kazmir1022.00-4.51.1-0.7090.167226334
Larry Gura2047.00-4.3-1.1-0.344-0.084284298
Jack Sanford1172.00-4.3-9.5-0.600-1.309242105
Kent Tekulve1436.67-4.312.0-0.4841.355262493
R.A. Dickey1059.67-4.10.5-0.6340.079234318
Alex Fernandez1760.33-4.12.9-0.3810.268279348
Tim Leary1491.33-4.1-12.4-0.446-1.35127197
Chan Ho Park1993.00-4.1-6.3-0.330-0.513286226
Todd Stottlemyre2191.67-4.0-8.0-0.299-0.593291208
Jesse Orosco1295.00-3.99.0-0.4881.131260467
Al McBean1072.33-3.7-1.2-0.557-0.175251283
Roy Halladay2687.33-3.617.0-0.2191.024306460
Lew Krausse1283.67-3.6-9.9-0.453-1.250270115
Barry Zito2436.33-3.6-4.5-0.237-0.299303262
Gary Lavelle1085.00-3.511.0-0.5271.648254510
Tug McGraw1514.67-3.53.7-0.3770.395282364
Eric Milton1582.33-3.5-7.9-0.361-0.805283170
Bob Ojeda1884.33-3.3-3.7-0.282-0.316297258
Wally Bunker1085.33-3.2-6.1-0.482-0.905263160
Chris Carpenter2219.33-3.24.4-0.2330.320304357
Kevin Correia1066.00-3.1-6.9-0.467-1.051269142
Jack Kralick1054.67-3.10.3-0.4690.050267312
Bob Veale1926.00-3.07.8-0.2480.654300407
Juan Marichal3426.00-2.829.9-0.1331.413317496
Shane Reynolds1791.67-2.7-2.2-0.246-0.201301278
Pete Vuckovich1455.33-2.74.1-0.2970.454293373
Clay Carroll1353.33-2.59.6-0.3051.148289472
Craig Swan1235.67-2.5-4.3-0.331-0.569285213
Juan Berenguer1205.33-2.4-3.3-0.322-0.437288235
Eric Rasmussen1017.67-2.4-5.2-0.379-0.832280167
Darren Oliver1866.67-2.40.7-0.2040.062307314
Ted Power1160.00-2.3-3.9-0.324-0.551287216
David Weathers1376.33-2.20.4-0.2610.044298311
Ray Burris2188.67-2.2-8.2-0.163-0.609311202
Gary Peters2076.67-2.2-3.5-0.171-0.276309265
Hank Aguirre1110.33-2.05.9-0.2890.863295437
Dave Dravecky1062.67-1.95.9-0.2860.892296444
Bill Campbell1229.33-1.93.7-0.2440.492302384
Charles Hudson1007.67-1.8-7.0-0.296-1.129294129
Josh Beckett1892.00-1.83.0-0.1570.261312344
Walt Terrell1986.67-1.7-8.3-0.142-0.673315191
Jimmy Haynes1200.67-1.7-9.6-0.229-1.289305108
Richard Dotson1857.33-1.7-7.6-0.147-0.660314194
Mike Krukow2190.67-1.7-5.1-0.124-0.377318243
Jake Westbrook1631.00-1.7-4.9-0.165-0.484310230
Dave Righetti1403.67-1.57.0-0.1750.811308432
Floyd Bannister2388.00-1.4-3.1-0.095-0.213320274
Russ Ortiz1661.33-1.4-5.3-0.136-0.521316225
Matt Clement1412.67-1.0-3.3-0.120-0.376319244
Curt Young1107.00-1.0-5.1-0.151-0.748313177
Steve Trachsel2501.00-1.00.4-0.0640.026321310
Dick Ruthven2109.00-0.7-6.8-0.055-0.524323223
Carl Morton1648.67-0.64.7-0.0610.463322375
Jose DeLeon1897.33-0.5-1.3-0.041-0.115324292
Dave Burba1777.67-0.4-0.9-0.038-0.085325297
Scott Sanderson2561.67-0.3-2.0-0.016-0.129329290
Dick Bosman1591.00-0.31.0-0.0260.098327322
Ben McDonald1291.33-0.25.0-0.0310.627326404
Edwin Jackson1268.67-0.2-2.4-0.024-0.303328261
Larry McWilliams1558.33-0.1-5.7-0.012-0.590331209
Greg Minton1130.67-0.110.9-0.0141.558330506
Chad Billingsley1163.33-0.10.6-0.0110.084332319
Rick Aguilera1291.330.17.30.0130.915333448
Whitey Ford1416.000.29.90.0191.134334469
Craig Lefferts1145.670.25.70.0300.801336429
Bob Buhl1177.670.3-3.40.036-0.470337231
Brad Penny1899.000.3-2.00.027-0.175335284
Brett Tomko1816.000.5-4.10.049-0.366339249
Tom Phoebus1030.000.6-4.60.100-0.725344184
Kevin Millwood2720.330.7-0.80.043-0.050338303
Rick Reed1545.670.81.30.0860.131342329
Fernando Valenzuela2930.000.9-3.40.052-0.190340281
Darold Knowles1092.001.36.90.1981.024350459
Jim Slaton2683.671.4-1.70.084-0.103341295
Mark Leiter1184.331.52.60.2060.356352360
Grant Jackson1358.671.54.20.1810.498347385
Mike Bielecki1231.001.5-2.70.203-0.357351251
David Palmer1085.001.61.90.2380.283358350
Paul Lindblad1213.671.64.40.2180.586353399
Pete Schourek1149.001.7-7.80.235-1.107356133
Dennis Cook1011.671.73.10.2770.492366383
Don Drysdale2360.671.713.50.1200.925345449
Scott Elarton1065.331.9-4.20.283-0.637368198
Ralph Terry1127.671.91.10.2730.161363333
Don Wilson1748.331.912.30.1771.136346470
John Curtis1641.002.0-5.30.194-0.526349222
Ubaldo Jimenez1093.002.05.00.2950.739369422
Ron Villone1168.002.0-2.70.276-0.368365248
Pat Rapp1387.332.0-1.20.233-0.135354289
7Jeremy Bonderman1176.002.0-1.30.275-0.177364282
Chris Bosio1710.002.05.30.1920.499348386
Sparky Lyle1390.332.115.70.2401.826359533
Jeremy Guthrie1202.002.17.50.2811.005367457
Randy Johnson4135.332.443.40.0951.702343515
Terry Forster1105.672.69.10.3771.335377492
Bob McClure1158.672.73.90.3760.550376393
Kyle Lohse1973.002.9-4.20.240-0.341360256
Billy O'Dell1029.002.93.10.4610.489391380
Ross Grimsley2039.333.0-6.40.237-0.505357227
Bob Wickman1059.003.012.90.4571.976389538
Pascual Perez1244.333.16.20.4060.809380431
Tom Burgmeier1258.673.213.50.4091.735381518
Willie Blair1274.003.5-2.30.445-0.287385264
Ron Reed2477.333.69.00.2340.586355398
Bruce Chen1356.333.82.10.4540.250387343
Carlos Zambrano1959.003.812.50.3151.031371461
Joe Magrane1096.673.85.90.5670.872410439
Dan Spillner1492.673.92.60.4210.285383351
Tom Bradley1017.673.9-1.60.627-0.256423267
Chris Hammond1123.674.03.10.5790.447411371
Vicente Padilla1571.334.15.50.4220.572384397
Stan Williams1313.334.14.50.5100.555403394
Jim Clancy2517.334.2-5.50.267-0.354362253
Bill Travers1120.674.22.00.6040.283416349
Lee Stange1216.004.24.90.5660.658409408
Aaron Cook1406.334.34.50.4930.522398389
Bobby Bolin1576.004.32.80.4460.289386352
Gil Meche1432.334.55.80.5050.651401406
James Shields1454.674.57.10.5020.794399428
Bill Hands1951.004.710.70.3870.886378442
Darryl Kile2165.334.78.00.3500.595375401
Joe Gibbon1039.334.92.60.7640.401443365
Bob Purkey1011.334.96.20.7881.000448456
Lary Sorensen1736.334.92.20.4590.206390340
Dick Tidrow1746.335.03.70.4650.347392359
Woodie Fryman2411.335.06.40.3380.432374370
Kent Mercker1325.335.15.70.6200.697421415
LaTroy Hawkins1303.675.17.00.6330.866424438
Alan Foster1025.335.13.80.8070.607452402
Tom Underwood1586.005.27.90.5260.808406430
Chuck Finley3197.675.224.50.2611.242361485
Nate Robertson1152.335.2-0.20.728-0.035436304
Tony Cloninger1767.675.2-4.10.478-0.375395245
raden Looper1176.005.38.70.7271.192435478
Larry Jackson2053.675.312.60.4190.993382453
Dave LaPoint1486.675.43.00.5850.331412358
Tom Hume1086.005.55.90.8210.881456440
Jesse Jefferson1085.675.5-2.60.823-0.388458239
Rheal Cormier1221.675.65.20.7370.685438412
Oliver Perez1141.335.63.50.7920.499449387
Clay Kirby1548.005.65.60.5860.587413400
Carl Pavano1788.675.65.00.5080.453402372
Hoyt Wilhelm1083.675.621.20.8443.166464578
Dave Wickersham1114.675.77.10.8271.039460462
Ray Culp1898.335.76.70.4870.571396395
Andy Ashby1810.675.77.70.5130.688404413
Pat Zachry1177.335.87.70.7951.060450463
Wilson Alvarez1747.675.813.50.5381.248407487
Dave Mlicki1232.675.91.50.7750.199445336
Josh Fogg1159.005.9-0.90.826-0.123459291
Kirk McCaskill1729.005.91.60.5540.153408331
Bob Miller1419.006.07.80.6850.887430443
Don Cardwell1528.336.13.40.6510.356425361
Zach Duke1054.676.27.40.9501.133472468
Tom Griffin1494.676.20.50.6760.058428313
Pat Dobson2120.336.31.00.4780.074394315
Dustin Hermanson1283.006.39.80.7961.233451482
Rodrigo Lopez1350.676.34.80.7570.571441396
Bob Shirley1432.006.46.80.7240.772434424
Alejandro Pena1057.676.611.61.0111.782481524
Jeff Russell1099.676.814.30.9972.100478544
Ricky Bones1278.336.93.20.8720.403468366
Felix Hernandez1620.336.922.40.6892.241431549
Bob Forsch2794.676.92.50.4000.143379330
Dennis Rasmussen1460.676.9-0.20.767-0.024444307
Bill Singer2174.006.93.10.5160.229405342
Bob Walk1666.006.91.00.6730.102427324
Charlie Leibrandt2308.007.09.50.4890.665397409
Ramon Ortiz1423.007.10.80.8100.088453321
John Lackey1876.007.27.70.6180.668419410
Ken Johnson1603.677.411.40.7471.155439473
Dave Goltz2039.677.412.70.5911.010414458
Steve Avery1554.677.8-1.50.813-0.160455286
Jason Bere1111.007.9-0.81.145-0.115491293
Vern Ruhle1411.337.96.80.9050.783470426
Dave Bush1141.337.95.11.1210.725490419
Eddie Fisher1486.007.96.50.8650.705467416
Jim Gott1120.008.07.81.1531.130494466
Dennis Martinez3999.678.07.80.3240.318372356
Gavin Floyd1127.008.05.41.1510.770493423
Cory Lidle1322.678.04.50.9820.550477392
Andy Hawkins1558.338.01.10.8350.113462326
Matt Garza1027.008.311.31.3061.783504526
Kirk Rueter1918.008.37.20.7000.607432403
John Franco1245.678.323.51.0783.058486576
A.J. Burnett2162.678.39.60.6230.723422417
Greg Harris1467.008.414.40.9301.588471507
Bob Shaw1254.338.512.81.0931.652488511
Glenn Abbott1286.008.53.81.0680.474484378
Paul Quantrill1255.679.014.01.1631.805496532
Orel Hershiser3130.339.018.20.4680.944393450
Bartolo Colon2393.339.114.10.6160.957418451
Milt Wilcox2016.679.13.30.7330.263437345
Greg Maddux5008.339.246.00.2971.489370500
Pedro Ramos1075.679.29.31.3871.406512495
Dan Schatzeder1317.009.79.31.1911.141497471
Bill Lee1944.339.78.80.8100.733454421
Ramon Martinez1895.679.89.00.8350.773461425
Jose Rijo1880.009.824.40.8482.100465545
Ray Washburn1209.6710.03.11.3400.417509369
Brian Bohanon1116.0010.15.71.4600.824521436
Erik Bedard1077.0010.116.31.5142.445524554
Matt Keough1190.0010.17.31.3730.994511455
Bob Knepper2708.0010.14.40.6040.265417347
Clyde Wright1728.6710.38.70.9620.819473435
Ray Sadecki2343.3310.4-8.30.721-0.572433212
Joe Coleman2569.3310.410.10.6580.640426405
Kip Wells1338.3310.56.51.2670.792502427
Dick Ellsworth1976.6710.515.90.8581.302466488
Melido Perez1354.6710.510.31.2551.228499481
Scott Karl1002.0010.711.11.7371.794538528
Steve Carlton5217.3310.837.70.3351.170373475
Diego Segui1807.6710.813.80.9711.236475484
Aaron Sele2153.0010.99.20.8220.695457414
Kris Benson1243.6710.913.21.4241.717516517
Joe Niekro3584.0011.210.80.5050.490400381
Mark Buehrle2679.0011.224.90.6781.506429503
Mike Torrez3044.0011.3-1.00.602-0.056415301
Jim O'Toole1282.6711.314.21.4321.795517530
Scott Erickson2360.6711.410.50.7790.723446418
Randy Lerch1099.3311.81.41.7370.200539337
Brandon Webb1319.6711.828.71.4473.519520583
Tim Belcher2442.6711.811.00.7840.726447420
Tomo Ohka1070.0011.811.81.7921.780541523
Jim Abbott1674.0011.99.31.1470.904492447
Terry Mulholland2576.0011.96.60.7490.415440368
Jeff Suppan2542.6711.97.40.7590.474442377
Jon Lieber2198.0012.017.70.8821.303469489
Bruce Kison1809.6712.09.11.0770.816485434
Joe Saunders1161.3312.111.61.6841.615536508
Ron Darling2360.3312.36.70.8410.462463374
Gene Garber1510.0012.323.31.3172.501506558
Kenny Rogers3302.6712.628.40.6181.391420494
Steve Hargan1632.0012.73.91.2640.388501363
Bronson Arroyo2076.3312.915.61.0031.214479480
Juan Guzman1483.3313.016.41.4221.788515527
Steve Trout1501.3313.310.91.4331.173518477
Mark Hendrickson1169.0013.710.61.9041.470546499
Roberto Hernandez1071.3313.825.42.0803.836554586
Jack Fisher1689.3313.82.31.3270.216507341
Dave Rozema1106.0014.220.62.0823.016555575
Steve Sparks1319.6714.213.91.7491.700540514
Bill Wegman1482.6714.411.01.5691.206526479
Fritz Peterson2218.3314.415.31.0521.116483465
Matt Young1189.6714.711.02.0071.492550501
Ron Perranoski1174.6715.023.12.0743.184553579
Ed Halicki1063.0015.116.22.3032.466563557
Phil Niekro5404.3315.261.90.4551.854388534
Blue Moon Odom1509.0015.34.61.6430.492531382
Bud Black2053.3315.415.71.2141.242498486
Steve Blass1597.3315.88.71.6000.883529441
Juan Pizarro1590.0016.217.11.6471.739532520
John Thomson1270.3316.318.72.0842.379556552
Matt Morris1806.0016.418.71.4671.681523513
Nelson Briles2111.6716.410.61.2600.812500433
Al Jackson1371.3316.717.91.9722.120549546
Jon Matlack2363.0017.028.41.1621.945495536
Mike Witt2108.3317.121.41.3121.641505509
Jim Bouton1238.6717.113.32.2341.738560519
Tom Candiotti2725.0017.330.01.0311.782482525
Bob Tewksbury1807.0017.422.41.5572.007525540
Ken Holtzman2867.3317.915.81.0100.894480445
Jim Rooker1810.3318.019.61.6071.758530521
Jose Contreras1168.0018.014.52.4992.005571539
Dan Petry2080.3318.116.91.4111.319514490
Wayne Garland1040.0018.118.32.8272.853580573
Al Downing2268.3318.617.31.3291.235508483
Bruce Ruffin1268.0018.822.02.3972.817568572
Rick Wise3127.0018.821.30.9731.105476464
Wayne Twitchell1063.0019.417.02.9512.591583565
Kevin Brown3256.0019.550.30.9702.504474559
Jason Johnson1357.0019.616.22.3341.930565535
Roger McDowell1050.0019.724.63.0353.801584585
Randy Jones1933.0019.733.41.6522.796533570
Steve Barber1817.3320.319.11.8071.707542516
Jon Garland2083.3320.319.41.5801.506527504
Bill Swift1599.6720.425.12.0652.544552562
Gary Bell1444.3320.521.32.3002.392562553
Danny Cox1298.0020.621.02.5662.626573567
Rudy May2622.0021.118.91.3021.166503474
Dean Chance2147.3321.137.31.5912.811528571
Jaime Navarro2055.3321.512.61.6930.994537454
Dennis Lamp1830.6721.520.31.9071.794547529
Brian Anderson1547.0022.118.82.3171.971564537
Andy Hassler1123.3322.119.13.1932.753585569
Derek Lowe2658.3322.224.01.3521.463510498
Bryn Smith1791.3322.423.02.0262.084551542
Curt Simmons1256.6722.426.22.8883.378581582
Bobby Jones1518.6722.920.02.4472.133570547
Wandy Rodriguez1381.6723.127.22.7053.185577580
Jeff Fassero2033.3323.630.71.8792.446545555
Wilbur Wood2684.0023.942.11.4402.543519561
Sonny Siebert2152.0024.834.21.8642.574544564
Bob Stanley1707.0024.834.32.3563.258567581
Reggie Cleveland1809.0024.818.62.2241.668558512
Jerry Reuss3670.0025.020.41.1020.900489446
Mike Cuellar2804.0025.331.21.4611.803522531
Charlie Hough3801.0025.431.01.0831.322487491
Mike LaCoss1739.6725.816.02.4071.494569502
Jason Marquis1803.3326.013.02.3401.172566476
Jack Billingham2230.6726.420.81.9181.507548505
Paul Splittorff2554.6726.422.91.6761.453535497
Paul Byrd1697.0028.627.42.7272.617578566
Rick Honeycutt2160.0030.132.92.2562.465561556
Geoff Zahn1849.0030.234.02.6432.975574574
George Stone1020.6730.727.74.8804.399587587
Mike Hampton2268.3331.235.62.2302.541559560
Mike Caldwell2409.0031.434.02.1152.288557550
Jamey Wright1896.3331.631.82.6972.715576568
Andy Pettitte3130.6732.140.41.6592.091534543
Miguel Batista1956.3332.330.92.6782.556575563
Dock Ellis2127.6733.231.22.5312.378572551
Zane Smith1919.3334.241.72.8883.523582584
Danny Jackson2072.6735.927.62.8102.154579548
Tommy John4710.3341.051.71.4111.777513522
Bill Krueger1194.3346.744.26.3355.992589588
Jim Kaat4475.3349.956.91.8082.059543541
Julian Tavarez1404.3354.452.66.2746.065588589
Tim Wakefield3226.3364.361.73.2283.099586577


So, what are these numbers telling us? Because all of the URS totals are calculated for each player, season by season (and within a season, by team), you are seeing how well a pitcher did relative to other pitchers on the same team. So, comparing pitchers on different teams to each other is comparing how well each did in his own context. Which, when you come down to it, is what really matters. For example, in preventing unearned runs, this metric would show whether Andy Pettitte helped the Yankees more than Roy Halladay helped the Phillies, not whether or by how much either was better or worse  than a major-league average pitcher, whatever that might be. It’s important to bear this type of comparison in mind when looking at scores for different pitchers.

Thus, the runs saved or not saved are indicative of how much a pitcher contributed to his team(s) over the course of his career. What these numbers are NOT telling you is how well a pitcher would have done had he played on another team. To compare pitchers to each other directly is probably most meaningful among pitchers who played a large portion of their careers on the same team, in front of the same defense. Thus, Smoltz, Glavine and Maddux could be a good group, or Koufax and Drysdale, Marichal and Gaylord Perry, etc.

Some observations on this measurement approach:

  • Large URS numbers (20 or more, either positive or negative) are meaningful. Remember this is a zero sum method. All pitchers on a team sum to zero in every year. For a pitcher to compile numbers of that magnitude means they are consistently posting positive or negative scores in most seasons, something quite unlikely if this was all about luck. This is more especially true, still, if a pitcher played for different teams of varying quality through the course of his career.
  • While the yearly run totals are, as explained, very context-sensitive, the summation of these run totals is not normalized. Thus, the win value of a run at different points in a player’s career is not factored into the career totals, nor are differences in win values of a run within a season owing to park effects. These would be useful enhancements to this approach.
  • Remember that an average CURS score (i.e. near zero) is not bad. It just means the pitcher performed similarly with regard to allowing both earned or unearned runs. So, for example, Sandy Koufax was -24.3 URS, but only 1.2 CURS. That means he did very well (top 10%) in saving unearned runs, and allowed about equal shares of his teams’ earned and unearned runs (which, for a player with a 156 ERA+ during the years of this study, is very, very good indeed).
  • URS does NOT love knuckleballers. Which kind of makes sense. Knuckleballs tend to result in more errors and more passed balls, both of which can lead to unearned runs. Thus, Phil Niekro, Tom Candiotti, Wilbur Wood, Charlie Hough and Tim Wakefield are all near the bottom in URS, in or very close to the lowest 10%. Tim Wakefield is dead last in URS among these 589 pitchers and his 64.3 URS total is 10 runs (okay, it’s 9.9) clear of number 588. I think you definitely want to look at RA more than ERA when evaluating a knuckleball pitcher.

The King of URS

So what about the guy at the top of our list? Not only did Curt Schilling rank first in career URS, he also ranked first in URS/162, despite pitching over 3000 innings, many more than the majority of pitchers in this study (number 2 in URS/162 is reliever Don McMahon, with just 1061 IP) . Thus, Schilling truly was consistent in compiling good URS scores just about every year (he had negative URS in 18 of 20 seasons), regardless of what team he was on. In addition, Schilling also ranked 13th of 589 in CURS, meaning he allowed a much smaller proportion of his teams’ unearned runs than of his teams’ earned runs – no mean feat considering Schilling’s career 127 ERA+. It would seem Schilling took errors as a challenge, determined not to let his opponents get “cheap” runs as a result. More conventional metrics also agree – Schilling has the lowest career % of runs allowed that are unearned (less than 5%) among all pitchers with 1200 IP since 1901.

Whether aptly named or not, since I had a metric called Clutch URS, I have to tell you about Jack Morris. Actually, Jack does pretty well with scores of -18.1 URS and -16.0 CURS, the result of posting consistent negative scores most of his career. Jack’s totals would have been considerably better (he was -30.3 URS and -22.6 CURS through the 1989 season) had he not posted some high positive scores in his final years.

For those with the inclination to dig deeper, this link will take you to a spreadsheet where you can select pitchers of interest and see their URS and CURS scores, on a season by season basis. To use the tool:

  1. Give Google a minute or two to load the data (there’s a lot)
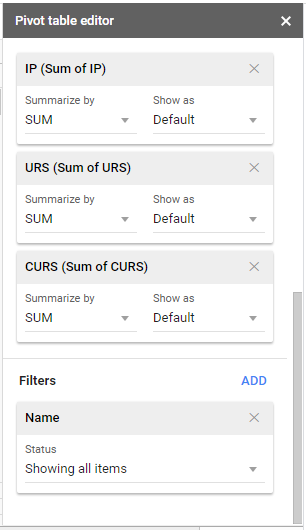
  2. In the Report Editor on the right side, scroll to the bottom to the Filter box. Under Filter: Name will be shown the number of items (players) currently being displayed (should be just 1 for best results)
  3. Click on the little down arrow beside the number of items, and a selection pop up will appear
  4. Click on Clear to clear the current selection
  5. Enter the last name of the player of interest in the Search box, and select from the displayed search results
  6. Wait a moment or two, and the season by season results for that pitcher will be displayed (looks like below)

URS Query Tool Example

I’ll close with this listing of the 100 pitchers with the most innings pitched since 1961 (which just happens to be all pitchers over 2500 IP), sorted by URS.

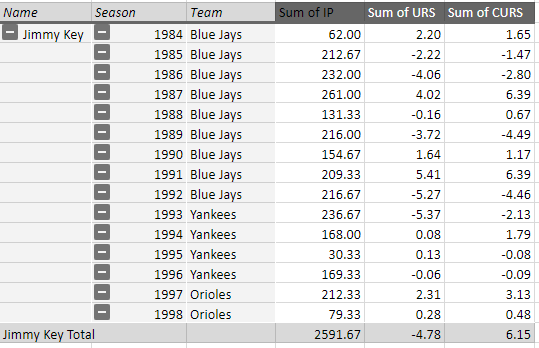
Name	                     IP	  URS	 CURS  URS/162 CURS/162 URS Rk CURS Rk Combined Rk
Curt Schilling		3261.00   -77.3	 -50.1	-3.84	-2.49	  1	 13	  14
Tom Seaver		4782.67	  -63.2	 -24.8	-2.14	-0.84	 41	166	 207
Don Sutton		5282.00	  -61.1	 -55.4	-1.87	-1.70	 61	 67	 128
Bert Blyleven		4970.00	  -60.9	 -24.0	-1.98	-0.78	 52	174	 226
Roger Clemens		4916.67	  -57.1	  -1.0	-1.88	-0.03	 60	305	 365
Dennis Eckersley	3285.67	  -55.1	 -34.6	-2.72	-1.71	 14	 65	  79
Luis Tiant		3486.33	  -53.5	 -37.9	-2.49	-1.76    22	 60	  82
Fergie Jenkins		4500.67	  -52.6	 -29.8	-1.89	-1.07	 59	141	 200
John Smoltz		3473.00	  -48.5	 -33.3	-2.26	-1.55	 33	 81	 114
Bob Gibson		3722.00	  -48.2	 -18.1	-2.10	-0.79	 46	172	 218
Bret Saberhagen	        2562.67	  -44.9	 -26.5	-2.84	-1.67	 11	 69	  80
Pedro Martinez		2827.33	  -43.1	  -6.3	-2.47	-0.36	 24	250	 274
Javier Vazquez		2840.00	  -36.6	 -30.9	-2.09	-1.76	 47	 59	 106
Doug Drabek		2535.00	  -33.6	 -28.6	-2.14	-1.83	 39	 50	  89
Livan Hernandez	        3189.00	  -33.4	 -37.9	-1.70	-1.92	 73	 44	 117
Tom Glavine		4413.33	  -31.0	 -20.3	-1.14	-0.75	148	179	 327
Catfish Hunter		3449.33	  -30.9	 -28.2	-1.45	-1.33	106	103	 209
Jim Perry		2871.33	  -30.7	 -29.5	-1.73	-1.67	 71	 70	 141
Vida Blue		3343.33	  -29.4	 -21.6	-1.42	-1.05	110	143	 253
Rick Reuschel		3548.33	  -28.1	  -3.7	-1.28	-0.17	135	285	 420
Dave McNally		2730.00	  -27.5	 -32.7	-1.63	-1.94	 80	 39	 119
Mike Mussina		3562.67	  -25.9	  -6.8	-1.18	-0.31	143	259	 402
Kevin Appier		2595.33	  -25.6	 -11.9	-1.60	-0.74	 86	180	 266
Dwight Gooden		2800.67	  -25.0	 -16.5	-1.44	-0.95	108	152	 260
Bob Welch		3092.33	  -24.5	 -18.6	-1.28	-0.98	134	150	 284
Doyle Alexander	        3367.67	  -24.0	 -28.5	-1.15	-1.37	146	 94	 240
David Wells		3439.00	  -23.9	 -16.7	-1.12	-0.79	150	173	 323
Andy Benes		2505.33	  -23.6	 -21.8	-1.53	-1.41	 96	 91	 187
Steve Rogers		2837.67	  -23.1	  -6.7	-1.32	-0.39	127	241	 368
Frank Tanana		4188.33	  -22.9	  -0.4	-0.89	-0.02	192	309	 501
Jim Bunning		2667.33	  -22.5	  -9.8	-1.37	-0.59	122	206	 328
John Candelaria	        2525.67	  -22.5	 -11.9	-1.44	-0.77	109	175	 284
Nolan Ryan		5386.00	  -22.1	   6.7	-0.67	 0.20	230	338	 568
Rick Sutcliffe		2697.67	  -21.6	 -20.0	-1.30	-1.20	132	124	 256
Gaylord Perry		5350.33	  -20.9	  17.9	-0.63	 0.54	235	391	 626
Mickey Lolich		3638.33	  -20.6	 -13.3	-0.92	-0.59	181	207	 388
Tim Hudson		2682.33	  -19.0	  -3.4	-1.14	-0.21	147	277	 424
Mark Langston		2963.00	  -18.2	  -6.4	-0.99	-0.35	169	254	 423
Jack Morris		3824.00	  -18.1	 -16.0	-0.77	-0.68	214	190	 404
Dave Stewart		2629.67	  -16.6	 -18.9	-1.02	-1.16	163	127	 290
David Cone		2898.67	  -16.4	  -2.8	-0.92	-0.15	182	287	 469
Danny Darwin		3016.67	  -15.7	  -8.6	-0.84	-0.46	197	232	 429
Stan Bahnsen		2529.00	  -14.9	 -20.3	-0.96	-1.30	175	106	 281
Mel Stottlemyre	        2661.33	  -14.9	  -4.2	-0.91	-0.26	186	266	 452
Burt Hooton		2652.00	  -14.7	 -16.2	-0.90	-0.99	189	149	 338
Mike Flanagan		2770.00	  -14.2	 -17.8	-0.83	-1.04	198	144	 342
Dave Stieb		2895.33	  -12.4	   3.6	-0.70	 0.20	227	339	 566
Mike Moore		2831.67	  -12.0	 -16.5	-0.69	-0.94	229	153	 382
CC Sabathia		2564.33	  -11.8	   6.5	-0.75	 0.41	219	367	 586
Milt Pappas		2626.67	  -11.7	  -9.5	-0.72	-0.59	223	210	 433
Jim Palmer		3948.00	  -10.9	   7.4	-0.45	 0.31	272	354	 626
Claude Osteen		3400.33	  -10.7	  -7.8	-0.51	-0.37	258	247	 505
John Burkett		2648.33	   -9.4	 -13.9	-0.58	-0.85	247	165	 412
Jerry Koosman		3839.33	   -9.0	  -3.6	-0.38	-0.15	281	288	 569
Bill Gullickson	        2560.00	   -8.9	  -9.5	-0.56	-0.60	250	205	 455
Rick Rhoden		2593.67	   -7.7	  -8.0	-0.48	-0.50	264	228	 492
Frank Viola		2836.33	   -6.9	   4.6	-0.39	 0.26	277	346	 623
Mike Morgan		2772.33	   -6.8	  -9.8	-0.40	-0.57	276	211	 487
Jamie Moyer		4074.00	   -6.3	  -1.2	-0.25	-0.05	299	302	 601
Jimmy Key		2591.67	   -4.8	   6.1	-0.30	 0.38	292	362	 654
Roy Halladay		2687.33	   -3.6	  17.0	-0.22	 1.02	306	460	 766
Juan Marichal		3426.00	   -2.8	  29.9	-0.13	 1.41	317	496	 813
Steve Trachsel		2501.00	   -1.0	   0.4	-0.06	 0.03	321	310	 631
Scott Sanderson	        2561.67	   -0.3	  -2.0	-0.02	-0.13	329	290	 619
Kevin Millwood		2720.33	    0.7	  -0.8	 0.04	-0.05	338	303	 641
Fernando Valenzuela	2930.00	    0.9	  -3.4	 0.05	-0.19	340	281	 621
Jim Slaton		2683.67	    1.4	  -1.7	 0.08	-0.10	341	295	 636
Randy Johnson		4135.33	    2.4	  43.4	 0.09	 1.70	343	515	 858
Jim Clancy		2517.33	    4.2	  -5.5	 0.27	-0.35	362	253	 615
Chuck Finley		3197.67	    5.2	  24.5	 0.26	 1.24	361	485	 846
Bob Forsch		2794.67	    6.9	   2.5	 0.40	 0.14	379	330	 709
Dennis Martinez	        3999.67	    8.0	   7.8	 0.32	 0.32	372	356	 728
Orel Hershiser		3130.33	    9.0	  18.2	 0.47	 0.94	393	450	 843
Greg Maddux		5008.33	    9.2	  46.0	 0.30	 1.49	370	500	 870
Bob Knepper		2708.00	   10.1	   4.4	 0.60	 0.27	417	347	 764
Joe Coleman		2569.33	   10.4	  10.1	 0.66	 0.64	426	405	 831
Steve Carlton		5217.33	   10.8	  37.7	 0.33	 1.17	373	475	 848
Joe Niekro		3584.00	   11.2	  10.8	 0.50	 0.49	400	381	 781
Mark Buehrle		2679.00	   11.2	  24.9	 0.68	 1.51	429	503	 932
Mike Torrez		3044.00	   11.3	  -1.0	 0.60	-0.06	415	301	 716
Terry Mulholland	2576.00	   11.9	   6.6	 0.75	 0.42	440	368	 808
Jeff Suppan		2542.67	   11.9	   7.4	 0.76	 0.47	442	377	 819
Kenny Rogers		3302.67	   12.6	  28.4	 0.62	 1.39	420	494	 914
Phil Niekro		5404.33	   15.2	  61.9	 0.45	 1.85	388	534	 922
Tom Candiotti		2725.00	   17.3	  30.0	 1.03	 1.78	482	525	1007
Ken Holtzman		2867.33	   17.9	  15.8	 1.01	 0.89	480	445	 925
Rick Wise		3127.00	   18.8	  21.3	 0.97	 1.11	476	464	 940
Kevin Brown		3256.00	   19.5	  50.3	 0.97	 2.50	474	559	1033
Rudy May		2622.00	   21.1	  18.9	 1.30	 1.17	503	474	 977
Derek Lowe		2658.33	   22.2	  24.0	 1.35	 1.46	510	498	1008
Wilbur Wood		2684.00	   23.9	  42.1	 1.44	 2.54	519	561	1080
Jerry Reuss		3670.00	   25.0	  20.4	 1.10	 0.90	489	446	 935  
Mike Cuellar		2804.00	   25.3	  31.2	 1.46	 1.80	522	531	1053
Charlie Hough		3801.00	   25.4	  31.0	 1.08	 1.32	487	491	 978
Paul Splittorff	        2554.67	   26.4	  22.9	 1.68	 1.45	535	497	1032
Andy Pettitte		3130.67	   32.1	  40.4	 1.66	 2.09	534	543	1077
Tommy John		4710.33	   41.0	  51.7	 1.41	 1.78	513	522	1035
Jim Kaat		4475.33	   49.9	  56.9	 1.81	 2.06	543	541	1084
Tim Wakefield		3226.33	   64.3	  61.7	 3.23	 3.10	586	577	1163


Subscribe to: RSS feed