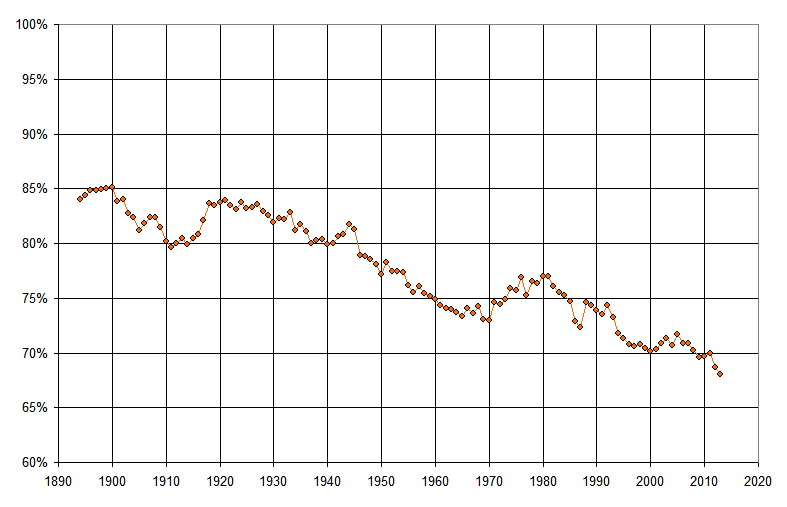
Fraction of balls put in play is at an all-time low

Here’s a plot showing the percentage of balls in play each year. Specifically, this refers to the fraction of plate appearances that result in a ball being handled by the defense.

BIP

The formula uses at-bats in the numerator, subtracting out home runs and strikeouts, and adding sacrifice hits and sacrifice flies. That total is then divided by plate appearances, which of course includes walks and hit-by-pitch.

As you can see, 2013 is on pace to have the lowest percentage of balls put in play in MLB history. And even though 2013 is far from over and could change, 2012 itself set the all-time record, at just 68.7%.

The two biggest factors are, of course, home runs and strikeouts. Even in this year of very low offense, home runs are still quite high. I wrote about that in my USA Today Sports Weekly piece this week. Strikeouts continue to go higher and higher, and drive the percentage of balls in play lower and lower.

Some comments and implications about the above graph:

  • Think about 2013, at 68%, vs baseball in the 1940’s, around 80%. With teams averaging around 38 plate appearances per game, that’s a difference of nearly 5 balls in play per game. Think about that–5 batted balls fewer per game, every game! That’s astounding.
  • The fewer balls in play also means that defense matters less. In the current game, defense is the best it’s ever been. Equipment and fields are of uniformly excellent quality and players have better range than ever. However, the lack of balls being put into play means that the defense has fewer chances, so overall, there is less variability on defense from team to team.
  • We think of 1968 as the year of the pitcher, but 74.2% of balls were still put in play that year, meaning the defense played a much bigger role.
  • Take a look at fielding metrics over the years, here. Putouts have remained the same over the years, because they are basically all outs. But total chances has dropped gradually over the years, from about 41 in the 1920s to 39 in the 1940s to about 37.5 in recent years. This number has fallen a bit because errors have continually dropped, but more because assists have dropped. And why have assists dropped? Because a higher fraction of putouts are to the catcher, i.e. strikeouts, when there can be no assist.

The game is changing, for sure…


0 0 votes
Article Rating
Subscribe
Notify of
guest

39 Comments
Oldest
Newest Most Voted
Inline Feedbacks
View all comments
Pseu
Pseu
10 years ago

The improved defense makes the “swing for the fences” strategy even more attractive, as it shrinks the “cost” of a strikeout.

Timmy Pea
Timmy Pea
10 years ago
Reply to  Pseu

I agree, most players don’t shorten the swing on 2 strikes anymore. Great stuff!

no statistician but
no statistician but
10 years ago
Reply to  Pseu

Pseu:

I hope you’re being humorous. The differential in fielding 2012/1960 is less that 1 error per three games. I don’t know how to figure the % of errors that result in runs, but is has to be considerably less than the number of errors, probably less than half.

Plus, how much of that “improved” defense results from the all or nothing approach? It’s impossible to say, of course—stats guys, correct me if I’m wrong—but I’d guess there’s a small correlation.

no statistician but
no statistician but
10 years ago
Reply to  Andy

Andy:

I don’t doubt you or Reggie Jefferson, but is my figure wrong? Less than 1 error in three games difference? since 1960? I’d say rather that players today “know” what they think they know that supports the point of view they already have decided to take. It’s nothing new. People do it all the time in all walks of life.

Separating conception from reality is hard for rocket scientists, much less ballplayers.

Timmy Pea
Timmy Pea
10 years ago
Reply to  Andy

My God that Andy’s as sharp as a knife!

brp
brp
10 years ago

I think there’s another, bigger factor in defense in the past 10 years or so – shifting. Especially the dramatic shifts with 3 guys to the left/right of 2nd base, or a guy playing short right field for lefty power hitters, etc. Maybe I was too young to remember, but I don’t recall teams shifting/shading/etc., nearly as much until somewhat recently. The defensive skill levels of today’s players doesn’t seem that much more impressive than the guys I grew up watching (Vizquel, Ozzie, Alomar in the infield, Griffey or Andrew Jones in the OF, etc.), and the caliber of the… Read more »

Doug
Doug
10 years ago
Reply to  brp

Fewer turf fields also contributes to fewer ground balls getting through the infield. Defensive efficiency on ground balls can be gauged by these stats: 2006: .299 BABIP, 1.15 GB/FB ratio 2013: .290 BABIP, 1.26 GB/FB ratio So, despite the hitters’ best efforts to elevate the ball, they seem to be losing that battle with the pitchers. That 9 point drop in BABIP is big – matches the high and low BABIPs over the past 20 seasons (since 1993). In the 20 years before that (1973-92) there was also only a 9 point range in BABIP (.274-.283), excepting the freak year… Read more »

bstar
10 years ago
Reply to  Doug

Doug, I just don’t see how PEDs could be the major cause of a 9-point increase in BAbip from ’92 to ’93. I’m not saying steroids weren’t a big factor in the increase in offense from ’93 on (of course they were) but I fail to see how the steroid effect could be there in full force one year (’93) and completely absent the previous year (’92). That’s just not logical. Did a couple hundred major leaguers get together over a hot stove in the winter of ’92 and decide to start injecting themselves with steroids en masse? (sorry for… Read more »

Richard Chester
Richard Chester
10 years ago
Reply to  bstar

I remember Ed saying more than once that the ball was juiced up a bit for the 1993 season.

mosc
mosc
10 years ago

I don’t buy the ball thing. Coors field, expansion itself, these were all huge factors. The next biggest factor was the general weight lifting/GNC craze of the early 90s. Prior to that, being bulked up was somewhat synonymous with being slow. Pitchers, for example, trained primarily by distance running and not weight lifting. There was a huge shift all across atheltics at all levels during those years to much more heavily favor weight training and it came to a peak in the mid 90s.

Ed
Ed
10 years ago
Reply to  bstar

Bstar – But isn’t there an even more likely explanation…namely expansion? Doesn’t offense tend to increase when there are new teams due to the lack of availability of quality pitching. And of course one of the new teams in ’93 was Colorado.

bstar
10 years ago
Reply to  Ed

Good point, Ed. I had considered expansion but didn’t think it would be that big of a factor. I’m at least slightly wrong. Here’s the years of expansion with the corresponding increase in BAbip:

1961 +.002
1962 +.002
1969 +.007
1977 +.006
1993 +.009
1998 -.001

On average, that’s about a 4 point increase in BAbip for expansion years, excluding all other factors. So yes you are right, Ed. I should have attributed part of it to that.

But then how do you explain 1987? Just saying it was a fluke doesn’t work for me.

bstar
10 years ago
Reply to  Ed

Andy, I’ve been looking for someone to agree with me about the different ball post-’92 since I came to this site, so your at-least-partial acceptance of the idea fills that need. Thanks.

no statistician but
no statistician but
10 years ago
Reply to  Ed

bstar @ 18: The ball was juiced in 1987. Have you forgotten? Wade Boggs hit 24 HR; he only made double digits one other time(11). Andre Dawson hit 49,32 his highest otherwise; Keith Moreland 27/16; George Bell 47/31; Alan Trammell 28/21; Juan Samuel 28/19; Ozzie Virgil 27/19; etc. Numerous players had their highest or second highest HR total that year; several younger players like Mark McGwire had more HRs that year than they would produce until the late 1990s; several other players had their franchise high in HRs, and only did better later when they moved to friendlier confines. I,… Read more »

Ed
Ed
10 years ago
Reply to  Ed

Bstar – You also need to account for the “Mile High Effect”. Colorado had by far the highest BABIP (.333); that alone accounts for about 2 of the 9 point increase. Beyond that, if the ball were juiced, wouldn’t you expect to see fairly uniform BABIP increases across all stadiums? Instead we see some ballparks with large increases but others with decreases. For example, BABIP decreased from .303 to .290 in Cleveland whereas it increased from .268 to .289 in Oakland. Same thing in ’87 btw. For example, BABIP in the Metrodome decreased from .305 to .283 whereas it increased… Read more »

bstar
10 years ago
Reply to  Ed

nsb @20: That was my point!! The ball was juiced!

Ed
Ed
10 years ago
Reply to  bstar

Bstar – But isn’t there an even more likely explanation…namely expansion? Doesn’t offense tend to increase when there are new teams due to the lack of availability of quality pitching. And of course one of the new teams in ’93 was Colorado.

Ed
Ed
10 years ago
Reply to  Ed

Oh sure Andy. Obviously I wasn’t doing any sort of in-depth investigation. I just like to be the contrarian so that multiple views are discussed.

Kenny
Kenny
10 years ago

The USA today piece is extraordinarily clear and certainly worth reading through to the end. Nice work Andy…

John Autin
Editor
10 years ago

Good piece, Andy. Especially timely on a day that saw the 2nd and 3rd pitcher games in this week with 1 baserunner over 9 innings. And it seems to me that the strikeout trend is finally getting some mainstream attention, so I’m hoping the conversation keeps growing. Occasional dominant games are exciting, but this brand of baseball in general is not so much fun to watch. BTW, it’s interesting that so far, the rise in K rate is concentrated among starting pitchers. The reliever K% is virtually the same as last year’s, but the SP K% is up from 18.7%… Read more »

bstar
10 years ago
Reply to  John Autin

Good point about reliever Ks not going up this year. Here’s the top 5 K/9 relievers from 2012 and how they’re faring this year in that stat, ignoring the 2013 SSS for now: Player name: 2012 SO per 9/2013 SO per 9, % change Craig Kimbrel: 16.7 / 13.2, 21% decrease Aroldis Chapman: 15.3 / 12.9, 16% decrease Antonio Bastardo: 14.0 / 7.9, 44% decrease Jason Grilli: 13.8 / 14.1, 2% increase Kenley Jansen: 13.7 / 11.5, 16% decrease So a lot of the big guns out of the ‘pen just aren’t as dominant as they were in 2012. This… Read more »

e pluribus munu
e pluribus munu
10 years ago

Great post, Andy. And your USA Today article went from one sharply reasoned point to another. I hope your prediction at the close is correct – I’ve begun to picture baseball devolving into a game of K’s, BB’s, and HR’s, with nothing else but the occasional excitement of a WP.

Mike L
Mike L
10 years ago

Nice piece, Andy. I wanted to also suggest two possible pitching trends. The first is the increase in the number of pitchers on the roster, for the primary purpose of creating platoon advantages. The second is the marked increase in the number of pitchers who just throw extremely hard.

Mike L
Mike L
10 years ago
Reply to  Andy

You did. I should have remembered to read first, write later.

Doug
Doug
10 years ago

Ed and Bstar,

The BABIP data I related are from FanGraphs.

MikeD
MikeD
10 years ago

As someone who came of age baseball wise in the 1970s, it’s not surprising to see the blip upwards during that decade. The style of hitting was probably a reaction to the 1960s, the Year of the Pitcher and the rise in turf parks where teams wanted to put the ball in play more. Hitting coaches such as Charlie Lau made their name during that time.

mosc
mosc
10 years ago

Can we break down this drop off in BIP by position? I would suspect particularly the drop off is at first base and third base chances.

prefabrykacja rozdzielnic

It’s nearly impossible to find well-informed people for this topic, but you sound
like you know what you’re talking about! Thanks

William Waryck
William Waryck
5 years ago

Which league’s rules, DH or no-DH, results in more balls in play per game?