In Part 1, we saw that whatever correlation had existed between no-hitters and strikeout rates was broken in the last 20 to 30 years. But why?
I can’t study that question in depth, but we can dip a toe in the water by starting with a simpler question: What basic measure would we expect to show the strongest correlation to no-hit rates?
It has to be batting average, right? Both are measuring the same things: how many hits, out of how many chances. No-hitters are subsets of the events that make up batting average.
And, no surprise, we do see such a correlation. The next graph is essentially the same as the last one in Part 1, with the bars again showing no-hitter rates in rolling 5-year averages — but now the red line shows batting average, instead of strikeouts. The BA is graphed against the right axis, with the values inverted, to show the inverse correlation: When batting average goes up, no-hitters go down.
No-Hitter Rates and Batting Averages (Inverted), Rolling 5-Year Avg., 1920-2012
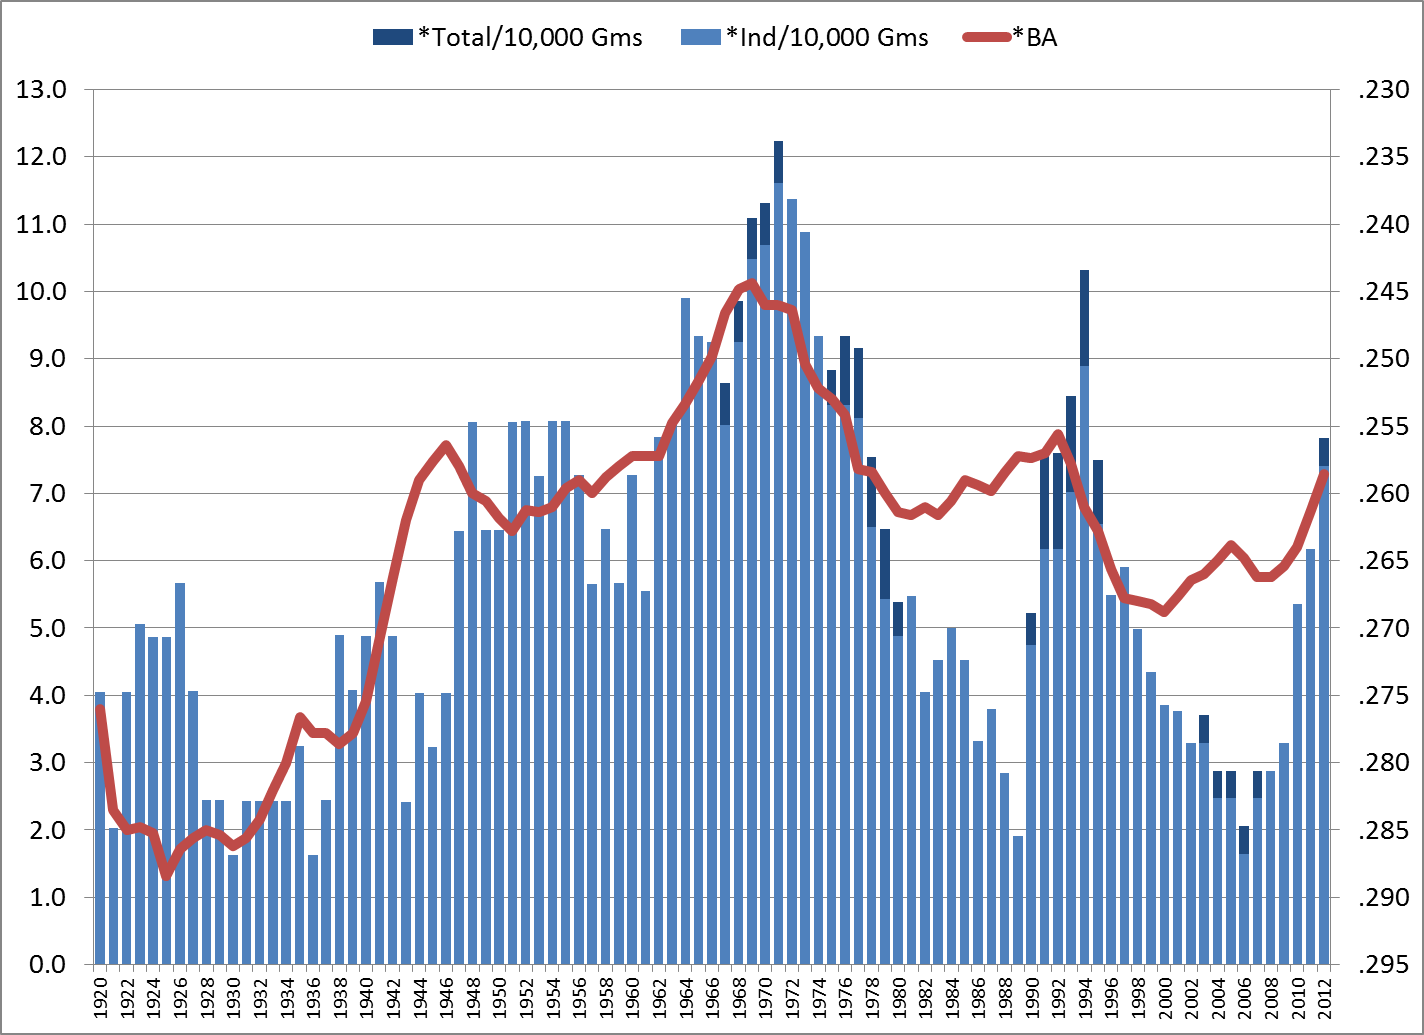
This starts out a lot like the no-hit/K-rate graph. But while the K-rate correlation crashed somewhere in the 1980s/’90s, the BA correlation staggers but stays on its feet.
And this brings up the unstated assumption behind the original theory that no-hitters correlate with K rates:
- “Strikeout rates inversely correlate with batting averages.”
It’s a natural assumption, and it was true for most of the live-ball era, at least. But a dramatic change occurred for several years in the 1990s: While K rates went up and up, batting averages also went up and up. The next graph tracks batting averages (still the red line, with values inverted) and strikeout rates (now the blue bars):
Strikeout Rates and Batting Averages (Inverted), Rolling 5-Year Avg., 1920-2012
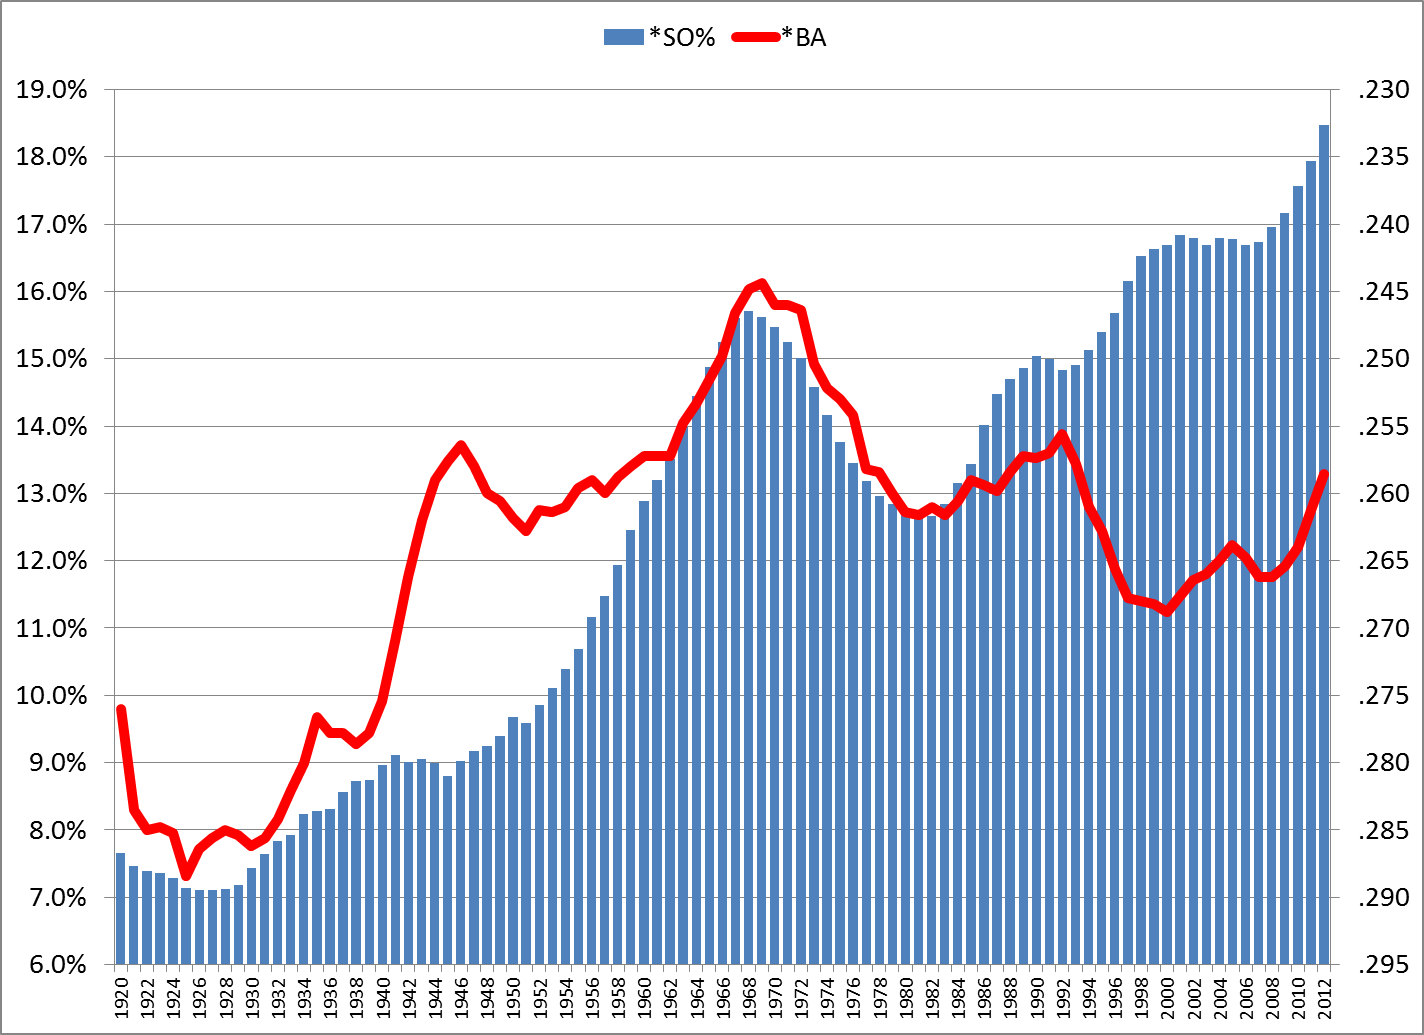
That’s a clear correlation from about 1920-90, especially strong from the late ’50s onward. But there’s a huge divergence in the ’90s.
Now, if we focus the graph on the later period, adjust the scale, and use the yearly data instead of 5-year averages, it seems possible that batting average and strikeouts have linked up again, just at a different level:
1991-2012, Strikeout Rates and Batting Averages (Inverted), By Year
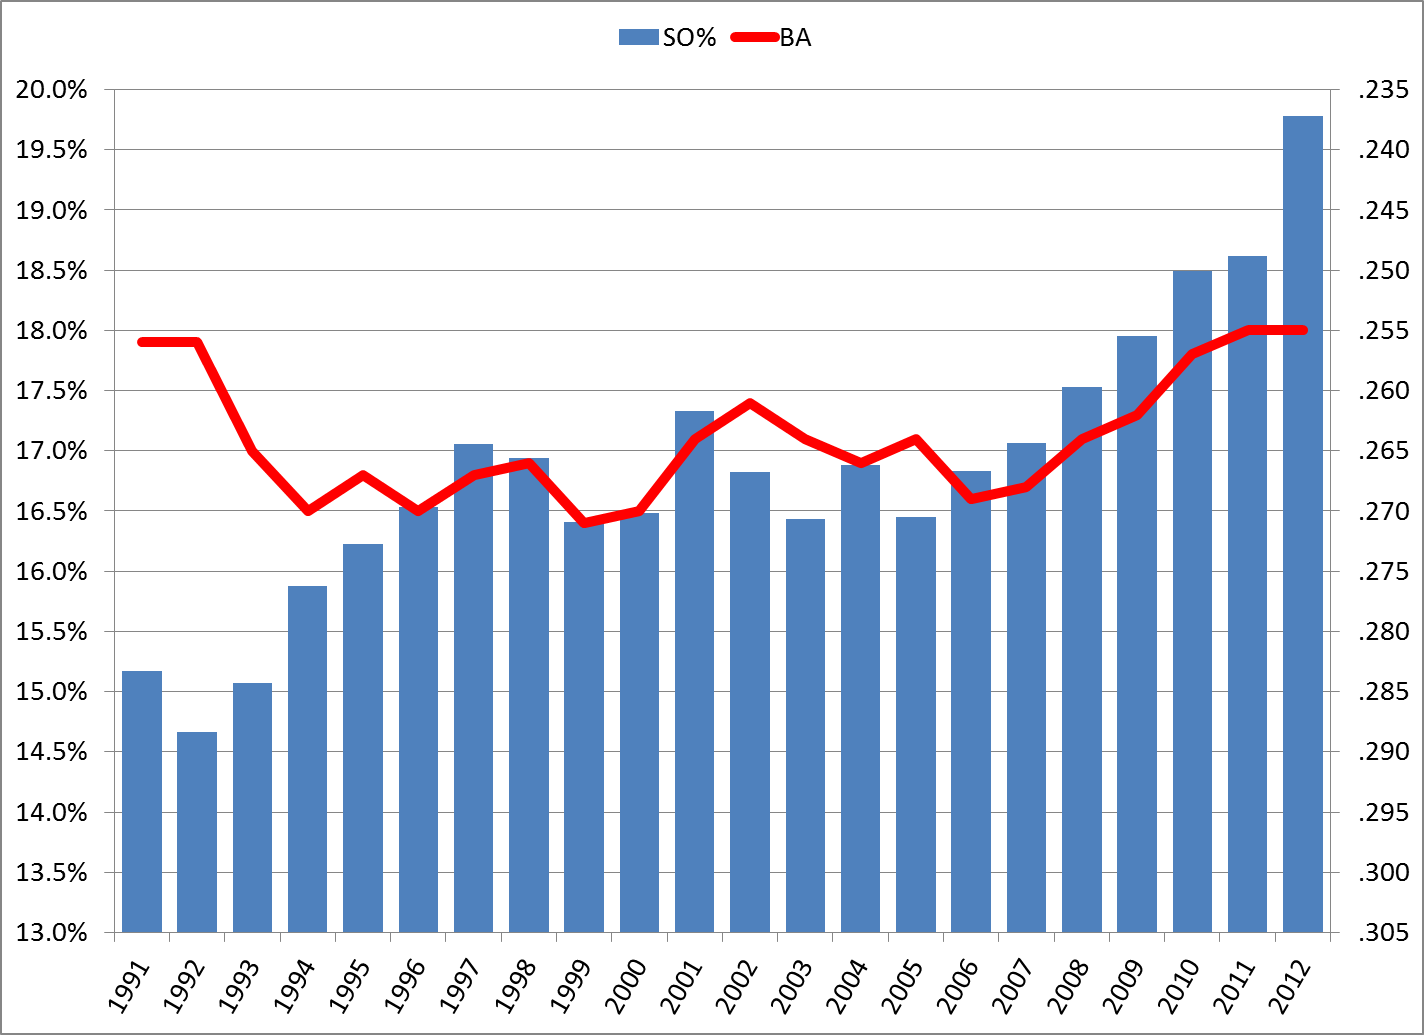
There are suggestions here, but beware of overanalyzing small changes in small samples:
- In each year from 2007-11, BA and K rates show the expected inverse correlation. But in 2012, despite one of the biggest yearly changes in K rate, BA remained flat.
- Most of the years since 1999 showed the expected correlation.
The recent data are open to interpretation. I think more time is needed to conclude a return to correlation.
But let that play out on its own. What I find most interesting is this: We now have historically normal batting averages, despite unprecedented strikeout rates:
- From 1946 through 1992, the average K rate was 13.3%, the average BA was .256.
- From 2010 through 2013/5/25, the average K rate soared to 19.2%, but the average BA was .255,
That’s a 45% increase in strikeouts, with virtually no change in batting average.
“Swing hard, in case you hit it”
If strikeouts are up, why is BA flat? Obviously, more batted balls are getting through the infield and falling in the outfield.
Consider batting average on batted balls (BAbb) — that is, for all at-bats except strikeouts. (So this is not BAbip, which also removes home runs from the equation.) From 1946 through 1992, BAbb was between .289 and .312 every year but one, averaging .301. In 1993 it shot up to .319, and has not dipped below that since, averaging .328. Last year’s BAbb was .327.
The only logical explanation for the rise in BAbb is harder hitting — unless you think this is a golden age of hit-and-runs and place-hitting, or that the data-driven changes in defensive positioning have somehow backfired.
Anyway, it seems clear that they’re swinging harder, on average, based on the swing-and-miss rate and on eyeball observation. And they’re swinging harder because of broad changes in playing conditions, compared to historic norms, that increase the relative value of hard hitting versus contact hitting. The central changes are:
- Improvements in defensive conditions (individual ability, strategic positioning, the quality of playing fields and fielders’ gloves), which reduce the value of soft contact; and
- The shape of modern bats, which concentrate weight in the barrel and thus reward hard swings. Increasing swing velocity with these bats produces a larger gain in momentum at the point of impact, compared to a similar change in swing velocity with a conventional bat.
This “swing hard” approach also includes taking more pitches that are outside the power zone, and all of it together naturally produces more strikeouts, which tends to reduce batting average. But the harder-hit balls are more likely to become hits, which roughly offsets the effect of the strikeouts.
Conclusion
Only time will tell where the relationship of strikeouts, batting average and no-hitters will go. Conditions are always changing, and there are more factors than were mentioned here.
But in simple terms, the sharp rise in strikeouts has not brought a rise in no-hitters mainly because it has not lowered the batting average. The average BA for the high-strikeout era of 1986-2012 is .263. The average BA for the rest of the live-ball era (1920-85) is .264. And it is hits, not strikeouts, that have the biggest impact on no-hitters.
Now, if you have any theory why no-hitters have actually declined in this era, let’s hear it!
Postscript
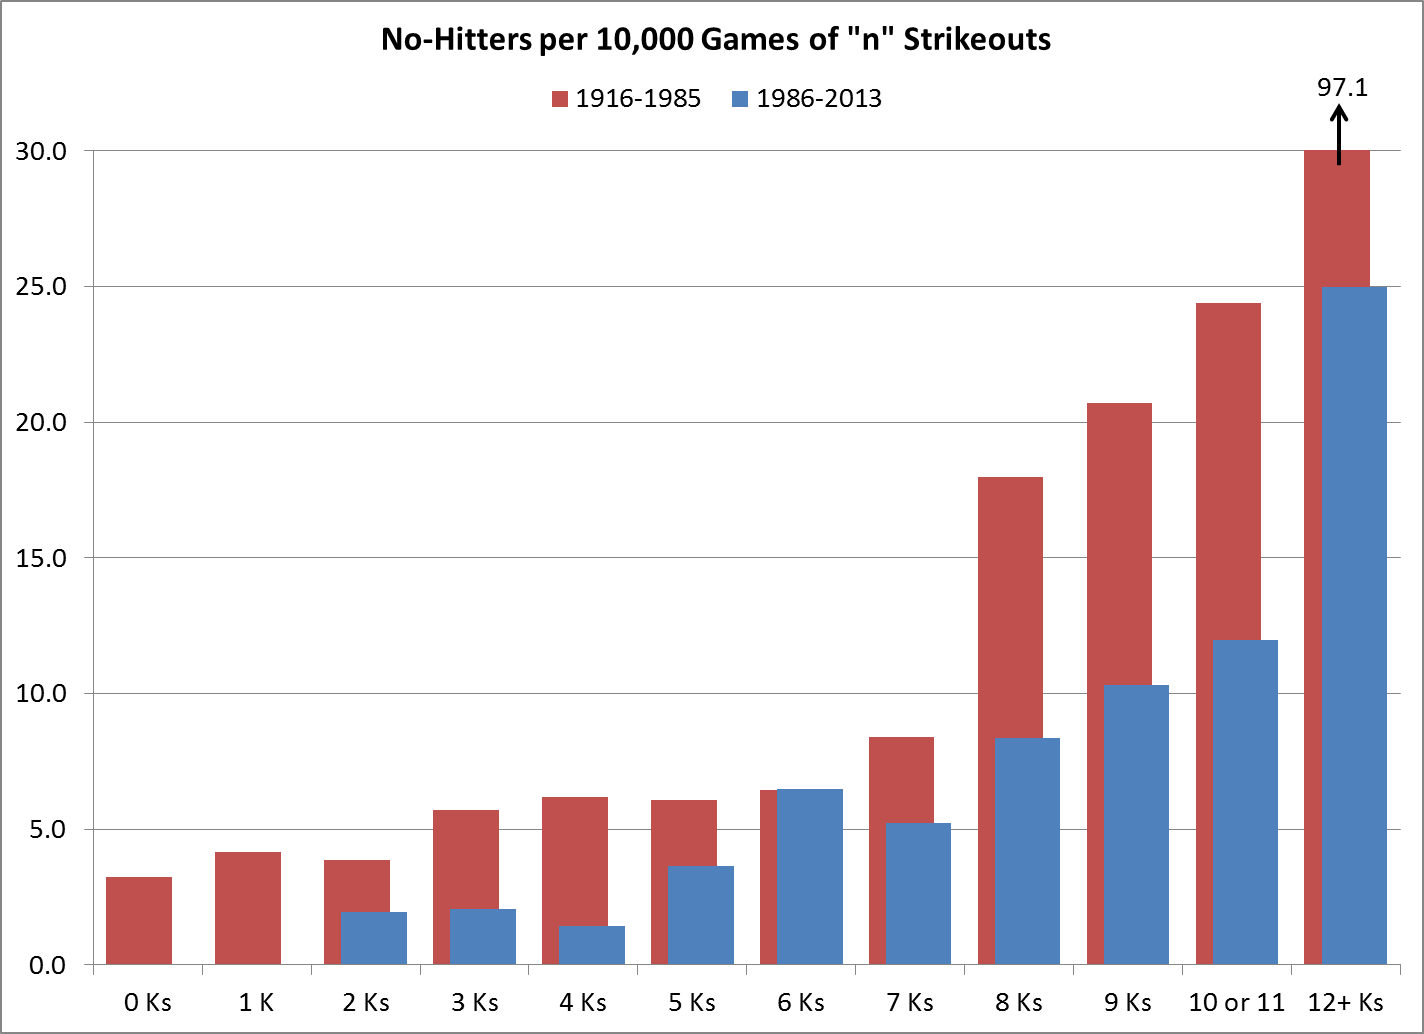
For our friend “nsb”, I’ll post this one more graph that’s on a tangent from the main subject, focusing on the game level. This shows the no-hitter rates for each strikeout total — e.g., out of all games with 5 strikeouts, how many were no-hitters? I broke it down for 1920-85 and 1986-2012, and again the rates are per 10,000 games. One thing I find interesting here is that very-high K games, 12+ strikeouts, were far more likely to be no hitters in the previous era than they are now. I’ll leave the interpretation to you.