11 thoughts on “Basic plot of SLG minus BA shows how hits are increasingly more likely to go for extra bases”
birtelcom
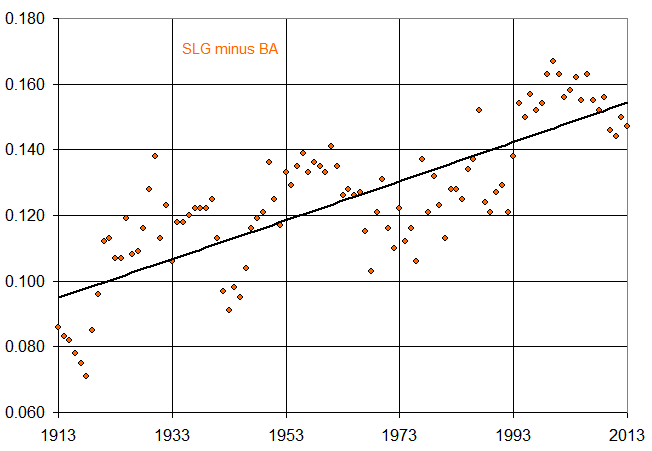
Good point, well-illustrated — the long-term trend over 100 years toward more power-hitting. (SLG minus BA is sometimes known as ISO, isolated power, which I believe Bill James first used as a separate stat and named.) The straight line you’ve drawn does though mask what seems to me a distinctive, and non-random, wave pattern that accompanies the overall trend upward.
Yeah the line is really just a basic guide. We see the typical dips, I think…in the late 1960s, pitchers started to dominate, extra-base hits went down, and that continued through the 1970s as players placed emphasis on not striking out.
1987, as always, is a weird outlier, and then right around 1993, extra-base hits start taking off.
If you want to support the hypothesis that more hits have been going for extra bases in the past 101 seasons, wouldn’t you plot the change in percentage of hits going for extra bases, versus using ISO? Because different mixes of XBH types within the total may change the relation of data points to the trendline.
I did this and while the graph looks extremely similar, the four recent years show up above the trendline rather than below it. This might be related to the declining mix of triples within XBH totals over time. Not sure.
So then this is probably a good place to talk about the relative value of a walk, single, double, triple, and home run? RE24 would lead us towards some modifications towards our total base related “slugging” number. Does anybody else share my desire for a more appropriately weighted power hitting number other than slugging?
Roughly speaking, if you set a single as equal to 1, the relative value of each type of extra base hit in comparison can be estimated around the following:
Single: 1
Double: 1.4
Triple: 1.8
HR: 2.2
That’s a lot different than SLG, which does this:
Single: 1
Double: 2
Triple: 3
HR: 4
On-base percentage treats them all the same:
Single: 1
Double: 1
Triple: 1
HR: 1
If you combine SLG and OBP into OPS, you are doing, roughly speaking, a form of averaging of the treatments of SLG and OBP, which would produce:
Single: 1
Double: 1.5
Triple: 2.0
HR: 2.5
Now notice how that result is pretty close to where we started with the approximate run-creating values of the different types of hits. This is why I like OPS — it is relatively simple, relatively intuitive and actually gets us within range of real run values.
Be that as it may, or as I was saying … This is a great graph, but keep in mind that [SLG minus BA] (or isolated power) generally tracks BA, at least in the live-ball era. Usually, when BA goes up, some of those additional hits are extra-base hits, so ISO also goes up. This can create a false impression of more power hitting.
It might be better to chart the ratio of SLG to BA, or maybe [total bases per hit], rather than the difference.
Andy is there any data to back up my hunch that there are more XBH’s at Coors Field than any other ball park? I always assumed Coors had more square feet of fair territory than any current ball field.
I know this isn’t exactly what you intended with your post but it would be interesting to correlate fair territory with the rate of extra base hits in general. Small parks offer more home runs but rob some doubles on balls off the wall. The green monster can turn a pop fly into a home run but it can also turn a home run into a single. I wonder if there is some perfect size for extra base hits?

Good point, well-illustrated — the long-term trend over 100 years toward more power-hitting. (SLG minus BA is sometimes known as ISO, isolated power, which I believe Bill James first used as a separate stat and named.) The straight line you’ve drawn does though mask what seems to me a distinctive, and non-random, wave pattern that accompanies the overall trend upward.
Yeah the line is really just a basic guide. We see the typical dips, I think…in the late 1960s, pitchers started to dominate, extra-base hits went down, and that continued through the 1970s as players placed emphasis on not striking out.
1987, as always, is a weird outlier, and then right around 1993, extra-base hits start taking off.
If you want to support the hypothesis that more hits have been going for extra bases in the past 101 seasons, wouldn’t you plot the change in percentage of hits going for extra bases, versus using ISO? Because different mixes of XBH types within the total may change the relation of data points to the trendline.
I did this and while the graph looks extremely similar, the four recent years show up above the trendline rather than below it. This might be related to the declining mix of triples within XBH totals over time. Not sure.
So then this is probably a good place to talk about the relative value of a walk, single, double, triple, and home run? RE24 would lead us towards some modifications towards our total base related “slugging” number. Does anybody else share my desire for a more appropriately weighted power hitting number other than slugging?
I’ve considered this before, has anyone ever tried the following:
(Total bases+walks+HBP)/(Plate Appearances)
Roughly speaking, if you set a single as equal to 1, the relative value of each type of extra base hit in comparison can be estimated around the following:
Single: 1
Double: 1.4
Triple: 1.8
HR: 2.2
That’s a lot different than SLG, which does this:
Single: 1
Double: 2
Triple: 3
HR: 4
On-base percentage treats them all the same:
Single: 1
Double: 1
Triple: 1
HR: 1
If you combine SLG and OBP into OPS, you are doing, roughly speaking, a form of averaging of the treatments of SLG and OBP, which would produce:
Single: 1
Double: 1.5
Triple: 2.0
HR: 2.5
Now notice how that result is pretty close to where we started with the approximate run-creating values of the different types of hits. This is why I like OPS — it is relatively simple, relatively intuitive and actually gets us within range of real run values.
A picture is indeed worth a thousand words.
Why do I feel personally chastised by this perfect wordless post? 🙂
Or should I say, strunked?
https://en.wikipedia.org/wiki/The_Elements_of_Style
Be that as it may, or as I was saying … This is a great graph, but keep in mind that [SLG minus BA] (or isolated power) generally tracks BA, at least in the live-ball era. Usually, when BA goes up, some of those additional hits are extra-base hits, so ISO also goes up. This can create a false impression of more power hitting.
It might be better to chart the ratio of SLG to BA, or maybe [total bases per hit], rather than the difference.
Andy is there any data to back up my hunch that there are more XBH’s at Coors Field than any other ball park? I always assumed Coors had more square feet of fair territory than any current ball field.
I know this isn’t exactly what you intended with your post but it would be interesting to correlate fair territory with the rate of extra base hits in general. Small parks offer more home runs but rob some doubles on balls off the wall. The green monster can turn a pop fly into a home run but it can also turn a home run into a single. I wonder if there is some perfect size for extra base hits?