The fraction of hit-by-pitches that are home run retaliation @baseballtwit

On our recent podcast (now available on iTunes–just search for High Heat Stats), Adam raised the question of variability in hit-by-pitch totals over the years, and none of us had an exact answer right away.

I’ve delved into it a bit, and was quite surprised by the results.

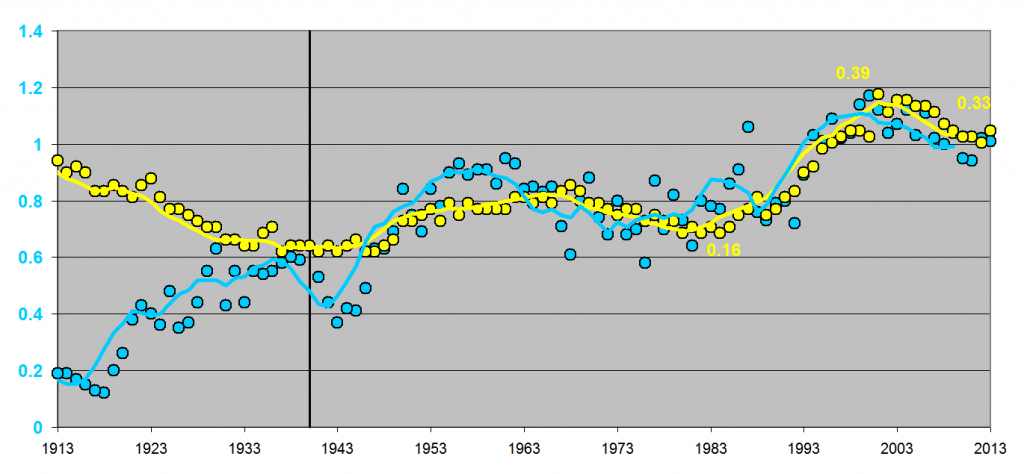
Below is a plot that shows both home runs and HBP on a per-game basis. It needs a bit of explanation, so see below for that.

HRvHBP


(click on it for a larger version)

The blue data series is home runs, per team per game. The left axis, ranging from 0 to 1.4 is for home runs only. The yellow data series is HBP, per team per game, and is scaled differently. See the yellow numbers I’ve placed showing low (0.16 in the early 1980s), peak (0.39 in 2001) and current (0.33 in 2o13). I’ve added a black like at 1940. Before that line, there appears to be no correlation (or perhaps an inverse correlation) between HR and HBP. Starting early in the 1940s, though, there is a large correlation between HR and HBP.

I found the best linear scaling of the HBP to get it to correlate with the HR data. For those who care, I used a least-squares method. It turns out that was subtracting 0.160 from each year’s HBP value, then multiplying by 2.14, we get the above plot, the least squares fit.

The interesting thing, then, is that the baseline of 0.160 is the average amount of HBP that happens every year regardless of the HR value, so this is probably pretty close to the baseline HBP level in the majors. That means that this year, roughly half of HBP are intentional (home-run retaliation or previous HPB retaliation). In the early 2000s, more like 60% of all HBP were of the intentional variety. In the early 1980s, virtual none of the HBP in the league were intentional.

Also, unrelated but interestingly, note the time lag between HR and HBP. It’s most apparently in the last 20-30 years, where there is a 1-2 year delay between changes in HR rate and HBP rate.

0 0 votes
Article Rating
Subscribe
Notify of
guest

30 Comments
Oldest
Newest Most Voted
Inline Feedbacks
View all comments
Wine Curmudgeon
10 years ago

I’m curious, given the labor unrest in the 1970s and 1980s, if that was a factor in fewer HBP. Did retaliation stop because the players were in solidarity against management?

brp
brp
10 years ago

It does somewhat make sense to pitch further inside to power hitters to get them off the plate a bit and also because it is generally difficult to get arms extended on inside pitches…

Possibly that explains a little bit about the 1-2 year delay as pitchers adjust to how they throw to power hitters? Guessing…

kds
kds
10 years ago

I don’t think your data justifies any conclusion about HBP being in retaliation for HR, or any other such causation. Crowding the plate may be good for hitting HR and obviously would lead to an increase in HBP; but is not a situation where one causes the other. I think you have to look at the data on a much deeper level to see if there is causation. For example, is the rate at which batters are hit the PA after hitting a HR clearly higher than the average rate? (And that should probably the average rate of HBP for… Read more »

Timmy Pea
Timmy Pea
10 years ago

Where do I see this podcast? Is it on youtube?

no statistician but
no statistician but
10 years ago

Just fooling around with HBPs I discovered that Mickey Mantle was hit only 13 times in his career. Couldn’t find any other high profile player with nearly so few, but I was picking names out of the air.

Comments, anyone?

RJ
RJ
10 years ago

Here’s a very NON-exhaustive list of high-profile names I came up with after fooling around with the play index. In descending order:

– Timmy’s favourite, Wahoo Sam Crawford: 23 HBP (in 10595 PAs)
– Lou Whitaker 20 (9967)
– Johnny Bench: 19 (8674)
– Eddie Murray: 18 (12817)
– Chipper Jones: 18 (10614)
– Harold Baines: 14 (11092)
– Luke Appling: 11 (10254)

no statistician but
no statistician but
10 years ago
Reply to  RJ

RJ:

A very strange group of players. What is the link? Good ducking ability?

John Autin
Editor
10 years ago
Reply to  Andy

Andy — That list is packed with switch-hitters: Murray, Jones, Davis, Mantle, Bowa, Sierra, Singleton, Wills, Templeton, McGee — 10 out of 19, vastly disproportionate.

Out of 243 hitters with 8,000+ PAs since 1901, there are 121 RHBs, 89 LHBs, and 33 switchies. The representation of switchies on your list is about 4 times their overall proportion.

It could be that there’s something inherent to switch-hitting — a level of agility, perhaps — that makes them less likely to get hit by a pitch.

Richard Chester
Richard Chester
10 years ago
Reply to  John Autin

Switch-hitters are always facing a pitcher of the opposite hand. I’m suggesting that RHP hit more RHB than LHB and LHP hit more LHB than RHB. I don’t have time to check the stats now.

John Autin
Editor
10 years ago
Reply to  John Autin

Richard @13, that sounds like the most likely explanation. Thanks. (And “duh” on me!)

Richard Chester
Richard Chester
10 years ago
Reply to  John Autin

HBP per 1000 PA for 2012:
RHP vs. RHB 10.23
RHP vs. LHB 6.51
LHP vs. LHB 11.81
LHP vs. RHB 6.15

HBP per 1000 PA for 1950:
RHP vs. RHB 5.34
RHP vs. LHB 3.90
LHP vs. LHB 7.04
LHP vs. RHB 3.17

Richard Chester
Richard Chester
10 years ago
Reply to  John Autin

Here’s a follow-up to my post #17 for the years 1945-2013.

HBP per 1000 PA:
RHP vs. RHB 8.44
RHP vs. LHB 4.89
LHP vs. LHB 9.33
LHP vs. RHB 4.55

e pluribus munu
e pluribus munu
10 years ago
Reply to  John Autin

Very happy you returned to this after three weeks, Richard. I hadn’t followed the June 15-16 exchanges and I’m glad to be pointed back to this valuable discussion. Great insight @13.

John Autin
Editor
10 years ago
Reply to  Andy

Indeed, switch-hitters do get plunked far less often, out of those with 8,000+ PAs since 1901:

RHB — 7.2 HBP per 1,000 PAs
LHB — 5.6 HBP per 1,000 PAs
SWB — 3.8 HBP per 1,000 PAs

John Autin
Editor
10 years ago
Reply to  Andy

HBP rates for actives with 1,000 PAs:

RHB — 10.8 HBP per 1,000 PAs
LHB — 8.1 HBP per 1,000 PAs
SWB — 6.3 HBP per 1,000 PAs

Did other people know this? I never did.

Brent
Brent
10 years ago

So a couple of comments. One, a few years ago on his Blog, JoePoz did something with pitch counts trying to tease some answer out. What I remember, though, from that data, was that a large number of Hit by Pitches (the largest group, I believe), came with an 0-2 count. I cannot imagine any of the intentional kind come with that count; instead that seems the product of trying to move a batter off the plate to set him for the next pitch (probably a breaking ball away). Second, having watched batters bat since about 1975, I am not… Read more »

Mike L
Mike L
10 years ago
Reply to  Brent

Andy’s list in 10 is fascinating. Other than the preponderance of switch hitters, the batters have very little else in common. There are power hitters and singles guys, there are stars (like Mantle, Foxx and Chipper) who might get extra protection because of who they are, and perfectly good but not feared players. And, most interestingly, there are hackers and guys who go deep into the count. I would have thought there was a correlation to be found (more pitches, more plunks) but in this group at least, it does’t seem to play a role. Also, looking at Richard’s @17… Read more »

Shping
Shping
10 years ago

Lots of great info, comments, and insights here. As for the weirdness of the variety in #10, I think a variety of factors might be at work too, along with switch-hitting and individual batters’ approaches. My random thoughts, for example: Pitchers’ fear of putting basestealers on base: Wills, McGee, Templeton, Cruz Pitchers’ fear of big guys charging mound: Foxx, Mantle, Murray, Singleton, Davis (I think Murray and Singleton might be only common teammates on list, by the way) And: Should we be surprised that there aren’t any famous little guys (small targets) on list, such as Rizzuto, Reese, Patek? Also:… Read more »

Richard Chester
Richard Chester
10 years ago
Reply to  Shping

Well as long as you brought it up there have been 60 players in the game searchable era, 66″ or smaller, with more than 600 PA. Only 5 of them have been plunked less than once every 500 PA. The ratio is 5/60 = 0.083. There have been 243 players with more than 8000 PA and 19 of them have been hit for a ratio of 19/243 = 0.078

Shping
Shping
10 years ago

So in that sense, little guys do get hit slightly more often, or more properly, more little guys have been hit less often than the statistical average. Your list of short guys would make a fun list too, by the way. Best 10 career WAR among guys 66″ or less?

Richard Chester
Richard Chester
10 years ago
Reply to  Shping

Here’s your fun list of top 10 career WAR leaders, 66″ or less.

Joe Sewell 53.70
Tommy Leach 45.70
Rabbit Maranville 42.80
Phil Rizzuto 40.50
Donie Bush 39.30
Hack Wilson 38.90
Miller Huggins 35.50
Topsy Hartsel 30.80
Claude Ritchey 28.00
Eddie Foster 24.10

BTW since 1901 there have been 166 players who were 66″ or less and all but 13 began their careers before 1957.

RJ
RJ
10 years ago
Reply to  Shping

Interesting point about the lack of little guys. I immediately looked up Jose Altuve, but he’s already got 9 HBP in less than two full seasons of work. I messed around a bit to see if I could find any short ballplayers who weren’t often hit. I could only come up with Topsy Hartsel (5’5″), with 12 HBP in 5793 PAs, and, among more well-known names, Hack Wilson (5’6″) with 20 HBP in 5556 PAs. That’s still more than double the rate of 6’0″ Sam Crawford though. I’d conclude height has little to do with it. I’d guess a larger… Read more »

no statistician but
no statistician but
10 years ago
Reply to  Shping

Shping:

The idea of Mantle charging the mound indicates that you are of a later era. Not that type. Also, not a particularly “big” guy.

Shping
Shping
10 years ago

I just kinda threw Mantle’s name out there as a possibility, but you’re right, I don’t know and was wondering as I posted earlier, “Did players charge the mound in anger as much back in the 1950s? or 20s?” Most likely not, but how much less often? I’m fairly sure it still happened, and would love to hear any of yours or others recollections. I know Mantle wasn’t tall, but he was muscular, and I picture him as having a temper. Is that accurate? Was he a demonstrative player, occasionally likely to spout off, argue, etc (maybe not as much… Read more »

Shping
Shping
10 years ago
Reply to  Shping

Of course we all know that Robin Ventura set the “charging the mound” movement back several years when he foolishly went after Ryan in 1993.

It’s even confirmed in the chart above: HBPs went up noticeably after that, most definitely because pitchers had less fear of being attacked after a HBP 🙂