
This past season, the Athletics’ Seth Smith passed career milestones for 2000 total PAs and 200 PAs as a pinch-hitter. Among all players meeting both those criteria since 1950, Smith is easily the majors’ most proficient pinch-hitter. Which is ironic, considering that pinch-hitting has declined to record lows, in terms of both frequency of use and the effectiveness of the strategy.
More on the decline of pinch-hitting after the jump.
Here are the majors’ top pinch-hitters on a career basis since 1950, with a minimum 2000 PAs, including at least 200 as a pinch-hitter. Players are ranked based on OPS difference as a pinch-hitter.
| Rk | Player | Split | G | OPStot | Diff ▾ | PA | PAtot | AB | R | H | 2B | 3B | HR | RBI | BB | SO | tOPS+ | ||||
|---|---|---|---|---|---|---|---|---|---|---|---|---|---|---|---|---|---|---|---|---|---|
| 1 | Seth Smith | as PH | 201 | .967 | .798 | .169 | 201 | 2300 | 168 | 30 | 53 | 12 | 5 | 6 | 40 | 29 | 45 | .315 | .413 | .554 | 142 |
| 2 | Alex Arias | as PH | 239 | .803 | .688 | .115 | 239 | 2010 | 206 | 27 | 66 | 14 | 2 | 1 | 35 | 20 | 34 | .320 | .380 | .422 | 133 |
| 3 | Ron Northey | as PH | 212 | .895 | .801 | .094 | 212 | 3566 | 170 | 21 | 48 | 7 | 1 | 9 | 61 | 37 | 19 | .282 | .401 | .494 | 124 |
| 4 | Kurt Bevacqua | as PH | 376 | .714 | .632 | .082 | 376 | 2398 | 318 | 28 | 82 | 20 | 2 | 4 | 79 | 46 | 55 | .258 | .343 | .371 | 126 |
| 5 | Cliff Johnson | as PH | 344 | .876 | .815 | .061 | 344 | 4603 | 277 | 48 | 69 | 9 | 0 | 20 | 73 | 59 | 60 | .249 | .378 | .498 | 115 |
| 6 | Derrick May | as PH | 202 | .772 | .717 | .055 | 202 | 2387 | 175 | 14 | 46 | 11 | 0 | 6 | 30 | 22 | 34 | .263 | .343 | .429 | 115 |
| 7 | Pat Kelly | as PH | 234 | .785 | .731 | .054 | 234 | 5013 | 202 | 28 | 53 | 14 | 1 | 6 | 39 | 30 | 64 | .262 | .355 | .431 | 115 |
| 8 | Rick Miller | as PH | 227 | .749 | .696 | .053 | 227 | 4440 | 191 | 23 | 54 | 10 | 3 | 0 | 29 | 32 | 35 | .283 | .382 | .366 | 115 |
| 9 | Greg Colbrunn | as PH | 260 | .850 | .799 | .051 | 260 | 3017 | 229 | 29 | 71 | 11 | 0 | 9 | 48 | 20 | 51 | .310 | .375 | .476 | 114 |
| 10 | Dave Philley | as PH | 327 | .760 | .711 | .049 | 327 | 7004 | 298 | 36 | 92 | 19 | 1 | 2 | 57 | 25 | 49 | .309 | .361 | .399 | 114 |
| 11 | Mike Aldrete | as PH | 302 | .777 | .733 | .044 | 302 | 2498 | 253 | 36 | 65 | 10 | 2 | 9 | 50 | 42 | 51 | .257 | .358 | .419 | 112 |
| 12 | Jose Pagan | as PH | 231 | .685 | .641 | .044 | 231 | 4032 | 208 | 18 | 56 | 11 | 0 | 4 | 34 | 14 | 43 | .269 | .306 | .380 | 113 |
| 13 | Dalton Jones | as PH | 351 | .681 | .639 | .042 | 351 | 2556 | 309 | 35 | 81 | 11 | 3 | 3 | 52 | 34 | 65 | .262 | .334 | .346 | 114 |
| 14 | Marlon Anderson | as PH | 343 | .744 | .705 | .039 | 343 | 3508 | 309 | 50 | 84 | 15 | 0 | 9 | 46 | 30 | 63 | .272 | .336 | .408 | 111 |
| 15 | Earl Torgeson | as PH | 264 | .842 | .803 | .039 | 264 | 6046 | 209 | 36 | 57 | 8 | 1 | 7 | 46 | 53 | 41 | .273 | .420 | .421 | 110 |
Looking just at pinch-hitting OPS instead of OPS difference (sorry, OPS+ is not available in P-I’s Split Finder), some more familiar names appear, but Smith again tops the list with room to spare (and probably still would if OPS+ was available).
| Rk | Player | Split | G | OPStot | PA | PAtot | AB | R | H | 2B | 3B | HR | RBI | BB | SO | tOPS+ | ||||
|---|---|---|---|---|---|---|---|---|---|---|---|---|---|---|---|---|---|---|---|---|
| 1 | Seth Smith | as PH | 201 | .967 | .798 | 201 | 2300 | 168 | 30 | 53 | 12 | 5 | 6 | 40 | 29 | 45 | .315 | .413 | .554 | 142 |
| 2 | Ron Northey | as PH | 212 | .895 | .801 | 212 | 3566 | 170 | 21 | 48 | 7 | 1 | 9 | 61 | 37 | 19 | .282 | .401 | .494 | 124 |
| 3 | Cliff Johnson | as PH | 344 | .876 | .815 | 344 | 4603 | 277 | 48 | 69 | 9 | 0 | 20 | 73 | 59 | 60 | .249 | .378 | .498 | 115 |
| 4 | Greg Colbrunn | as PH | 260 | .850 | .799 | 260 | 3017 | 229 | 29 | 71 | 11 | 0 | 9 | 48 | 20 | 51 | .310 | .375 | .476 | 114 |
| 5 | Willie McCovey | as PH | 302 | .848 | .889 | 302 | 9692 | 259 | 33 | 68 | 9 | 1 | 16 | 84 | 39 | 61 | .263 | .358 | .490 | 91 |
| 6 | Earl Torgeson | as PH | 264 | .842 | .803 | 264 | 6046 | 209 | 36 | 57 | 8 | 1 | 7 | 46 | 53 | 41 | .273 | .420 | .421 | 110 |
| 7 | Matt Stairs | as PH | 490 | .833 | .832 | 490 | 6024 | 416 | 72 | 105 | 20 | 2 | 23 | 87 | 64 | 109 | .252 | .357 | .476 | 100 |
| 8 | Bob Cerv | as PH | 238 | .827 | .820 | 238 | 2515 | 206 | 32 | 55 | 11 | 0 | 11 | 51 | 26 | 47 | .267 | .346 | .481 | 102 |
| 9 | Merv Rettenmund | as PH | 305 | .824 | .786 | 305 | 3074 | 239 | 39 | 66 | 15 | 0 | 5 | 39 | 59 | 40 | .276 | .422 | .402 | 110 |
| 10 | Harold Baines | as PH | 222 | .814 | .820 | 222 | 11092 | 192 | 29 | 60 | 7 | 3 | 3 | 49 | 26 | 44 | .313 | .387 | .427 | 100 |
| 11 | Smoky Burgess | as PH | 577 | .812 | .808 | 577 | 5012 | 489 | 71 | 138 | 27 | 0 | 16 | 144 | 74 | 42 | .282 | .376 | .436 | 102 |
| 12 | Jason Giambi | as PH | 210 | .807 | .919 | 210 | 8838 | 173 | 22 | 41 | 3 | 0 | 11 | 36 | 31 | 62 | .237 | .362 | .445 | 76 |
| 13 | Alex Arias | as PH | 239 | .803 | .688 | 239 | 2010 | 206 | 27 | 66 | 14 | 2 | 1 | 35 | 20 | 34 | .320 | .380 | .422 | 133 |
| 14 | Orlando Merced | as PH | 381 | .798 | .781 | 381 | 4532 | 327 | 48 | 87 | 22 | 2 | 11 | 70 | 46 | 73 | .266 | .352 | .446 | 104 |
| 15 | Johnny Grubb | as PH | 272 | .793 | .779 | 272 | 4823 | 226 | 38 | 59 | 7 | 2 | 9 | 43 | 38 | 38 | .261 | .364 | .429 | 103 |
If you’re wondering about players with 200 pinch-hit PAs in fewer than 2000 career PAs, only Ryan Spilborghs (.837) and George Crowe (.810) would crack the list above. Wallace Johnson has the highest proportion of career PAs as a pinch-hitter (min. 200 pinch-hit PAs) at 53.9%, with a .692 OPS in 339 pinch-hit appearances among only 629 career PAs.
And, for players used most frequently as pinch-hitters, some more different names.
| Rk | Player | Split | G | PA | AB | R | H | 2B | 3B | HR | RBI | BB | SO | tOPS+ | ||||
|---|---|---|---|---|---|---|---|---|---|---|---|---|---|---|---|---|---|---|
| 1 | Lenny Harris | as PH | 883 | 883 | 804 | 84 | 212 | 36 | 4 | 5 | 90 | 63 | 91 | .264 | .317 | .337 | .654 | 96 |
| 2 | Mark Sweeney | as PH | 799 | 799 | 679 | 84 | 175 | 38 | 0 | 15 | 102 | 99 | 175 | .258 | .353 | .380 | .733 | 100 |
| 3 | Greg Gross | as PH | 733 | 733 | 595 | 53 | 143 | 15 | 5 | 0 | 64 | 117 | 48 | .240 | .362 | .282 | .644 | 78 |
| 4 | Dave Hansen | as PH | 703 | 703 | 593 | 62 | 139 | 22 | 3 | 15 | 81 | 104 | 153 | .234 | .348 | .358 | .705 | 94 |
| 5 | John Vander Wal | as PH | 624 | 624 | 533 | 70 | 126 | 33 | 4 | 17 | 95 | 87 | 153 | .236 | .342 | .409 | .751 | 90 |
| 6 | Manny Mota | as PH | 592 | 592 | 497 | 69 | 149 | 16 | 3 | 4 | 115 | 61 | 47 | .300 | .373 | .368 | .741 | 100 |
| 7 | Smoky Burgess | as PH | 577 | 577 | 489 | 71 | 138 | 27 | 0 | 16 | 144 | 74 | 42 | .282 | .376 | .436 | .812 | 102 |
| 8 | Orlando Palmeiro | as PH | 525 | 525 | 456 | 69 | 120 | 24 | 2 | 3 | 49 | 50 | 65 | .263 | .337 | .344 | .682 | 94 |
| 9 | Jim Dwyer | as PH | 501 | 501 | 419 | 54 | 101 | 17 | 2 | 10 | 74 | 67 | 78 | .241 | .339 | .363 | .702 | 87 |
| 10 | Gates Brown | as PH | 499 | 499 | 422 | 66 | 106 | 14 | 5 | 16 | 73 | 70 | 59 | .251 | .357 | .422 | .779 | 109 |
| 11 | Terry Crowley | as PH | 494 | 494 | 423 | 47 | 109 | 19 | 1 | 5 | 69 | 63 | 51 | .258 | .350 | .343 | .693 | 93 |
| 12 | Matt Stairs | as PH | 490 | 490 | 416 | 72 | 105 | 20 | 2 | 23 | 87 | 64 | 109 | .252 | .357 | .476 | .833 | 100 |
| 13 | Greg Norton | as PH | 489 | 489 | 413 | 47 | 96 | 21 | 2 | 13 | 73 | 72 | 122 | .232 | .348 | .387 | .735 | 95 |
| 14 | Jerry Lynch | as PH | 487 | 487 | 430 | 55 | 114 | 13 | 3 | 18 | 90 | 51 | 90 | .265 | .344 | .435 | .779 | 98 |
| 15 | Jose Morales | as PH | 486 | 486 | 446 | 45 | 123 | 24 | 3 | 12 | 93 | 31 | 86 | .276 | .324 | .424 | .747 | 101 |
That Lenny Harris would top this last list is very telling. This is a player with a career .667 OPS who only twice passed 100 OPS+ (at 102 and 103) in 15 seasons of 100+ PA. And, it’s not like he had a particular knack for the job, as he wasn’t able to match even that very modest OPS performance as a pinch-hitter. Yet, major-league managers thought he was the team’s best available option for almost 900 PA. How sad.
So, how did pinch-hitting decline to the point where the likes of Lenny Harris would be the majors’ all-time leader in pinch-hit appearances? The answer probably isn’t a surprise. The ever-increasing use of relief pitchers has led to bloated pitching staffs and shorter benches. Benches so short, in fact, that there’s not room anymore for a pinch-hitting specialist (much less a left-hand hitting and right-hand hitting pinch-hit specialist, as was common 30 or 40 years ago). Certainly not after the roles of reserve catcher, reserve infielder and reserve outfielder have been filled (what a marvelous luxury today to have a player fill one of those roles and also be an effective pinch-hitter).
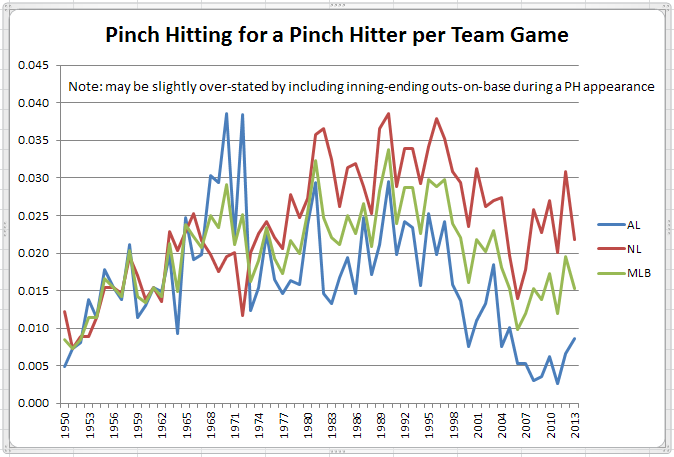
A picture tells a thousand words, so let’s go right to the charts.
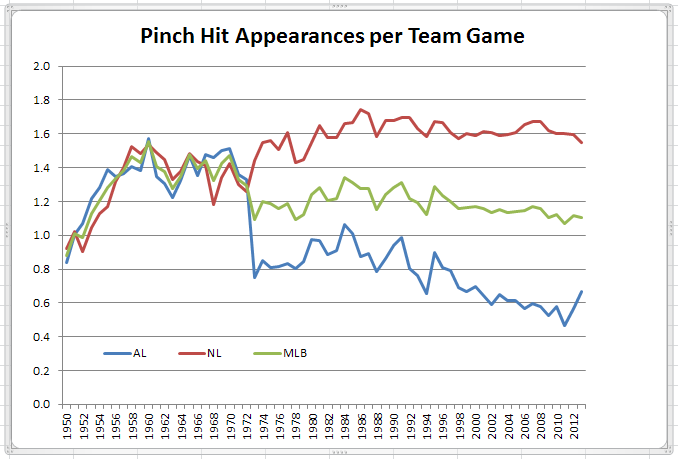
So, the leagues were pretty much in lock step until the AL numbers predictably fell off the table when the DH was introduced. Then, both leagues stayed fairly stable until the AL began a steady decline in the early 1990s.
So, you might think the decline of the pinch-hitter is just an AL thing? Let me add another line to the chart and we’ll see if you still think so.
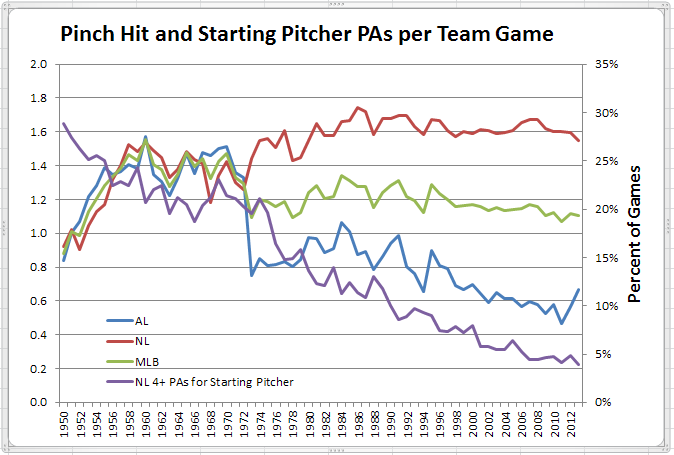
The only thing falling faster than AL pinch-hit appearances are NL starting pitchers lasting deep into games. Given that context, NL pinch-hit appearances should have risen substantially. Except they couldn’t because the bodies on the bench aren’t there. Thus, the ever-increasing use of the double-switch as a more bench-effective substitute for pinch-hitting for the pitcher.
So, less pinch-hitting. But, what about the effectiveness of pinch-hitting as a strategy? Sorry, more bad news.
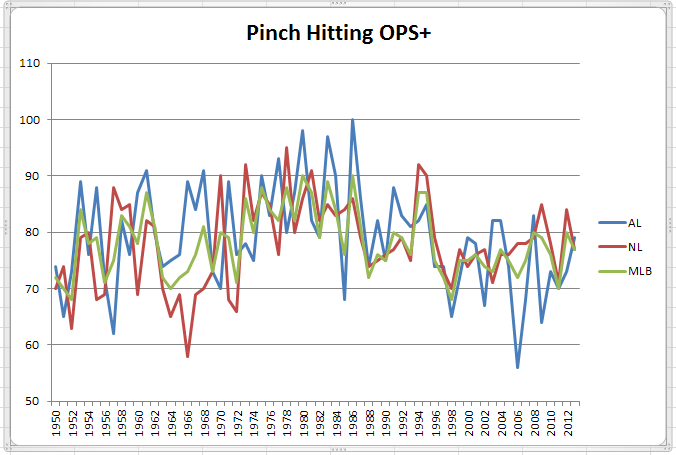
Since peaking at close to league average performance in the mid-1980s, pinch-hitting OPS+ performance has declined to the point where the guy coming up to bat (unless it’s the pitcher) couldn’t be any worse (and is probably quite a bit better) than any available pinch-hitter, particularly in the AL. And, the NL performance isn’t a lot better, especially considering it’s measured against a league average that includes pitchers’ batting. So, no real surprise that managers are using fewer pinch hitters.
But, why are pinch-hitters performing so poorly? Aside from the fact that few pinch-hitters specialize in that role, there’s this.
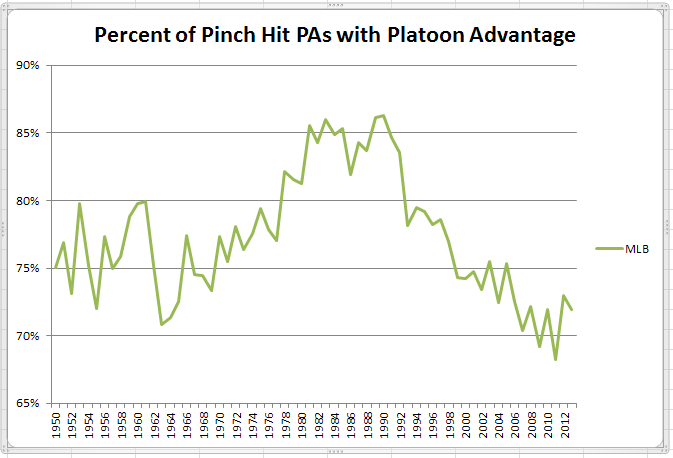
Sorry there are no league totals in P-I’s event finder, but you get the idea. With huge pitching staffs and tiny benches, the defense has the upper hand in pinch-hitting matchups (an advantage only slightly diminished by today’s practice of having rigidly defined pitching roles in the 8th and 9th innings).
One more indicator of the lack of pinch-hitting options available to today’s managers.
Yup, the old cat-and-mouse game of sending up the “sacrificial” pinch-hitter with the expectation that that will result in the other manager going to his bullpen. Has never really happened as much as you might think – at its peak, maybe 5 or 6 times a season per team. But, it’s all but disappeared from the AL today, at less than once a season per team.