
No, not that Shrek. This one is catcher Ossee Schrecongost (I ran into Ossee in my last quiz, by dint of his 3 qualifying seasons with matching HR and triples: one with deuces; and two with singletons). Ossee played around the turn of the 20th century (and happily also went by the shorter “Schreck”). As I scrolled down his player page, I was struck by this:
So, six straight seasons leading AL catchers in putouts (i.e. mostly catching his pitchers’ strikeouts) despite ranking mostly in the middle of the pack in games caught (excepting his one season leading the AL, Schreck played between 16 and 29 games fewer than the catcher placing first in games caught).
More on strikeout-dominant pitching staffs after the jump.
Schreck played those seasons for Connie Mack’s Athletics, who indeed sported some outstanding pitching staffs, led by HOFers Rube Waddell, Eddie Plank and Chief Bender. The Athletics led the AL in strikeouts for 9 consecutive seasons, starting in 1902. Note, though, that it wasn’t just their HOFers putting up the high strikeout totals, as can be seen from the list below (success does breed imitation, it would seem).
| Rk | Player | IP | From | To | Age | G | GS | CG | SHO | GF | W | L | BB | SO | ||||||
|---|---|---|---|---|---|---|---|---|---|---|---|---|---|---|---|---|---|---|---|---|
| 1 | Eddie Plank | 2655.2 | 4.66 | 1.99 | 1.096 | 1902 | 1910 | 26-34 | 339 | 314 | 257 | 36 | 20 | 185 | 118 | .611 | 586 | 1375 | 2.29 | 120 |
| 2 | Rube Waddell | 1869.1 | 7.59 | 2.38 | 1.062 | 1902 | 1907 | 25-30 | 251 | 212 | 168 | 37 | 29 | 131 | 82 | .615 | 495 | 1576 | 1.97 | 146 |
| 3 | Chief Bender | 1799.0 | 5.45 | 2.05 | 1.056 | 1903 | 1910 | 19-26 | 251 | 201 | 172 | 24 | 47 | 125 | 76 | .622 | 409 | 1090 | 2.32 | 114 |
| 4 | Jack Coombs | 1017.1 | 4.99 | 3.40 | 1.151 | 1906 | 1910 | 23-27 | 147 | 115 | 86 | 26 | 25 | 66 | 44 | .600 | 384 | 564 | 2.05 | 122 |
| 5 | Jimmy Dygert | 986.0 | 5.32 | 3.50 | 1.198 | 1905 | 1910 | 20-25 | 175 | 105 | 62 | 16 | 49 | 57 | 49 | .538 | 383 | 583 | 2.65 | 97 |
| 6 | Weldon Henley | 665.2 | 4.03 | 2.84 | 1.196 | 1903 | 1905 | 22-24 | 90 | 74 | 57 | 7 | 15 | 31 | 38 | .449 | 210 | 298 | 2.93 | 95 |
| 7 | Andy Coakley | 530.2 | 4.51 | 2.71 | 1.229 | 1902 | 1906 | 19-23 | 74 | 61 | 43 | 5 | 12 | 31 | 23 | .574 | 160 | 266 | 2.51 | 110 |
| 8 | Cy Morgan | 519.1 | 3.73 | 3.26 | 1.067 | 1909 | 1910 | 30-31 | 64 | 60 | 44 | 8 | 2 | 34 | 23 | .596 | 188 | 215 | 1.59 | 150 |
| 9 | Rube Vickers | 423.0 | 4.30 | 2.17 | 1.111 | 1907 | 1909 | 29-31 | 81 | 41 | 25 | 7 | 31 | 22 | 23 | .489 | 102 | 202 | 2.51 | 101 |
| 10 | Harry Krause | 346.1 | 5.43 | 2.47 | 1.054 | 1908 | 1910 | 19-21 | 52 | 34 | 27 | 9 | 12 | 25 | 15 | .625 | 95 | 209 | 1.95 | 124 |
Philadelphia logged three pennants (incl. one WS title) and three 2nd place finishes in those 9 seasons, plus a 2nd WS title in 1911 when the As finished just a handful of strikeouts behind the White Sox staff.
How often has a team led its league in strikeouts for 5 or more consecutive seasons? Possibly more than you might think. Here’s the list.
[table id=171 /]
.
As with the Athletics at the beginning of the 20th century, a good number of the teams on this list were league champions. But, long streaks leading the league have become much less common, obviously because there are more teams, but also because of free agency and the ability of just about every team to be buyers in that market when they want to.
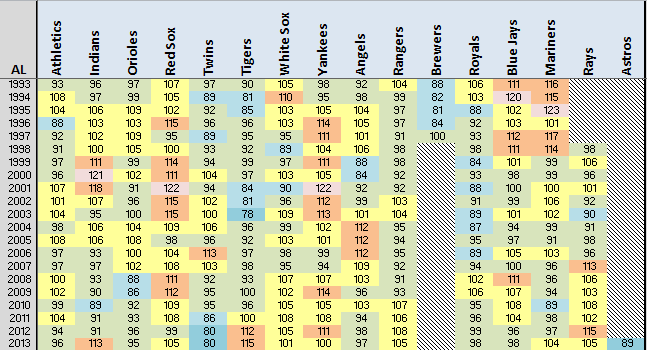
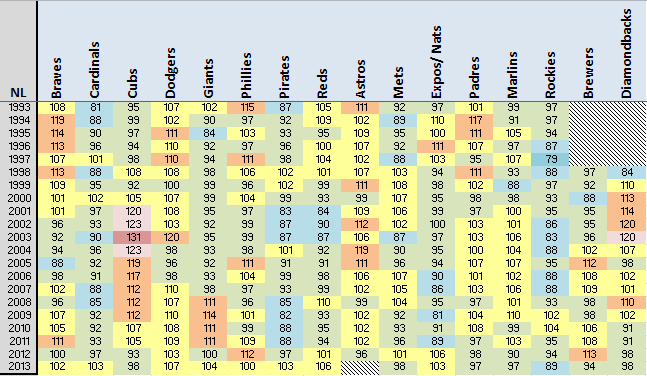
How has your team fared? Here are the rankings by season, since 1901.
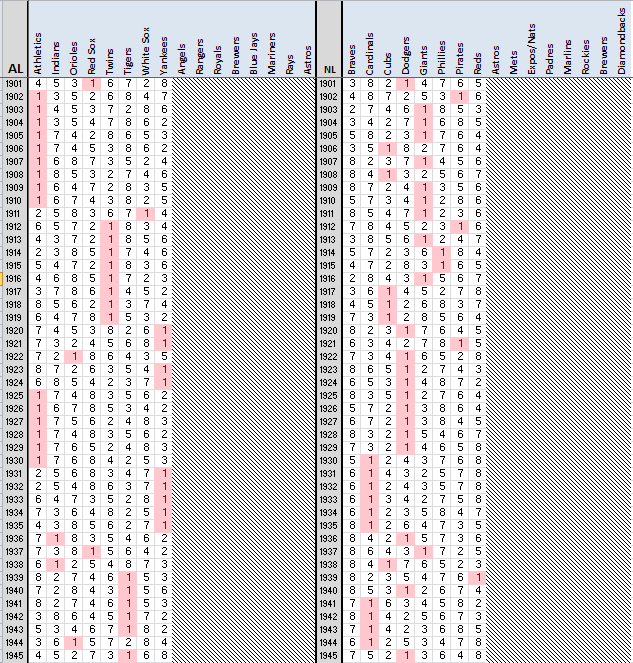
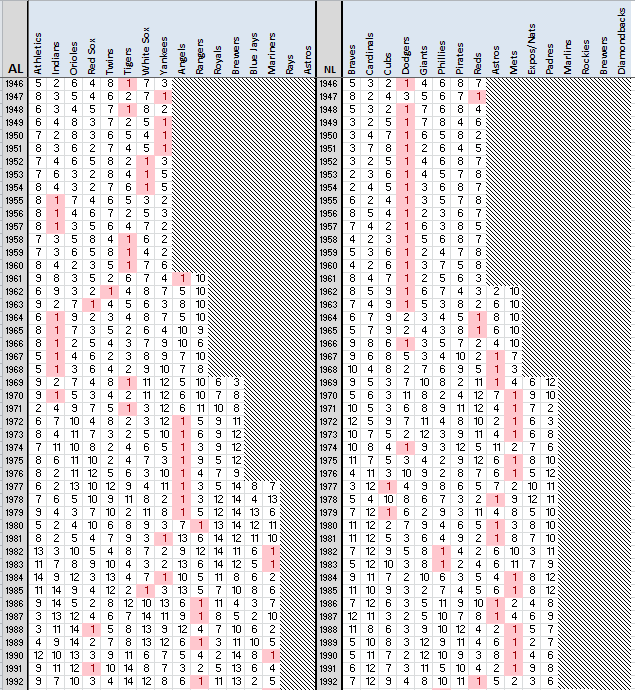
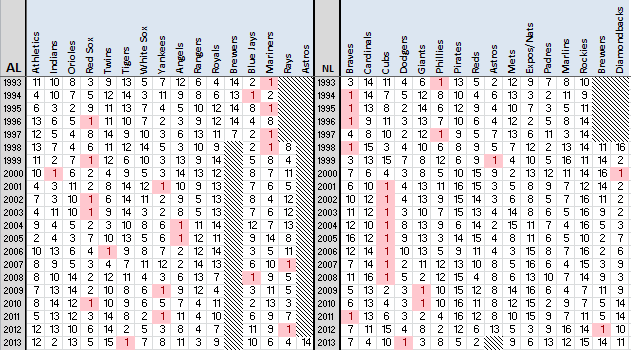 But rankings can be deceptive. They don’t tell you by how much a team led its league. To look at that question, I’ve calculated K/9+ for each team and season, being 100 * (team K/9 divided by league K/9). Those results are color-coded from lowest to highest ratings in blue-green-yellow-orange-pink-red order.
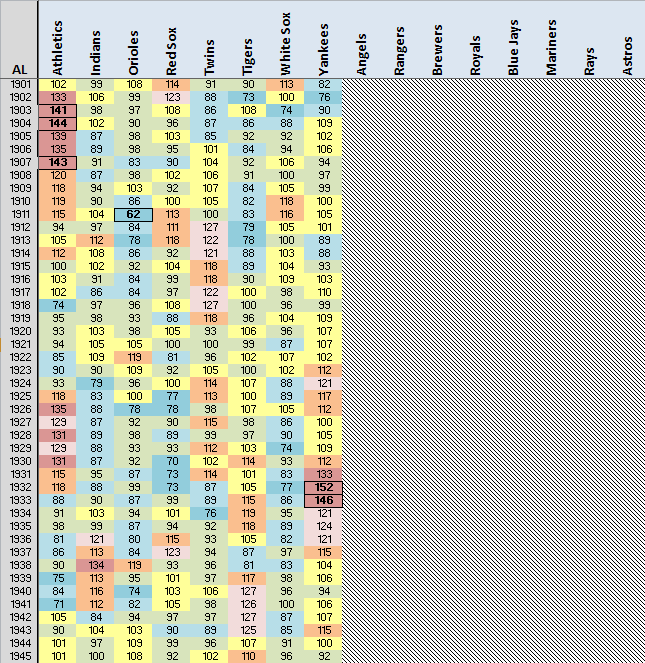
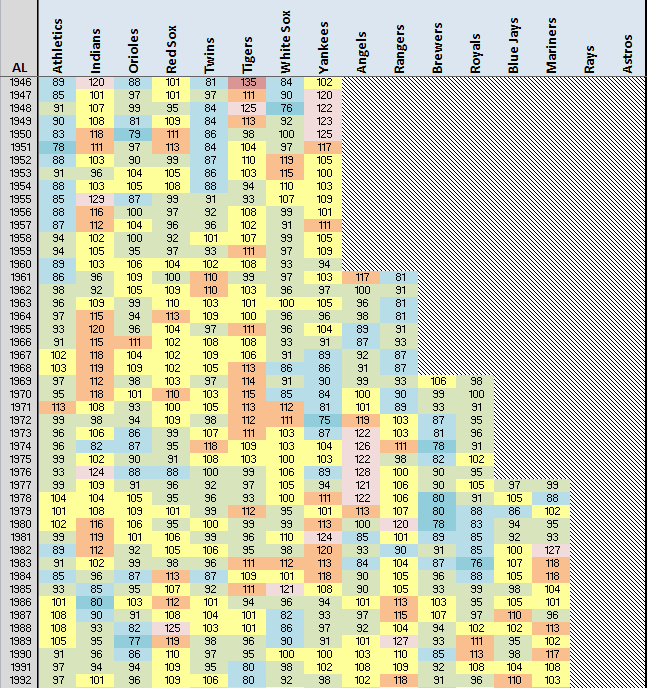
 It’s not for nothing that old Schreck led the league in putouts every year. His Athletics dominated the league in strikeouts as no other AL team has since. But, how do those Athletics compare to the post-war Dodgers and their 16-year run leading the senior circuit.
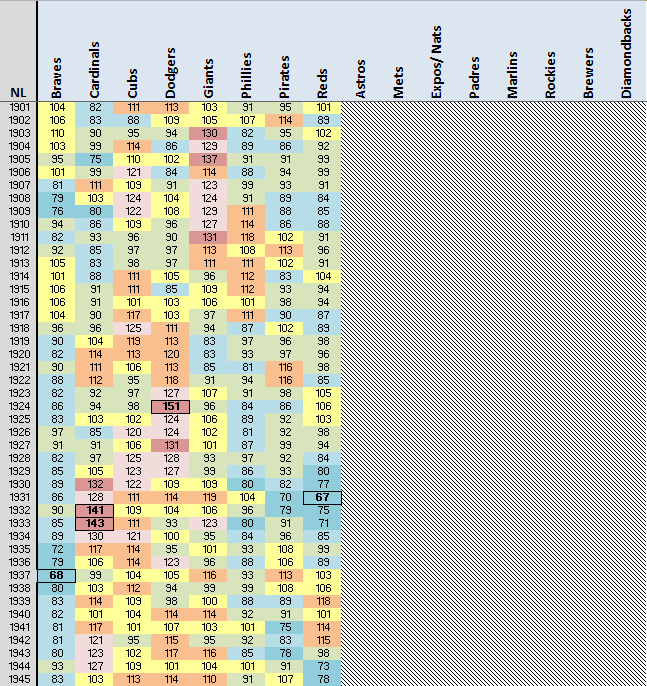
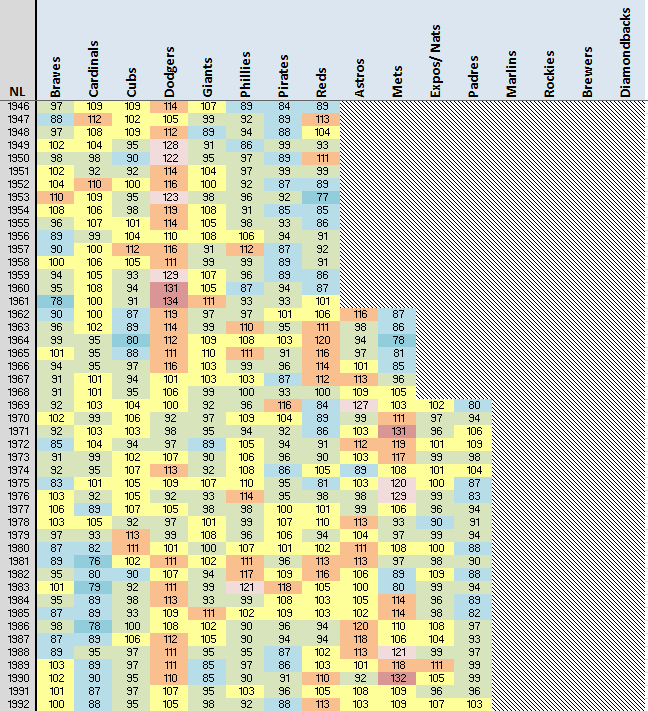
 Actually, those early Athletics teams compare very favorably. Despite 16 years leading the NL, the Dodgers look quite pedestrian in comparison.
Incidentally, if you’re wondering what happened to the red that stood out in the early years but has all but disappeared now, more teams will tend to limit the influence of outliers (high or low) on league averages. As well, the higher that strikeout rates go, the harder it will be for a team to be 20% or 30% higher still. Plus, with players changing teams today as frequently as they do, the likelihood diminishes for a team to keep the same pitchers or the same type of pitchers for long stretches.
Will we have another team that will post strikeout rates 40% higher than league average and do it for several years running? It would seem not. In fact, we’re waiting for a team to do that in even one season – no team has reached a 135 score since the 1946 Tigers.