
Following up from an earlier post on starting pitchers, this post looks at 2014 results for relief pitchers for metrics provided by Pitch FX, the measurement system used by MLB to track every pitch thrown in every major league game. Part 1 looks at reliever results based on pitches thrown in the strike zone and outside of it. Part 2 will look at results based on pitch type, movement and velocity.
Using PitchFX data available at FanGraphs.com, I’ve compiled a series of tables and charts highlighting the 2014 pitching leaders in a variety of statistical categories. Some of the results will make a lot of sense but others may be more surprising. Take a look after the jump.
For this analysis, I’ve focused on pitchers who relieved in 80% of their 2014 games and logged more than 50 IP. There were 138 such pitchers, none of whom pitched 100 innings (there were also no 100 IP relievers in 2013, making the last two years the first consecutive seasons since 1911-12 with no relievers logging 100 IP).
Starting with the basics, here are the top 10 and bottom 10 pitchers in pitch distribution, or % of pitches that are balls, called strikes, swinging (and missing) strikes, and pitches contacted (foul or fair). I’ve ordered the last category by highest to lowest % of pitches – I leave it to your judgment whether a high or a low number is a good or bad result.
[table id=238 /]
.
Dan Otero and Pat Neshek both make the top 10 in lowest ball and highest called strike rates, while Kenley Jansen, Koji Uehara and Sean Doolittle double with a top 10 in lowest ball and highest swinging strike rates. Glen Perkins and Dan Otero are top 10 in lowest walk and highest contact rates, while Aroldis Chapman and Greg Holland double with top 10 in highest swinging strike and lowest contact rates.
Burke Badenhop has the unusual markers of the highest called strike and lowest swinging strike rates, indicating that Badenhop can keep hitters off-balance or that hitters are quite confident of making contact with his offerings and thus are willing to take a strike to get a pitch more to their liking. Joaquin Benoit is the opposite, making top 10 in lowest called strike and highest swinging strike rates, and indication that hitters don’t want to fall behind him, but do so nonetheless. Similarly, Aroldis Chapman is tops in highest swinging strike and lowest contact rate, no surprise to most NL hitters.
Next, here are the top 10 and bottom 10 in swing rates and pitches in the strike zone. Swing rates are ordered highest to lowest for pitches outside the zone, and lowest to highest for pitches in the zone. % of pitches in the zone are ordered lowest to highest – again I leave to your judgment whether a high or low result is good or bad.
[table id=239 /]
.
Mark Melancon is the clear leader in getting hitters to chase his offerings outside the zone. As a result, he also makes the top 10 in the lowest proportion of pitches in the zone, a double shared with Zach Putnam. Less clear is why Sean Doolittle has the third highest proportion of pitches in the zone given that only Melancon is better than Doolittle in getting hitters to chase.
Burke Badenhop has a top 10 placement in lowest swing rate outside the zone, thus requiring one of the highest proportions of in zone pitches. Luckily for Badenhop, he is evidently able to keep hitters off balance, also recording a top 10 in lowest swing rate on pitches in the zone. Brad Ziegler has no trouble getting hitters to swing on his in zone offerings, so he sensibly limits them, placing first in both of those metrics. Kenley Jansen is less circumspect, with high rates of swings and pitches in the zone, something you can get away with if you’ve got Jansen’s stuff.
Finally, here the top 10 and bottom 10 in contact rate (measured as % of swings) for pitches inside and outside the strike zone, and overall. In all cases, I’ve ordered from lowest to highest rates.
[table id=237 /]
.
Nobody touches Aroldis Chapman’s offerings, whether in the zone or not. But, Brett Cecil is a surprise second place on overall contact rate due to his success in getting hitters to swing and miss out of the zone. Cecil is in good company, with Andrew Miller, Greg Holland, Jaoquin Benoit and Pedro Strop also making top 10 in lowest contact rate outside the zone and overall.
Burke Badenhop is at the other end of things, the only reliever with an overall 90% contact rate, including a whopping 96% on pitches in the zone. But, he makes it work, logging a respectable 5.1 SO/9 (more than half caught looking) in 70 appearances last season while posting career bests of 2.29 ERA and 169 ERA+. Dan Otero, LaTroy Hawkins and James Russell all had similar success despite high contact rates. But pitching to contact doesn’t work for everyone. Just ask Red Sox fans who delighted with Badenhop’s success but also had to endure Craig Breslow’s travails last season.
So, the tables above give some idea of the extremes in the various metrics. Those who would like to look at results for all 138 pitchers can find those data here.
To give some idea of the inter-relationship between these metrics, I’ve plotted them against each other in various combinations.
Let’s start with % of pitches in the zone compared to swing rate on pitches outside the zone. The premise here is that pitchers who can get batters to chase pitches outside the zone can pitch out there more and inside the zone less. However, those who can’t entice batters with their junk offerings will be forced to come into the zone more, often a perilous proposition.
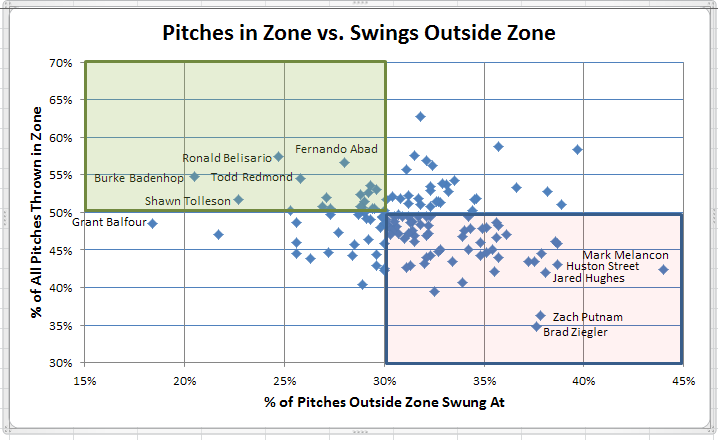
The general trend is fairly clear – there’s an inverse relationship between swings on pitches outside the zone and pitches thrown inside the zone. I’ve highlighted red and green areas of the chart indicating, from a batter’s perspective, which are the green light pitchers and which are not, highlighting a handful of such pitchers in each group.
Next are pitches thrown inside the strike zone compared to swing rate on those pitches. From the previous chart, we saw that pitchers with lower swing rates on pitches outside the zone are forced to make more pitches inside the zone. To do that effectively, pitchers need to keep batters off balance to reduce good swings at desirable offerings. But, can they do that?
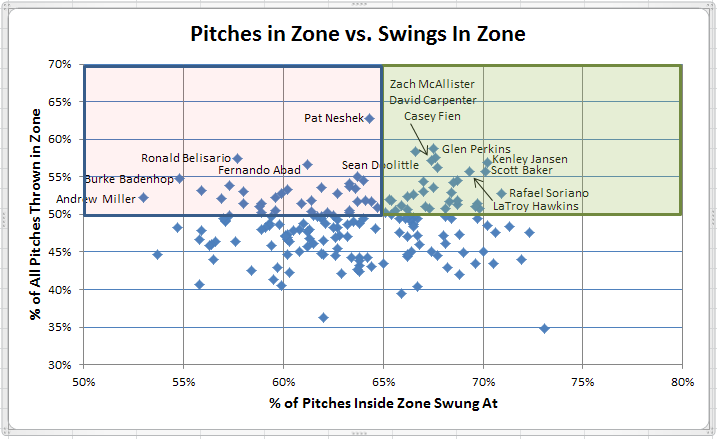
The chart above indicates that it is a rare pitcher who can keep batters off-balance that way as swing rates on pitches in the strike zone are tightly clustered in a similar pattern, regardless of how often a pitcher pitches in the zone.
Next is contact (measured as a % of swings) outside the zone vs. swings outside the zone.
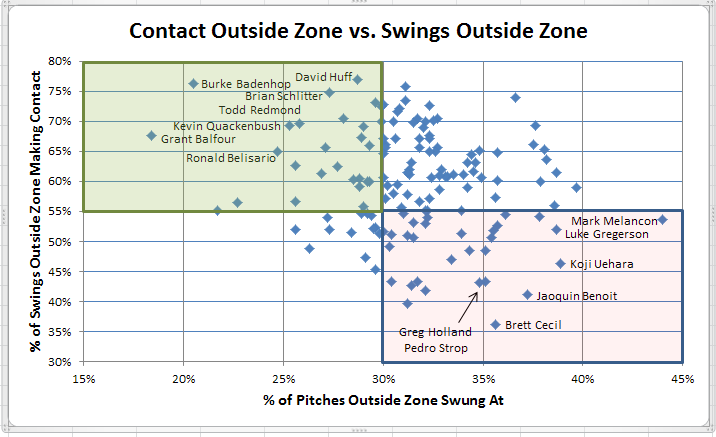
The relationship here is inverse, with pitchers who can entice batters to chase pitches outside the zone achieving lower contact rates on those swings while pitchers who are less adept at tempting batters generally have higher contact rates when those batters do swing. Note that while contact may not always be bad, swinging and not making contact is still always preferable for a pitcher.
Now, the same thing for swings on pitches inside the zone. Look closely at the scales here as the ranges are quite small.
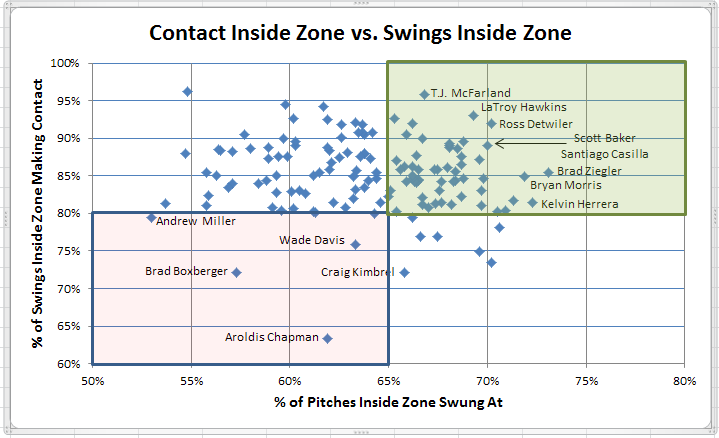
As indicated by the red area, there are very few pitchers who can limit swings in the zone AND also limit contact on those swings.
Finally, here is contact inside and outside the zone.
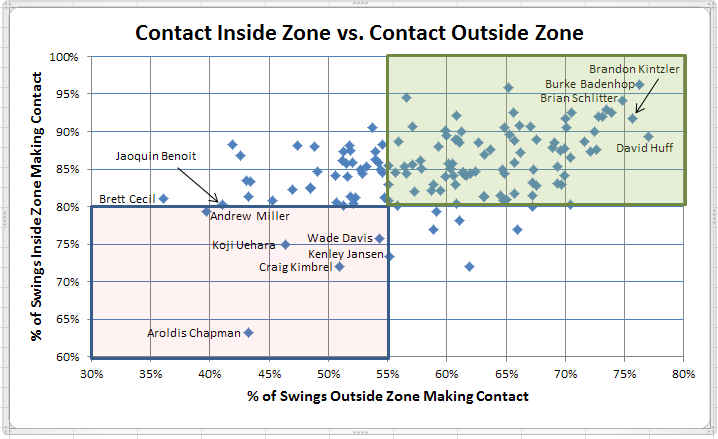
Most of the points are in the top half of the chart indicating that most pitchers pitch inside the zone at their peril as hitters do have a high probability of making contact with such offerings. The best pitchers have lower contact rates both inside and outside the zone while very few can combine a high contact rate outside the zone with a low rate inside the zone.
It’s your turn now. What results surprised you?