
There’s the Sultan of Swat, Hammerin’ Hank, and one of the Bash Brothers. All three certainly didn’t get their nicknames from being slap hitters, knocking singles through the infield. What they do have in common is that Babe Ruth, Hank Aaron, and Mark McGwire are all part of the top 10 all-time home run list for Major League Baseball. Deep fly balls and rocket line drives soaring over the fence, are what fans best remember these 10 players by, but the real question is, who out of the top 10, is the greatest overall hitter of the group? Do you go with the player who had the highest career batting average? That would be Ruth, who hit .342 for his career. Or is it the player who had the most career hits out of the greatest home run hitters in baseball history? Here, Aaron reigns supreme, with his 3,771 career hits to go along with 755 home runs.
The offseason is a time for awards and other sports fans getting mad that we’re still talking about baseball. But, part of the beauty of baseball is that is seems to never stop. In the offseason, the hot stove is turned up with free agent and trade rumors that have to do with a team’s future, yet we still love to talk about the past. In this case, the hot stove is a wood burner of the past.
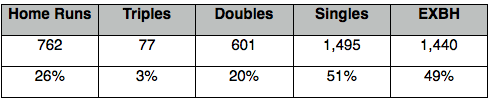
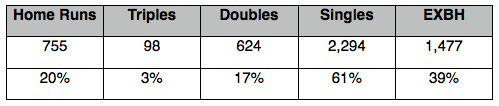
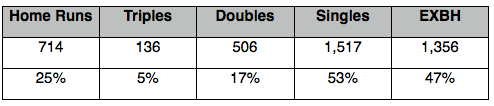
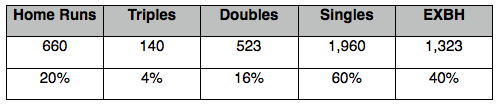
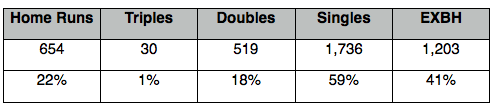
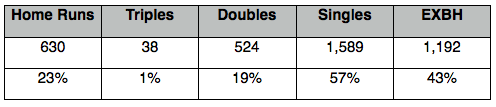
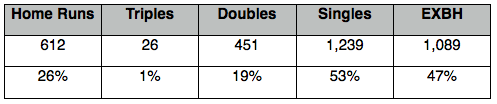
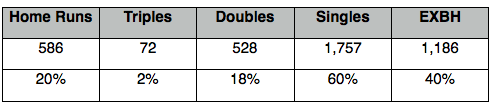
Perhaps, there is a different way to look at this question. I broke down the hit rates for each player in the top 10, showing what type of hit they produced most and least often over the duration of their career.
There are, of course, many factors that play into these results, including eras, stadium dimensions, and the stats below are only based on balls hit in play including home runs, so walks are not a part of this system. To add to the factors, Barry Bonds, Alex Rodriguez, Sammy Sosa, and McGwire have all been tied to Performance Enhancing Drugs during parts of their careers. While those players may have had enhancements to help their game, Ruth and Mays had disadvantages. Ruth didn’t play over 100 games, giving him more chances for hits, until his sixth season in 1919. Mays, missed the entire 1953 season at age 22 for military service time, and then went on to win the 1954 National League MVP where he had 195 hits and 41 home runs.
*EXBH = Extra Base Hits
1. Barry Bonds, 762 Home Runs, 2,935 Hits
3. Babe Ruth, 714 Home Runs, 2,873 Hits
4. Willie Mays, 660 Home Runs, 3,283 hits
5. Alex Rodriguez, 654 Home Runs, 2,939 Hits
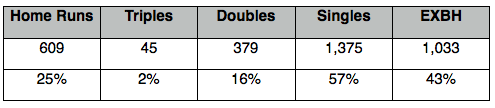
10. Mark McGwire, 583 Home Runs, 1,626 Hits
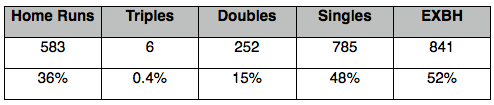
So, what does this all mean? Well, a lot of different things, with some surprises and some predictable conclusions. Ruth surprisingly led the group in triples rate at five percent, though Mays tallied four more total triples than him in his career. The rate at which the two hit triples differs is due to Mays accumulating 410 more total hits in his career. It also seemed inevitable that Aaron, even with the second most career home runs, would have the highest singles rate at 61 percent as he leads the list in total hits with 488 more hits than Mays, who sits in second total hits for the top 10 all-time home run leaders. McGwire is the outlier here. He sits last in tenth place with home runs, but has the highest home run rate at 36 percent and is the only player that has a higher extra base hit rate compared to singles. He’s an interesting case where his tendency to be so power heavy is not ideal, but we’ll get to that soon.
Introducing RP3 (Runs Produced Probability Points, not Dan Snyder’s dog)
Why is the extra base hit rate and its correlation to singles so important? For starters, think about the base paths as being cut into four quarters. A single would result in a 25 percent probability that a run will be produced from an RBI or eventually a run scored, while a double is 50 percent, a triple is 75 percent, and of course, a home run is a 100 percent chance of a run being produced. This is exactly why the extra base hit rate is key to production, yet singles must not be forgotten.
Let’s make these percentage probabilities into points now. For his career, Bonds would account for a probability of 1,494 (762+57.75+300.5+373.75) runs produced. Now, let’s compare that to McGwire, who had the highest home run rate, but the lowest singles rate. McGwire totaled 2,145 less hits than Aaron. The former Bash Brother racked up a probability of 909.75 (583+4.5+126+196.25) runs produced, which is 584.25 less runs produced than Bonds.
Baseball analytics have shied more and more away from a statistic like RBIs. The reason is that the stat is dependent, meaning that you need a little bit of luck and also help from your teammates to be able to knock runs in. A hitter still must be able to produce smart outs and produce when needed in order to get RBIs, and also be able to get on base to add runs on your stat sheet. The reason RP3 trumps the two stats and combines the chances of the two happening, is because it is an independent stat, where only the batter can affect the outcome.
What this shows, is how balance is the ultimate winner when looking at the strongest hitters. We still need Pete Rose, who only had a 24 percent extra base hit rate out of his 4,256 career hits. Rose had 3,125 singles alone in his career. That is more total hits than everybody on this list besides Aaron and Mays. With just his singles, Rose has a runs produced probability of 781.25 runs.
As Aaron has 836 more career hits than Bonds, he also has the highest runs produced probability, with 1,714 runs produced (755+73.5+312+573.5). Again, balance is huge and when it comes to the subject. Bonds is the champion at a 51:49 singles to extra base hit ratio, hitting only 55 more singles than extra base hits for his career. This correlation of such a balanced slugger and overall ability to rack up base hits, makes Bonds the greatest overall hitter as a power hitter, despite not reaching the magic .300 career batting average as he finished at .298, and fell 65 hits short of 3,000. If you’re a fan of the runs produced probability points equation, then Aaron is your guy, even though he only had a 61:39 singles to extra base hit ratio. Either way, the more controversial and less controversial home run king, found a way to balance power and the ability to find hits, making them maybe the overall greatest left-handed and right-handed hitters of all-time.