
For decades in major league baseball, a predictable inverse relationship existed between the number of substitutions made during a game and the likelihood of winning that game. Teams that didn’t make substitutions were more likely to win than teams that did, with that winning percentage declining with each additional substitution made.
In today’s game, with at least three pitchers (starter, setup man, closer) in every team’s game plan everyday, the expanded pitching staffs necessary to sustain that approach have reduced bench size and, presumably, limited opportunities to use tactical substitutions on offense. Or, have they?
After the jump, more on the relationship between player substitution and winning.
First, let’s look at the number of pitchers used in a game, and how well teams have fared as a result. Here’s the National League since 1946.
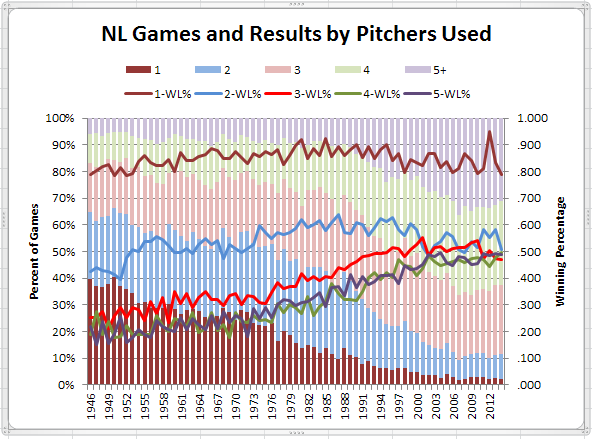 The vertical bars are the percentage of team games each season in which a specific number of pitchers are used, measured against the left axis. The lines are the winning percentage when using that number of pitchers, measured against the right axis. Thus, when a pitcher records a complete game, his team will have about an 85% chance to win, a relationship which has held throughout this period.
Of course, the number of those complete games has dwindled to almost none, going from up to 40% of games to just 1% or 2% now. In fact, the proportion of games today with two or three pitchers used is almost the same as the proportion of complete games 60+ years ago. With two pitchers used, teams started winning more often than losing about the mid-1950s, improving to about a .600 winning percentage from the early 1980s to the mid-1990s, before dropping back to just above .500 in this century. But, look what’s happened to the winning percentage with 3 or more pitchers. Consistently below .400 until the early 1980s, today there is essentially no difference in winning percentage based on pitchers used in the 90% of games in which a team uses three or more hurlers.
The next chart shows the AL over the same period.
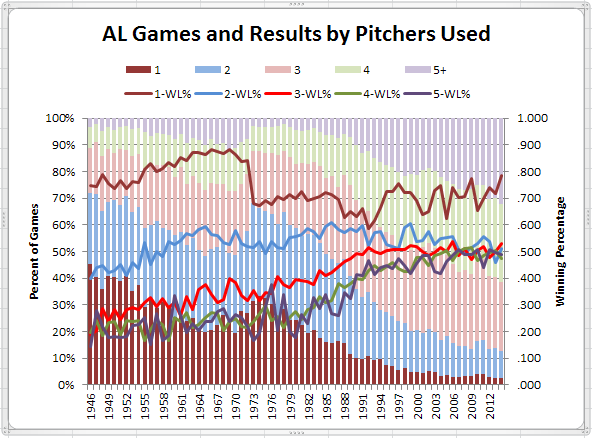
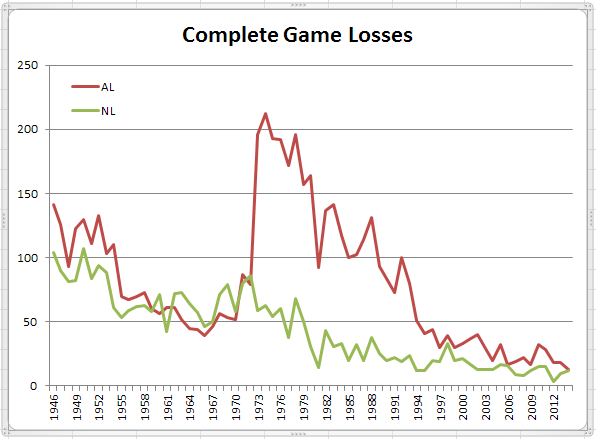
Similar picture to the NL, with the notable difference in the winning percentage when using just a single pitcher. About the same as the NL around the .850 level prior to the DH rule, starting in 1973 that winning percentage immediately dropped down to the high .600s, even as the number of such games shot up 50% (from 20% to 30% of games), indicating that not having to remove a pitcher for a pinch-hitter didn’t really help a team’s chances to win, as the necessity of a pinch-hitter merely emphasized the likelihood of losing such games. The number of AL complete games is now only slightly more than in the NL, but the winning percentage in those games still lags the senior circuit as those extra complete games are, in most cases, complete game losses, as indicated in the chart below.
 Now, let’s like at game results based on the number of batters used. Here’s the NL picture.
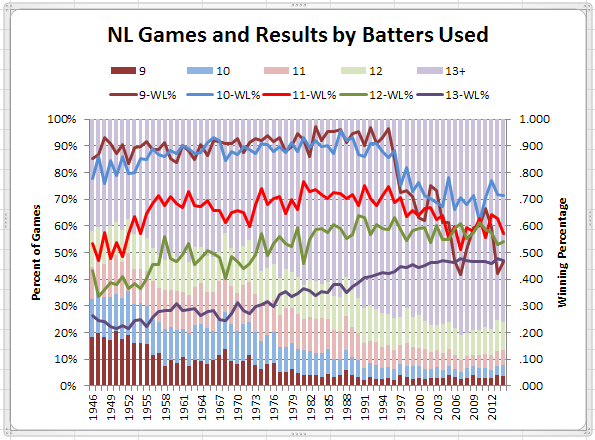
The trend to lower winning percentages when using more than one batting substitution has held throughout the period, though that advantage has dwindled with the continuing convergence of the winning percentage lines. The biggest change has been a drop in winning percentage since the mid-1990s when using one substitution or less, and that, also starting about that same time, using one substitution has produced better winning results than using none. The mid-1990s was the start of the sudden upsurge in offensive production that peaked in 2000; but, why that would be reflected in this result is not immediately apparent to the author.
The shortening of benches has not resulted in fewer batters being used in NL games. On the contrary, as pitchers other than starters or middle relievers are seldom permitted to come to bat, other players must take the pitchers’ turns at bat in the late innings.
The AL story is somewhat different.
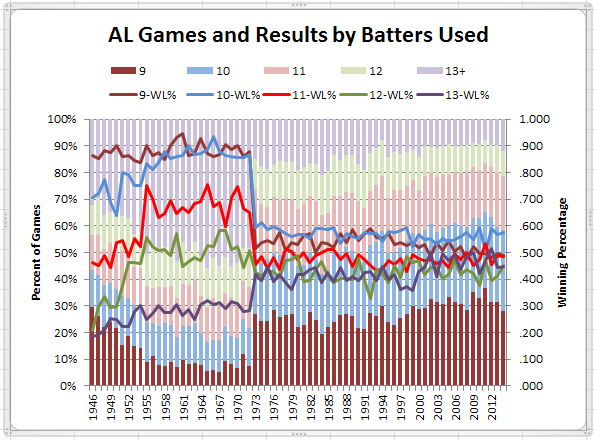 Here, the convergence of winning percentages lines is not gradual, but sudden and immediate with the introduction of the DH. As in the NL, the winning percentage when making exactly one substitution has become superior to when making no substitutions, even though the number of games without an offensive substitution has crept up gradually to around 30% today, compared to about 25% immediately after the DH rule was adopted. Similarly, the number of games with 11 or fewer batters, around 65% to 70% of games from the mid-1970s to the early 1990s, is now consistently around the 80% mark, probably an indication of reduced bench size in this century.
What sort of offensive substitutions are being made? The argument against shorter benches is how that limits a manager’s ability to pinch-hit in critical situations. However, the data do not support that supposition, at least not in the NL, as can be seen below.
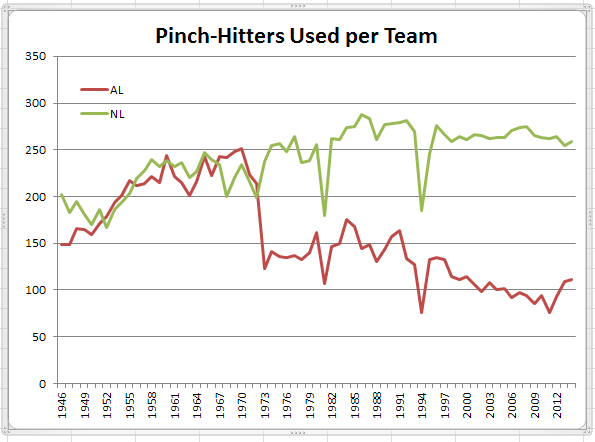 The chart is showing pinch-hitters used over the course of a season on a per team basis. Thus an average figure above 250 times a season in the NL indicates a bit more than three pinch-hitters used for every two games, a figure which has declined only slightly since a 1980s peak. A different story in the AL where the number dropped sharply, as expected, after the DH rule came into effect, and then has declined steadily since the mid-1990s, likely a result of shorter benches.
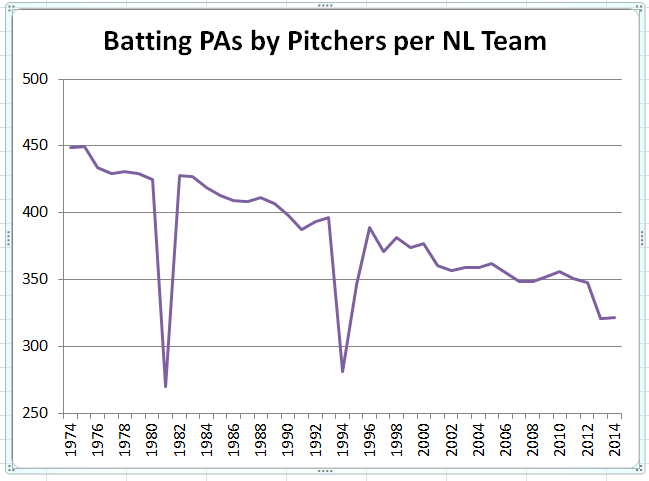
However, as reader David Horwich points out, the steady rate of NL pinch-hitting over the past 40 years does not mean that NL managers are not challenged by shorter benches. Rather, as shown by the chart below, batting appearances by NL pitchers have declined steadily over this period (admittedly due, in part, to expanded inter-league play) meaning more NL pinch-hitting is of the “automatic” variety (i.e. batting for the pitcher) rather than for a matchup advantage at a key point in the game.
Finally, how has the use of pinch-hitting specialists been affected by shorter benches? Here’s that picture.
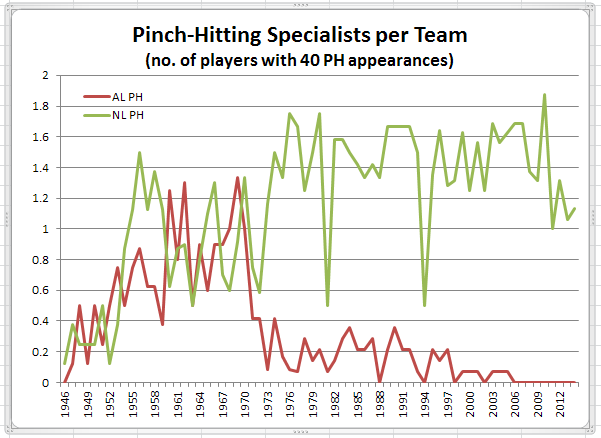 The pinch-hitting specialist has become pretty much an NL-only phenomenon, increasing in the senior circuit starting in the mid-1970s, likely in response to the decline in offense and a greater focus on small ball. The number of such specialists has consistently averaged about one-and-a-half per NL team (indicating about half of NL teams employed both a right-hand hitting and left-hand hitting specialist) until the current decade when that number has dipped to about one per team, probably a reflection of reduced bench size. AL pinch-hit specialists have been rare since the DH rule, with only about one team in five having such a specialist through the 1990s, before reducing to none about ten years ago, with Dave Hansen the last AL player to have 40 PH appearances, in 2004 and 2005.
My thanks, as always, to the indispensible Baseball-Reference.com, for the data used for the illustrations for this post.