
I was watching a game on TV last week during which the commentator related a conversation he had had with a catcher who had played for Mike Scoscia. The catcher indicated that Scoscia placed tremendous emphasis on the 1-1 pitch as the key pitch of an AB because of the difference between facing an opposing batter with a 1-2 count rather than a 2-1 count. So, I thought to myself “I wonder if Scoscia is right?” and decided to find out.
What follows, then, is an analysis of pitch count data available through Baseball-Reference.com. I learned a few things that surprised me. Maybe you will too.
Baseball-Reference.com has pitch count data back to the 1988 season, with the more recent data (since 2002) complete and the prior data almost complete. Using the Split Finder in the Play Index tool, one can extract data for players, teams or leagues for PAs ending with each specific pitch count, as well as for PAs that included any specific pitch count. For example, data are available for PAs that ended on the 2-2 count (or any other), PAs that included a 2-2 count (or any other) or various summaries (e.g. two strikes, three balls, etc.). Using these data, I compiled the following pitch count state model for major league baseball in 2014.

Let me explain the above illustration. The diagram is read from the top down, and follows the sequence of pitches in a plate appearance. Each node represents a pitch count, starting with the 0-0 count in the node at the top of the page. If the next pitch is a strike, the link to the left (as you look at it) is followed. If a strike, the node to the right. Thus, the links from the 0-0 node go to either a 1-0 count (left link) or an 0-1 count (right link).
Okay, that’s fairly straightforward, but what about all the numbers? At this point, you might want to bump up the zoom on your browser to get a better look. There are three pairs of numbers, each pair a percentage and a decimal number measured to the thousandths. In all cases, the percentage number is the percentage of all PAs in the 2014 season. The three pairs of numbers, then, from top to bottom are:
- % of PAs and OPS for all PAs that included this count
- % of PAs and OPS for all PAs that ended on this count with a ball-in-play (incl. HRs) or a HPB
- % of PAs and OPS for the counts following this count
The third of those pairs may need a bit more explanation. What I’ve attempted to do is separate the OPS scores in the first pair of numbers (all PAs with this count) into OPS for PAs ending on this count and OPS for PAs that included this count but didn’t end on it. But, the data doesn’t let me do that, exactly. For example, for the 2-2 count, I know what percentage of PAs had this count, but I don’t know the number and OPS for PAs that arrived at 2-2 from a 1-2 count or a 2-1 count. That being said, for the most part, how a pitcher and batter approach a pitch in a given count doesn’t depend much on how the count was arrived at. Thus, for the 3rd set of numbers, as a proxy for the OPS in PAs that didn’t end on a given count, I’ve substituted the combined OPS for the two possible following counts.
As these data are for all of the PAs in the season, the OPS scores are completely raw. No adjustments for team, park factor, score, inning, outs, men on base, pitcher, batter or anything else (feel free to attach to that disclaimer whatever significance you deem appropriate). With those preliminaries out of the way, what do all the numbers show us? These are some of the things that jumped out at me.
- Major-league batters are pretty dangerous … when they put the ball in play. The lowest OPS on BIP is a 0.752 mark on an 0-2 count (the lowest OPS on this count is as would be expected) and the highest is 1.048 on a 3-0 count (again, as expected). So, why are those numbers so big when the overall OPS as the batter steps into the box is only .703? Of course, it’s the OPS-sapping strikeout that is the hitter’s bugbear. It should also be borne in mind that, while OPS scores north of 0.750 look good at first blush, the lowly walk will net a 1.000 OPS every time.
- Major-league pitchers aren’t so bad either. When a pitcher throws a first pitch ball, he gets into a 2-0 hole only one time in three. Similarly, when the pitcher gets ahead 0-1, he extends his advantage to 0-2 more than 40% of the time. However, once a pitcher gets to a 3 ball count, he might as well make it 4 balls, especially with less than two strikes.
- Now, let’s look at that 1-1 count that was said to be regarded by Mike Scioscia as the key pitch in any AB. For the 69% of PAs that last three or more pitches, more than half (54%) do have a 1-1 count. So, from that perspective it’s the “key” pitch. However, if you look at the OPS for all 1-1 PAs (.654) and then the combined OPS for the following 1-2 and 2-1 counts (.602), the difference is not huge. Except the expected OPS that follows a 1-1 pitch that isn’t put in play is not a “combined” OPS result, it’s either the OPS for a 1-2 count or for a 2-1 count, and the OPS difference between those two counts (.289) is substantial. But, is it the biggest difference? Let’s see.
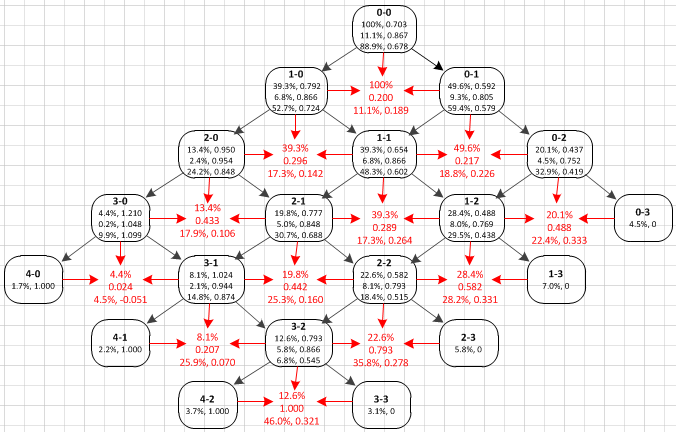
I’ve added some more numbers to the chart in red to show the difference between the two following states at any pitch count.
- The first number in red just indicates the percentage of PAs with that pitch count, which is just the first percentage number from the node directly above.
- The second number is the OPS difference between the nodes on the left and right (which are the two pitch counts following the node above), being the difference in OPS between a ball and strike on this count
- The third numbers are a pair of % of PAs and OPS difference. What’s different about this pair is the % number is not a percentage of all PAs, but rather a percentage of the PAs with this count. In particular, it’s the percentage of PAs in this count in which the hitter put the ball in play or was hit by the pitch, while the OPS number is the difference between putting the ball in play on this count, or not doing so.
A couple of notes on that last pair of numbers. I included HPBs with BIPs because: (a) I needed to put them somewhere; and (b) like a BIP, an HPB can happen on any count and has the effect of ending the PA. The OPS difference between putting the ball in play in this count or not is the difference between the OPS in the second pair of numbers in the node above, and the “combined” OPS of the two following counts if the ball is not put in play (if you like, you can think of this as the “opportunity cost” for the batter if he fails to put the ball in play, more especially if the pitch is a strike).
In fact, the biggest OPS differences between a ball and a strike in any count are, unsurprisingly, in two-strike counts when it’s all or nothing. And, it’s a long way from zero (i.e. strike three) to even very modest OPS expectations if a batter puts the ball in play or lives to see another pitch. But, leaving aside the two-strike counts, the next biggest OPS differences are on two-ball counts, with the 0.433 OPS difference on a 2-0 count, and 0.442 on a 2-1 count. This, of course, makes sense from the pitcher’s perspective as a pitcher clearly wants to avoid going to a three-ball count. However, from the batter’s perspective, these two counts aren’t as critical when comparing the OPS for putting a BIP and the expected OPS arising from seeing another pitch, with only .106 and .160 differences.
So, what about that 1-1 pitch that Mike Scioscia reportedly emphasizes so much. What’s notable about this pitch is: (a) almost 40% of PAs include this count; and (b) there is almost equal importance in terms of OPS from the point of view of: the .289 difference for a pitcher between the following 1-2 and 2-1 counts; and the .264 difference for the batter between putting the ball in play or not. So, the count occurs frequently and presents similar and significant motivation for both the pitcher and batter to achieve opposite objectives. Seems like batter-pitcher competition in its most attractive and elemental form.
Finally, let’s look at the % of PAs in each count in which the batter puts the ball in play (that’s the percentage in the third row of numbers in red). As expected, batters put the ball in play on two-strike counts more often than other counts with that percentage increasing as the count becomes more favorable to the batter (that stands to reason as, when the pitcher is ahead in the count, he is less likely to offer the batter a desirable pitch to hit, and the batter is less likely to swing at that pitch or, if he does swing, to put that pitch in play). But, the count that jumps out at me is 3-1, which the batter puts in play 25.9% of the time. To be sure, batters will likely get good pitches to hit 3-1, but they usually get even more attractive pitches on a 3-0 count yet put that pitch in play only 4.5% of the time. Why such a big difference? If 3-1 is a good count to swing on, why not 3-0 as well? Conversely, if 3-0 is a good take count, why not 3-1 also? I’m only being partly facetious in posing those questions, as the OPS differences between putting a ball in play or not on those two pitches are very similar and very, very small (-.051 and .070).
Looking at balls in play on other pitches, the high rate (25.3%) on a 2-1 pitch seems out of proportion to the OPS advantage (.160) in doing so. Contrast that pitch with a 1-1 or 0-1 pitch which offer higher advantages for a ball in play (.264 and .226) but a lower proportion of “opportunities seized” (both around 18%), “lost” opportunities that are magnified by the high number of PAs with these counts (39% and 49%). Well, that’s probably enough from me. Take some time to absorb the data here and let me know what nuggets you’re able to mine. For those interested, the full set of data for seasons back to 1988 are here.