
On a recent post, one of our regular HHS readers wondered about whether today’s highly specialized relief corps really helped preserve wins or prevent losses. That seemed like an interesting idea for a post, one that I’ll look at in two installments. Part 1 looks at starters and relievers across all teams, while Part 2 will focus in on individual pitchers.
More after the jump.
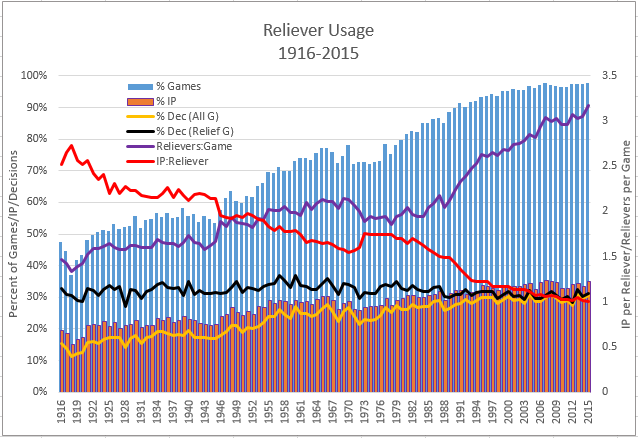
I’ll start with relief pitchers to see how their usage has changed over the years, as shown in the chart below.
There’s a lot to explain here, so let me walk you through it.
The two columns are showing the percentage of team games (blue) in which relievers have participated, and the percentage of innings (orange) they have pitched. One hundred years ago, relievers appeared in less than half of team games but that has grown steadily to the point where they appear in over 97% of games today. All those extra appearances have increased the relievers’ share of the overall pitching workload, from about one inning in five a century ago to one in three today.
The black and yellow lines are showing decisions recorded by relief pitchers as a percentage of all team games (yellow) and as a percentage of games in which relievers appeared (black). As would be expected with the increased share of innings, decisions recorded by relievers have also increased, today about double the percentage of 100 years ago. However, looking only at games in which relievers have appeared, decisions for relievers have been fairly consistent over this period, with a slight decline since the late 1960s attributable to the increasingly common practice (almost universal today) of employing one or more relievers to protect leads (and decisions) bequeathed by starting pitchers.
The last two lines show the biggest changes over this period, in the number of relievers employed for games in which they appear, and the average innings pitched per reliever. The number of relievers (violet) has doubled in the last century from about 1½ per team relief game to over 3 today. The average number of innings each reliever worked stayed above 2 IP through the end of World War II, before dropping to today’s average of only one IP per appearance.
So, what effect has the change in reliever usage had on starting pitchers? Those trends are illustrated in the chart below.
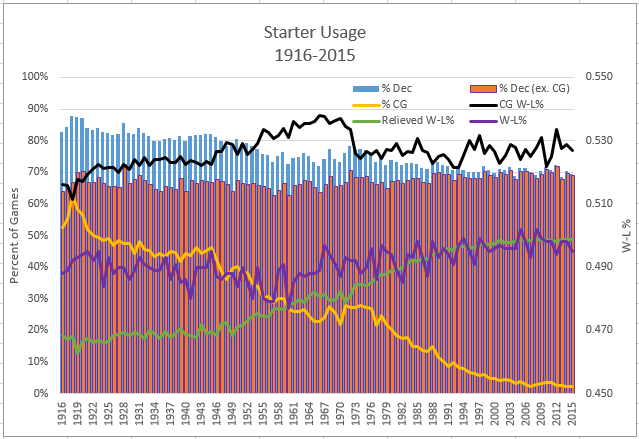
Here, the two columns are showing decisions recorded by starters as a percentage of all team games (blue), and decisions by starters, excluding complete game decisions, as a percentage of games the starter does not complete (orange). Those two quantities were distinct a century ago but are very close to the same thing today, given the over 90% decline in complete games (yellow line).
Decisions by starters have declined from over 80% of team decisions to about 70% today. However, when starters are relieved in a game, the frequency of decisions recorded by starters has increased from about 65% of such games to that same 70% level today. Those extra decisions have been positive on balance, resulting in an increase in overall W-L% (violet line) recorded by starters, from a low of about .480 in 1960 to around .495 today.
That overall W-L% for starters is comprised of the their record (plotted against left axis) when completing games (black line) and when relieved (green line), with the latter result showing steady improvement as complete games have declined, particularly since the mid-1950s. With greater reliance placed on relievers, the quality of those pitchers has improved, as shown in the chart below.
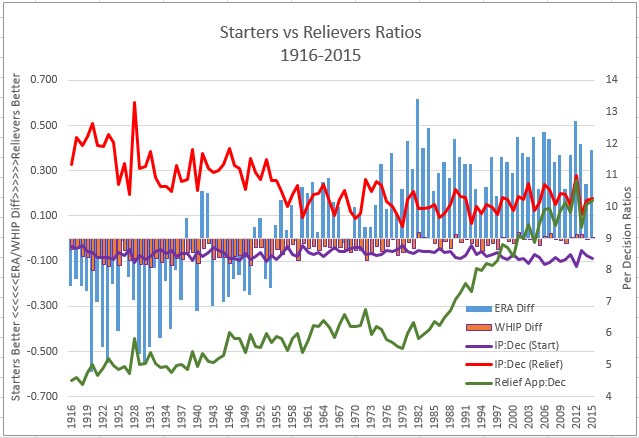
Let’s look first at the lines that are plotted against the right axis. These are the ratios between IP and decisions for starters (violet) and relievers (red). Despite the reduction in workload for starters, their ratio of IP to decisions has declined only slightly, by about half an inning from the 1960s to today. The increase in workload and decisions for relievers has resulted in their IP to decision ratio declining more markedly, from above 11 IP per decision prior to the mid-1950s to just above 10 today. However, the doubling of the number of games in which relievers appear and in the number of relievers employed in these games has seen the ratio of relief appearances to decisions move the other way, from less than a 5:1 ratio through the end of World War II to about a 10:1 ratio today.
The two columns are showing the difference between starters and relievers in ERA (blue) and WHIP (orange). When the difference favors starters, it is shown as a negative quantity below the horizontal access. When relievers are better, the difference is shown as a positive quantity above the axis. Prior to the mid-1950s, the main job for relief pitchers was to eat innings in mop up roles. Thus, less skilled pitchers were assigned to this unglamorous role as indicated by the ERA edge for starters of one-third to one-half a run, and a WHIP edge around 0.1 (one less baserunner per 10 IP). Since then, with the evolution of relief pitching to become a key element in preserving leads and, ultimately, wins, the ERA edge has moved the other way, favoring relievers by one-third to one-half a run, while WHIP has become basically a saw-off between starters and relievers.
The last point, concerning WHIP, demands closer inspection. If there has been essentially no difference in WHIP in recent years between starters and relievers, why have relievers shown consistently better ERA? The answer is revealed in the chart below, comparing starters and relievers in hits, walks and strikeouts.
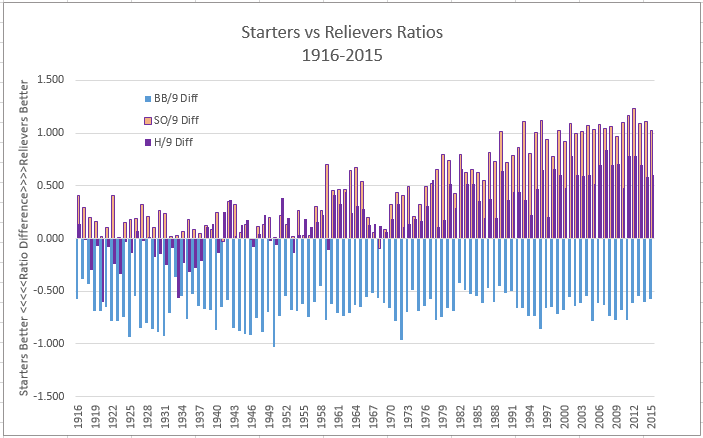
Starters have shown better walk ratios (light blue) throughout the period, and usually by a significant difference of more than half a walk per 9 innings. That walk edge, though, is likely a bit misleading, especially in recent years when deep bullpens and short benches have made it much easier for managers to have their relievers pitch around better hitters to set up more desirable matchups with weaker batters. Starters were initially also better in preventing hits allowed (violet), but that edge swung to relievers starting about 1940 and has become more significant in recent years, more than half a hit per 9 innings better over the past 20 years.
So, how is it that relievers are “wilder” than starters but also more effective in preventing hits? Fewer hits allowed is likely related to strikeout rate, on the premise that it’s hard to get a hit if you can’t put the ball in play. Strikeout rates are shown by the mauve columns where relievers have consistently had the edge, and by more than a full strikeout in recent years. That strikeout edge was likely related to starters “pacing” themselves prior to 1960, and with relievers exerting maximum effort since then, particularly in the past 20 years. Thus, with relievers enjoying edges in strikeouts and hits allowed, it’s not too hard to understand why they’ve posted better ERA results than starters despite comparable WHIP scores.
In summary, the main take-aways from this analysis are:
- Decisions for starters in games they don’t complete have increased from about 65% of such games a century ago to around 70% today
- Wins for starters in games they don’t complete have improved from under 20% as recently as 1949 to over 48% today
- In the past 50 to 60 years, relief pitchers have shown consistently better results than starters in ERA, strikeouts and hits allowed