
Followers of the game will be aware that baseball today is awash in young talent, including the group below, showing their career totals through their age 22 seasons.
| Rk | Player | Year | WAR/pos | From | To | Age | G | PA | R | H | HR | RBI | BB | SO | Pos | Tm | ||||
|---|---|---|---|---|---|---|---|---|---|---|---|---|---|---|---|---|---|---|---|---|
| 1 | Carlos Correa | 2016 | 10.1 | 2015 | 2016 | 20-21 | 252 | 1092 | 128 | 266 | 42 | 164 | 115 | 217 | .276 | .354 | .475 | .829 | *6/H | HOU |
| 2 | Francisco Lindor | 2016 | 10.3 | 2015 | 2016 | 21-22 | 257 | 1122 | 149 | 304 | 27 | 129 | 84 | 157 | .306 | .356 | .454 | .810 | *6/HD | CLE |
| 3 | Bryce Harper | 2015 | 19.8 | 2012 | 2015 | 19-22 | 510 | 2143 | 328 | 528 | 97 | 248 | 279 | 449 | .289 | .384 | .517 | .902 | 978/HD | WSN |
| 4 | Manny Machado | 2015 | 17.7 | 2012 | 2015 | 19-22 | 451 | 1979 | 252 | 511 | 68 | 215 | 128 | 330 | .281 | .330 | .458 | .787 | *5/6 | BAL |
| 5 | Mike Trout | 2014 | 28.6 | 2011 | 2014 | 19-22 | 493 | 2195 | 373 | 572 | 98 | 307 | 269 | 489 | .305 | .395 | .549 | .945 | *87/D9H | LAA |
| 6 | Jason Heyward | 2012 | 14.7 | 2010 | 2012 | 20-22 | 428 | 1730 | 226 | 392 | 59 | 196 | 200 | 373 | .261 | .352 | .447 | .799 | *9/H8 | ATL |
| 7 | Giancarlo Stanton | 2012 | 12.4 | 2010 | 2012 | 20-22 | 373 | 1498 | 199 | 358 | 93 | 232 | 150 | 432 | .270 | .350 | .553 | .903 | *9/HD8 | FLA-MIA |
In fact, the players above all compiled 10 or more WAR by age 22. What may surprise you to learn, though, is that these 7 players from just the current decade represent fully one-sixth of all such everyday players since 1901. But, will they continue to produce handsome WAR dividends for their teams as their careers progress? To answer in a few words, for most of them, it’s very, very likely.
After the jump, more on being very good when very young, and projecting that success over a career.
To provide a bit of context on having seven players in a 5-year period reach 10 career WAR by age 22, here are the ages that all players have reached that career WAR threshold.
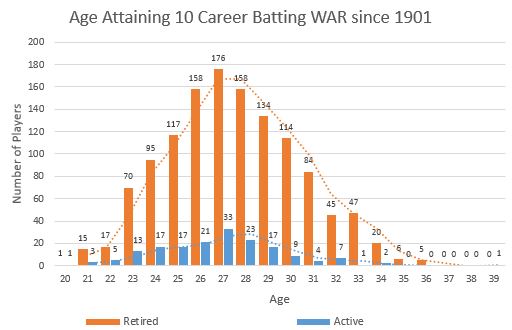
In all, there have been 1262 retired players and 174 active players record 10 or more career WAR (Baseball-Reference.com version; Batting WAR denotes WAR other than Pitching WAR and includes Offensive and Defensive WAR) since 1901. So, looking only at players doing so by age 22 is indeed a tiny proportion of all such players, making the sizable representation of active players in that small group all the more interesting and noteworthy.
So, who are these most exceptional players. Here’s a chart showing chronologically all players since 1901 with 10 career WAR by age 22. HOF players are denoted by gold bars, retired players by blue bars and active players by green bars.
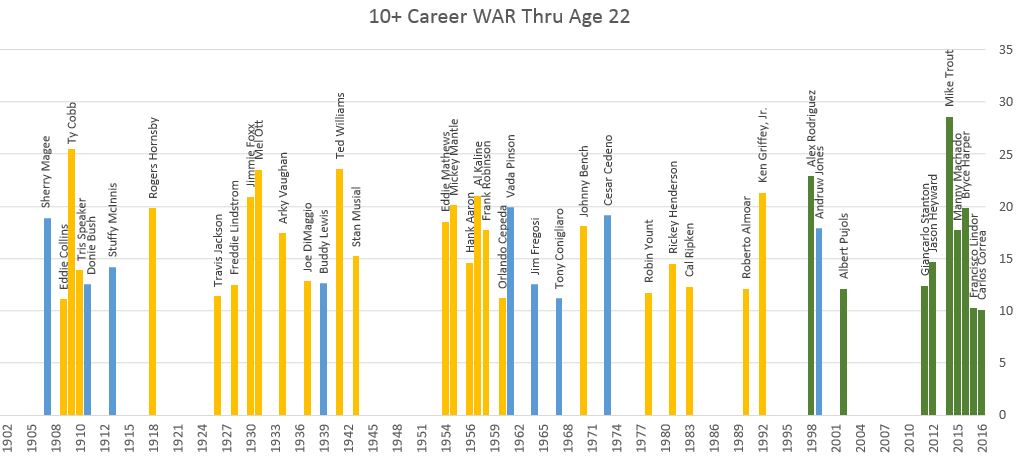 It’s a bit of an eye test to read the players’ names (you can increase your browser zoom a bit, if you need to) but most need no introduction. Having a confluence of such careers as we’re experiencing now is historically rare, happening only at the end of the 1900s decade, and from the mid 1950s to early 1960s, or about once every 50 or 60 years.
The swath of gold bars denoting HOFers in the above chart augurs well for the career arcs of the active players in this group. To illustrate the significance of reaching 10 WAR by age 22 as opposed to one or two years later, the table below shows retired players in each of those groups and their career WAR totals.
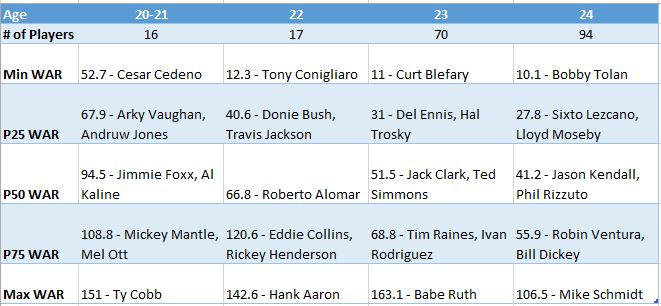
Using 65 WAR as a likely HOFer (66 of 80 such retired players since 1901 are in the HOF or are currently on the BBWAA ballot), the moments shown in the table approximate the likelihood of reaching that threshold: ~75% chance if you reach 10 WAR by age 21; ~50% chance at age 22; and ~25% chance at age 23 (it’s about 12% for age 24, with 11 of 94 reaching 65 WAR). This result is somewhat analogous to Bill James’ discovery that for matched groups of players with similar rookie seasons, the group having that rookie season at age 21 goes on to compile 50% more career WAR than the group doing so at age 22.
So, to what, if anything (other than chance), might the current confluence of early 10 WAR careers be attributed? I don’t have the answer, but in considering this question, I was struck by the result shown in the chart below (starting here, the WAR shown is for the Fangraphs version of WAR, which is more easily extracted for league or MLB-sized samples).
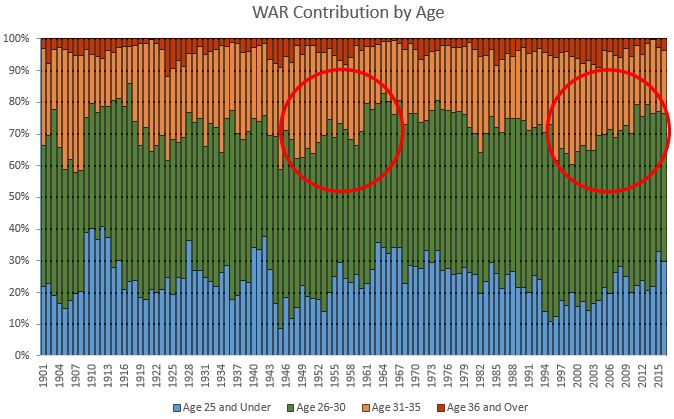 The chart is showing the proportion of total batting WAR for all teams in each season that are contributed by players in each age group. The circled areas are showing two ~20-year periods, each beginning with WAR from players aged 30 or under at or near historic lows of about 60% of all WAR and ending with that same group at or near historic highs of about 80% of total WAR, or a one-third increase over those periods. The second period, of course, is the past twenty seasons and the first period encompasses the confluence of early 10 WAR careers in the mid-1950s and early 1960s.
The illustrated result is not surprising given the two confluences of high WAR youngsters, when one considers that the bulk of the WAR in each age group (and especially the two younger age groups) is contributed by a disproportionately small number of leading players. What is surprising though is that, both then and now, the illustrated trend was already established even before the appearance of the the young phenoms. So, one is left to ponder whether cadres of precocious WAR producers are a cause or an effect of increasing WAR contribution from younger players.
To finish, here is how WAR contribution tracks to playing time for each of the age groups for the above chart.
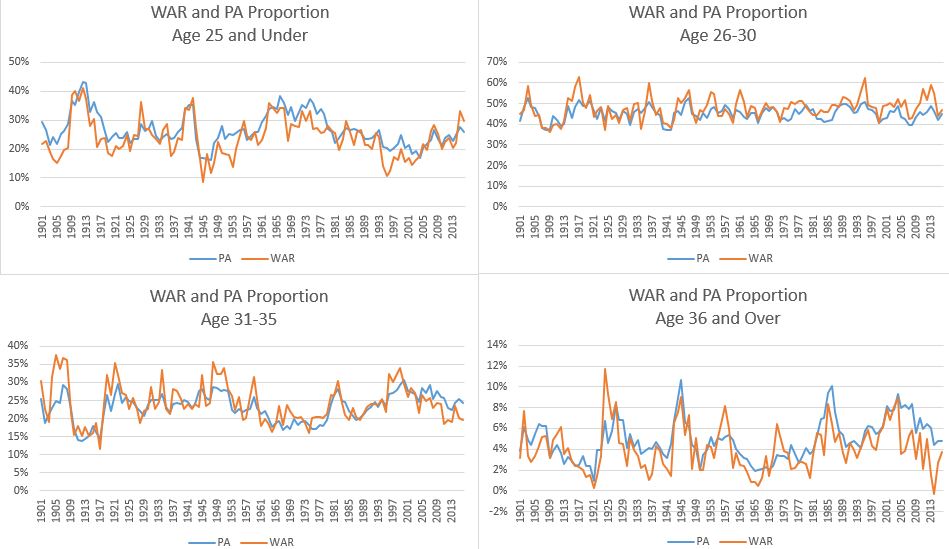
As would be expected the proportion of WAR tracks quite closely to the proportion of PAs. However, is a near perfect match between WAR contribution and playing time the optimal arrangement? My gut feel would be that one would want to give more playing time to the age 30 and under groups contributing the bulk of the WAR, even to the point of having the proportion of PAs for these groups exceed their proportion of WAR. Doing that means, of course, that the opposite effect occurs for the older players who would receive less playing time relative to their WAR contribution. To look at it another way, if you’re filling out your roster of regulars with players at or near the replacement level “bubble” (say, 2 to 3 WAR players over a full season), if given a choice, would you rather have those spots go to younger players or older ones. I think, for most teams, the answer is younger players, both for financial reasons and in the interests of developing those younger players (a team with championship aspirations may take a bit different tack, but even in that case, older players will be primarily those who are still producing, not those just hanging on).
Guess what. My conjecture for the optimal allocation of playing time is, if you look at the charts closely, about what has happened for most of the modern era of baseball. Most of that era, that is, until the more recent “sabermetric” era, when pretty much the opposite has happened. This divergence is illustrated somewhat in the chart below.
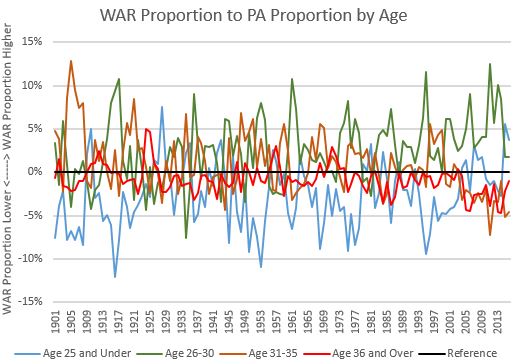
No, this is not my ECG chart, but let me explain. What I’m showing here is % of WAR minus % of PAs for each age group. Thus a positive difference of say 5% indicates that the group contributed more WAR relative to its playing time (perhaps 45% of WAR but only 40% of PAs), while a negative result of -5% indicates that the group contributed less WAR relative to its playing time (such as 20% of WAR, but 25% of PAs). Thus, for most of the modern era, the Age 25 and Under group shows a negative result, indicating its WAR proportion was smaller than its proportion of playing time. And the Age 26-30 and Age 31-35 groups showed mostly positive results, indicating that their WAR contributions exceeded their proportions of PAs. Lastly, the oldest group (that contributed by far the least amount of WAR) bounced around the reference line with the smallest deviations of any of the groups.
But, look at the period since about 2000. Both of the older groups are showing considerably larger deviations than in most of the preceding seasons … and (in my opinion) in the wrong direction, with more playing time being given than is justified by the WAR produced. So, if that’s happening, it means the younger players, who are contributing the bulk of the WAR, are getting shortchanged in their playing time. Sure enough, over this period, the key Age 26-30 group is showing its largest deficits in playing time relative to WAR production while the 25 and under crowd have actually been above the reference line more often than their usual home below, again indicating a playing time deficit relative to WAR production (instead of a surplus in the interest of developing those young players).
Enough from me. What are your thoughts?