MVP Elections – 2000 NL

Greetings, HHS fans!  Dr. Doom here again, with yet another interminably-long post about an MVP race.

This is our final trip to the Senior Circuit, so my fellow NL fans and I will have to be happy with this one.  The year was 2000.  It was the first of a new millenium, or the last of an old one, or perhaps the only year of the Willenium (which was technically released in 1999, but it was too good of a joke to pass up).  The point is, that was an actual debate that people would have.  I was enjoying the summer between 6th and 7th grade, all awkward and growing my first couple of facial hairs, small and blonde though they were.

But more germane to our discussion was what was happening in the NL in 2000, because that’s where we’re headed this week in re-voting MVPs.  The NL in 2000 was a confusing place.  For starters, Sammy Sosa led the league in HR, which sounds good for him.  Except that, for his failure to hit 60 of them, as he had in back-to-back years (he managed “only” 50 – but don’t feel bad, as he’d hit 60+ again in 2001), he was rewarded with a 9th-place MVP finish.  In other oddities, for the first time since 1990, a season had been played to completion and the team with the league’s best record was not the Atlanta Braves (incidentally, just how good were those ’90s Braves teams?  Ridiculous, right?)  Four teams won 90+ games:  the wild card Mets (94) who came from the same division as the ever-ready Braves (95), the upstart Cardinals (95) who made the playoffs for only the second time since the Whitey Herzog  days, and the top team in the league with 97 wins, Dusty Baker’Giants.

San Francisco had been below .500 three times since 1993, the year of the Giant debuts of both Dusty Baker and Barry Bonds.  But, since 2000 represented the team’s best year since that season, It should, therefore, be no surprise that it was two Giants who were the talk of the 2000 MVP race.  We’ll go through the top eight finishers in the order in which they finished, and then throw in a couple of pitchers, as I always do.

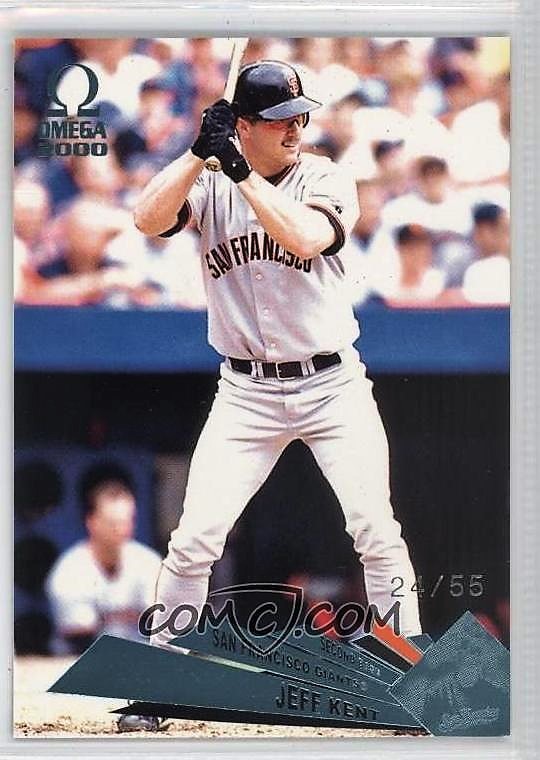
The winner wound up being Giant second sacker Jeff Kent.  Kent led the league in a whole fat lotta nothin’, in spite of which, he put up a superb .334/.424/.596 line (5th/6th/10th) for the 10th-best OPS in the NL.  Kent was also fourth in the league with 125 RBI, and scored a none-too-shabby 114 runs (8th).  His 41 2B tied for 8th in the league, and he added 34 HR.  Even in a year when guys like Jose Vidro and Geoff Jenkins were managing 300 TB, Kent’s 350 of them (7th) stands out.

Kent’s teammate, Barry Bonds, is a man who needs no introduction. By 2000, Bonds had already been a 3-time MVP, though his last one was way back in his 1993 Giant debut (heck, the rookie Bonds, who was only called up mid-season, even received a vote in our re-vote of the 1986 NL!).  While he hadn’t made much noise lately, in 2000, Bonds roared back into the discussion.  He wasn’t flashy enough to lead the NL in any category other than walks (117) but ranked 3rd in R (129), 2nd in HR (49), and managed a .306/.440/.688 line, good for a second-place 1.127 OPS, the same ranking as the last two of those slash components. He added 106 RBI to round out an MVP-type season, despite finishing second to teammate Kent.

Mike Piazza of the Mets, formerly a perennial MVP-candidate with the Dodgers (you’ll recall his strong finish from our last NL post), continued that trajectory, though with a 3rd place MVP finish in the Big Apple.  Piazza had finished 9th, 6th, 4th, 2nd, 2nd, 14th, and 7th in the MVP voting in the first seven seasons of his career; now in his eighth year, Piazza was looking to seal the deal.  He put up a gaudy .324/.398/.614 line giving him the 10th best average, 9th best SLG, and 11th-best OPS in the NL, all while serving as the primary catcher for a pitching staff that allowed the league’s 3rd-fewest runs.  While his counting numbers suffered from his limited games played as catcher, Piazza still banged out 38 HR, good for 10th in the NL, while scoring 90 and driving in 113.

The Cardinals, missing the home run bat of Mark McGwire who was limited by injury to just 89 games, came up with a new hero and MVP candidate:  Jim Edmonds.  Known as a defensive specialist with his spectacular catches in CF, the off-season acquisition from the Angels was also no stranger to hitting the ball hard.  That said, Edmonds’ .295/.411/.583 line was a little bit better (to put it mildly) than anyone in St. Louis was expecting.  Like Bonds, Edmonds was also in the triple-hundred club, with more than 100 R (129, 3rd), RBI (108), and walks (103, 4th), while his 42 HR ranked 8th.

Mr. Rockie himself, Todd Helton, finished 5th in MVP voting.  If you thought some of the others put up gaudy numbers in 2000, wait until you see Helton’s totals.  The Rockies in 2000 played in the highest run environment since the Baker Bowl in 1930, and it led to some truly ridiculous numbers.  Voters, obviously, discounted Helton’s production to some extent, as his raw numbers and reputation as the league’s best defensive first baseman would have otherwise made him the shoe-in candidate.  Sure, after all of that discussion of excellence, 7th place in HR with 42 doesn’t sound too impressive.  Slightly better was his 2nd-place ranking in R (138).  However, Helton then went on to lead the NL in… well… basically everything else: H (216), 2B (59, a number unseen since 1936), RBI (147), average (.372), OBP (.463), SLG (.698), and (obviously) OPS.  He also totaled 405 total bases, the 4th-best in a half-century.  It was a truly eye-popping season – but how much was ballpark and how much was Helton was a challenge for the voters to figure out (and the same task lies before us).

A still-up-and-coming 25-year-old,  Vladimir Guerrero was making a splash in the Great White North of Montreal.  Sure, he’d been basically the same player since his first full season in 1998, but 2000 saw a dramatic increase in his value in the minds of the MVP voters.  Perhaps it was his third place finishes in both batting average (.345) and slugging (.664) to go with a nice .410 OBP for a fourth best 1.075 OPS (the Expo/Nat franchise record until surpassed by Bryce Harper in 2015).  Or, maybe it was the 101 R, 44 HR (4th) or 123 RBI (5th) that sold the voters.  I don’t know. But, what I do know is that players in the top-5 in all three Triple Crown stats tend to do pretty well in the MVP voting, and that’s exactly where Vlad found himself. Add in his incredible throws from right field and you have a player with unmistakable MVP-caliber credentials.

Jeff Bagwell, at this point ALSO somewhat of a perennial candidate following his MVP title of the strike-shortened 1994 season, had an interesting year in 2000.  His .310/.424/.615 line (6th in OBP and OPS, 8th in SLG) is beyond solid, and that alone makes him a creditable candidate. Except that voters apparently noted that Bagwell, playing in Houston’s new bandbox ballpark, failed to improve on arguably better numbers posted the year before in the pitcher-friendly Astrodome, marks that earned him a runner-up MVP finish that season. Still, 42 HR (7th) and 132 RBI (3rd) look an awful lot like an MVP.  But what REALLY makes Bags’s season stand out is the 152 runs he scored.  Not only did it lead the NL – it was (and remains) the most runs scored by a player in MLB since 1936, when Lou Gehrig scored 167.

The Braves Andruw Jones, once a wunderkind World Series hero at age 19, had now matured into one of the best players in baseball, and perhaps the most electrifying centerfielder of all-time.  His diving catches put other players, even the great Jim Edmonds, to shame.  While coming to bat more than anyone else in the NL, Jones hit .303/.366/.541, scored 122 (5th) and banged out 199 H (3rd).  While not necessarily near the top of the leaderboards in many other categories, he also homered 36 times and stole 21 bases (5th) to go with 355 TB for a team that finished with the league’s second-best record..

Finally, since I need to give you one pitching candidate, I’m going to go with the man who was making a play for the record books:  Randy Johnson.  Johnson led the NL in almost everything in 1998.  His 19-7 record led the NL in winning percentage (.731) and placed 3rd in wins.  But, that’s the worst he finished in any category, and the D-Backs weren’t yet the World Series winners they would become the following season.  Johnson’s 8 complete games and 3 shutouts led the NL and his 248.2 IP placed second, just 2.1 behind leader Jon Lieber.  Johnson was also second in ERA, just .06 behind Kevin Brown‘s leading mark posted in the pitcher-friendly confines of Dodger Stadium. What’s most impressive, though, are the strikeouts.  Johnson managed 347 of them – actually fewer than he had the previous year, but his rate was 12.6 per nine.  That was just a hair (.02) below Kerry Wood (1998) for the all-time NL lead (Pedro Martinez‘s 13.2 rate for the ’99 Red Sox is the best mark in either league).  But while the strikeout rate was great, Johnson led in strikeouts by a whopping 130, the NL’s second-largest winning margin, behind only the 143 gap that Johnson himself posted the season before (Dazzy Vance, Sandy Koufax and J.R. Richard are the only other modern era pitchers to lead the senior circuit by 100+ strikeouts, each doing so just once).  Basically, it’s check the stat and Johnson will rank in the NL’s top 3.

Our final candidate actually finished last (22nd) in the MVP vote:  Antonio Alfonseca.  However, Alfonseca led the league in saves (45) for the only time of his career, but continued to lead the league (as he had for three years and would for seven more) in fingers (12 – and yes, I stole that joke from America’s Finest News Source).

So, who is it?  One of these guys?  Maybe you found Brian Giles‘s sneaky-good season, or maybe you think Gary Sheffield‘s bat deserves a second look.  Can’t wait to see what you think!

DIRECTIONS:  Please list 5-10 players on your MVP ballot (ballots with fewer than 5 candidates will be thrown out).  Ballots will be scored as per BBWAA scoring (14-9-8-7-6-5-4-3-2-1).  Strategic voting is discouraged, though unenforceable, so please just don’t do it, as the goal here is to (somewhat) mimic the BBWAA process.  The post will be live for about a week; please discuss and vote whenever you’d like, but there will be no vote changes, so don’t vote until you’re sure you’re ready!

0 0 votes
Article Rating
Subscribe
Notify of
guest

66 Comments
Oldest
Newest Most Voted
Inline Feedbacks
View all comments
Dr. Doom
Dr. Doom
6 years ago

Let’s call the deadline Friday April 7 at 11:59:59. 🙂

Voomo Zanzibar
Voomo Zanzibar
6 years ago

Let’s get Helton’s home/road splits out of the way:

.391 / .484 / .758 / 1.242
.353 / .441 / .633 / 1.074

In 131 PA in “High Leverage” situations:
.475 / .573 / .871 / 1.444

In 57 PA in the 9th inning:
.480 / .544 / .980 / 1.524

210 PA on hits to the infield:
.029 / .029 / .029 / .057

319 PA on hits to the outfield:
.680 / .658 / 1.291 / 1.950

And 18 Rfield

Voomo Zanzibar
Voomo Zanzibar
6 years ago

Given the road numbers, I can’t dismiss Helton.
After Todd I show respect to the Centerfielders and the best Catcher.
Kent’s not in my top 10.

Vote:
1. Todd Helton
2. Andruw Jones
3. Richard Hidalgo
4. Edmonds
5. Piazza
6. Vlad
7. Bonds
8. Randy Johnson
9. Bagwell
10. Sosa

Bo Diddley
Bo Diddley
1 year ago
Reply to  Voomo Zanzibar

Helton had lower home/road splits than typical of his Coors career. Just because he happened to hit relatively worse at home and relatively better on the road this year doesn’t mean Coors field magically changed dimensions, etc for this one year.

That’s like saying Fred Lynn doesn’t deserve consideration in 1979 because of his unusual home/road splits in Fenway that year.

C’mon man.

Last edited 1 year ago by Bo Diddley
ThickieDon
ThickieDon
6 years ago

1. Helton
2. Bonds (only 143 games – otherwise, he’d have my 1st place vote)
3. Randy Johnson (247 IP, 348 K)
4. Andruw Jones
5. Jeff Kent
6. Jim Edmonds
7. Kevin Brown
8. Greg Maddux
9. Edgardo Alfonzo
10. Gary Sheffield

ThickieDon
ThickieDon
6 years ago
Reply to  ThickieDon

Made an error transcribing my list from spreadsheet, left off Piazza. Please disregard the above and use this:

1. Helton
2. Bonds (only 143 games – otherwise, he’d have my 1st place vote)
3. Randy Johnson (247 IP, 348 K)
4. Andruw Jones
5. Jeff Kent
6. Jim Edmonds
7. Mike Piazza
8. Kevin Brown
9. Greg Maddux
10. Edgardo Alfonzo

David P
David P
6 years ago

In looking at Helton’s splits, I noticed an interesting “Coors Field Effect” that I’ve never seen discussed before. Because road teams always bat in the 9th, but home teams don’t, almost all players have more PAs at home than on the road. Just look at Carl Yastrzemski as an example. Despite playing his whole career in what was considered at extreme hitters park and starting 40 more games at home than on the road, Yaz actually has exactly the same number of PAs at home and on the road. But because Coors field is such as extreme run environment, Rockies… Read more »

Richard Chester
Richard Chester
6 years ago
Reply to  David P

From the PI split finder for 2016, home teams had 90,499 PA vs. 94,081 PA for visiting teams. This averages to a differential of 119 PA per team. Of course the more games a team wins at home the greater the differential.

For all years from 1913-2016 home teams had 6,701,352 PA vs. 6,949,614 PA for visiting teams.

David P
David P
6 years ago

Thanks Richard! Clearly I had a brain fart since I never thought to look at team or league totals.

Anyway, if we look just at NL teams for 2000…the Rockies had 7.2% more PAs at home than on the road. The other 15 NL teams averaged 4.4% more PAs on the road than at home.

Mike L
Mike L
6 years ago

Doom, very nice presentation. But, the most depressing thing I’ve read all week (excluding politics, of course) is “I was between 6th and 7th grade in the Summer of 2000”. Errrrr

Dr. Doom
Dr. Doom
6 years ago
Reply to  Mike L

Now that I’ve had the chance to think about it, I believe it was actually the summer between 7th and 8th. But I’m not thinking that makes you feel too much better. 🙂

Mike L
Mike L
6 years ago
Reply to  Dr. Doom

At least you are older than my kids…

Mike L
Mike L
6 years ago
Reply to  Doug

Doug obviously started very early, and I obviously started very late. I’m skipping my 40th college reunion this year.

Paul E
Paul E
6 years ago

OPS+ , min. 7,000 PAs, BB 1.4 * K 1 Babe Ruth 206 2 Ted Williams 190 3 Barry Bonds 182 4 Lou Gehrig 179 5 Rogers Hornsby 175 6 Ty Cobb 168 7 Stan Musial 159 8 Johnny Mize 158 9 Tris Speaker 157 10 Joe DiMaggio 155 11 Mel Ott 155 12 Nap Lajoie 151 13 Harry Heilman 148 14 Eddie Collins 142 15 Brian Giles 136 The next 5 guys on the list are Hall of Famers, too. Brian Giles, Barry Bonds, and 18 guys in the Hall of Fame. If I am not mistaken, at one… Read more »

Paul E
Paul E
6 years ago
Reply to  Paul E

sorry, the next 5 were Wayne, Averil, Vaughn, Gwynn, Morgan in close to that order if my ADD/senility hasn’t totally set in

Paul E
Paul E
6 years ago
Reply to  Paul E

sorry, again. “Wayne” is not The Duke nut Big Poison Waner

no statistician but
no statistician but
6 years ago

Here are some interesting stats, at least to me, Chuck Klein in 1930 vs Todd Helton in 2000: Runs: 158; 138 Hits: 250; 216 2B: 59; 59 3B: 8; 2 HR: 40; 42 RBI: 170; 147 BA: .386; .372 OPS: 1.123; 1.162 OPS+: 159; 163 TB: 445; 405 Runs Created: 193; 192 Adj Bat Runs: 63; 67 Extra Base Hits: 107; 103 H/R BA: .437/ .332; .391/ .353 H/R OPS: 1.274/ 0.969; 1.242/ 1.074 BA vs .500+ Opponents: .392; .329 BA under .300 in opponents’ parks: .233/ .262 (2 0f 7 for Chuck); .217/ .182/ .250/ .273/ .182/ .190 (6… Read more »

Richard Chester
Richard Chester
6 years ago

Most OF assists during the 1901-1919 era is 39 by Mike Mitchell of the Reds in 1907.

It would be nice to know how many of Klein’s assists came at the Baker Bowl. It might possibly be done via an arduous search using the PI Event Finder for the 1930 Phillies pitching staff but there is missing data.

oneblankspace
6 years ago

Retrosheet has a daily fielding record at http://www.retrosheet.org/boxesetc/1930/Mkleic1010031930.htm with links to the boxscore and play-by-play when available. By my count, his assists by city were… PHI 32 CIN 3 BKN 3 PIT 3 StL 1 NY 1 BOS 1 and none in Chicago. There were some games where he had two assists. These include: throwing Lloyd Waner out at second trying to stretch a single twice; a lineout double play + assist granted when the second baseman dropped the throw for an error; throwing a runner out at the plate + fielding a ball where the runner ran out of… Read more »

Richard Chester
Richard Chester
6 years ago
Reply to  Doug

I looked at the 9-4-2016 game between the Angels and the Mariners. In the top of the 8th the Angels had Trout on 3rd and Pujols on 2nd. Andrelton Simmons singled, Trout scored and Pujols was out at home, LF-2B-C. The LF, Seth Smith, was credited with an assist and there were no other plays in the game in which Smith was involved with a base runner being thrown out.

David P
David P
6 years ago
Reply to  Doug

Here’s what mlb.com says re: outfield assists:

“Outfield assists often result from throws directly to a base, without the help of an infielder. However, if a relay throw is needed or if an infielder cuts the throw off to get an out at a different base, the outfielder is still credited with an assist. Similarly, if one outfielder touches the ball before another outfielder throws to the infield for an out, both outfielders are awarded an assist.”

http://m.mlb.com/glossary/standard-stats/outfield-assist

Richard Chester
Richard Chester
6 years ago
Reply to  Doug

Here’s what I found out from my PI search. The Phillies pitching staff gave up 812 singles at the Bowl, of which there are PBP data for 486 of them. Klein threw out 8 runners trying to stretch a single into a double for the singles with PBP. On the road the Phillies gave up 689 singles with PBP for available for 434 of them. Klein threw out 4 runners trying to stretch a single into a double.

no statistician but
no statistician but
6 years ago
Reply to  Doug

Doug: About that “awful lot of aggressive baserunning going on,” the problem I come up against is this: in 1930 the NL went hitting nuts. The LEAGUE batting average was .303, OBP was .360. There were runners on base inning after inning in tremendous numbers of games besides those being played in Philly, so why was it that only Klein seemed to be taking such extraordinary advantage of the craziness? Wouldn’t you expect that after a few instances the word would have gotten out: Don’t run on Chuck? It’s not like he was unknown for having a good arm prior… Read more »

Richard Chester
Richard Chester
6 years ago

The 1930 NL BA at the Baker Bowl was .351, at the other 7 parks it was .296. The AL BA was .288.

Paul E
Paul E
6 years ago

“Clem’s Baseball” indicates 398’CF , 281’RF , 305′ RC (ughhh). I tried the Pythagorean theorem on the sketch and got 338′ to RC…. I imagine with these uniquely inadequate dimensions, coupled with a 60′ fence, base runners had a tough time adjusting to balls hit in that direction. I guess everything was in play for Klein but that wouldn’t explain why they kept trying to take the extra base on him. But, it would certainly explain those ridiculous offensive numbers Klein achieved in 1930 – just like Helton in 2000 in Colorado

Richard Chester
Richard Chester
6 years ago
Reply to  Paul E

281/cos 22.5 deg = 304 ft.

Paul E
Paul E
6 years ago

thanks.
i skipped physics, too

Doug
Doug
6 years ago
Reply to  Paul E

Ballparks.com has right field at 280 ft and right-center at 300 ft. So, essentially confirming your source.

Here’s a picture of the place. Not sure where the moniker “Bowl” would have come from.

comment image

oneblankspace
6 years ago
Reply to  Doug

Wikipedia, citing David Jordan’s 2010 book, says «Baker Bowl, also called “Baker Field” in the baseball guides, referred to one-time Phillies owner William F. Baker. The use of “Baker Field” was perhaps confusing, since Columbia University’s athletic facility in New York City was also called Baker Field. How it acquired the unique suffix “Bowl” is subject to conjecture. It may have referred to the banked bicycle track that was there for a time, or it may have been used derisively, suggesting non-existent luxuriousness. “The Hump” referred to a hill in center field covering a partially submerged railroad tunnel in the… Read more »

Paul E
Paul E
6 years ago
Reply to  oneblankspace

OBS
From a NYT article 11/20/1982:
“The wooden stands of Baker Field, a many-splintered thing to generations of Columbia students since 1928, will support the university’s football fans for the last time today.”
…but this Baker Bowl in Philadelphia was in existence since 1900. So, you’re probably on to something with the “banked bicycle track” idea

Doug
Doug
6 years ago

Responding to nsb about my comment re: aggressive baserunning. I agree with you. Overly aggressive baserunning doesn’t make sense. In fact, doesn’t make much sense to be running period, with runs so easy to come by (unless you’re a bad team playing a good one, and you’re thinking you’ll need every run you can get just to keep up). I also speculated that perhaps the opposition got wise to Klein as the season progressed … but they didn’t: 12 of his assists were in September, and 29 from July to end of the season. I suspect there was a sense… Read more »

Doug
Doug
6 years ago

We’ve been talking so much about Klein’s assists, but his counting numbers that season were way off the charts. In particular, his total for R+H+RBI of 578 is the highest mark ever, one of only ten seasons with 150 runs and 150 RBI (last one by Ted Williams in 1949). But, WAR isn’t so kind … only 6.5, including a negative Rfield score. In spite of all the assists, Klein had a negative Rfield score in every season played in the Baker Bowl, but positive Rfield in each of his seasons at Wrigley. By today’s standards, he made a ton… Read more »

e pluribus munu
e pluribus munu
6 years ago

Just want to say that I really enjoyed reading these exchanges on Klein’s season. Nice idea, nsb.

oneblankspace
6 years ago

Helton’s numbers are so dominant, no other hitter even comes close. 1. T.Helton 2. Ra.Johnson 3. G. Maddux 4. T. Glavine 5. J. Bagwell 6. Ba. Bonds 7. K. Brown 8. V. Guerrero 9. C. Schilling 10. N. Perez Guerrero may have been higher, but how valuble could he be on a 67-95 team that would have been the wild card in the relegation playoffs? Bonds had four top-four finishes on a division champ. Randy Johnson led in strikeouts, complete games, and shutouts, and finished in the top 4 in wins, ERA, and innings pitched. Maddux tied for the lead… Read more »

Paul E
Paul E
6 years ago

Win Shares 36.9 Jeff Kent 34.1 Barry Bonds 32.1 Edgardo Alfonso 31.6 Andruw Jones 30.6 Gary Sheffield 29.9 Todd Helton 29.8 Jim Edmonds 29.1 Sammy Sosa 28.9 Mike Piazza 28.9 Vladimir Guerrero VORP (Baseball Prospectus) 89.4 Barry Bonds 88.9 Randy Johnson 78.9 Jeff Kent 74.4 Gary Sheffield 72.7 Brian Giles 71.5 Chipper Jones 70.0 Edgardo Alfonso 69.2 Todd Helton 67.7 Andruw Jones TAV (True Average – Baseball Prospectus) .363 Bonds .354 Ellis Burks .351 Sheffield .339 Guerrero .338 Kent .335 Helton .333 Sosa .330 Alfonso .328 Giles .326 Piazza RC/G (AIR Adjusted) 10.90 Bonds 9.727 Helton 9.582 Sheffield 8.732 Giles… Read more »

Doc
Doc
6 years ago

Take away the steroid guys and Guerrero wins 2-4 more MVP’s. But PEDs did what they did.

Jimbo
Jimbo
6 years ago
Reply to  Doc

How do you know Guerrero took nothing?

Doc
Doc
6 years ago

Guerrero
Edmonds
Helton
Kent
No point naming more

David P
David P
6 years ago
Reply to  Doc

You need to list 5 or more candidates. 🙂

Hartvig
Hartvig
6 years ago
Reply to  Doc

You need at least 5 names in order for your ballot to count.

Dr. Doom
Dr. Doom
6 years ago
Reply to  Hartvig

You’re back, Hartvig! Good to see you again! Computer issues solved?

Paul E
Paul E
6 years ago

OPS+ age 28-32 PIT NL OF 1,500 PA
158 Giles
154 Stargell
147 Clemente
146 Clarke
139 Waner

OPS+ PIT NL 3,000 PA
158 Giles
157 Kiner
153 Wagner
147 Bonds
147 Stargell
141 Vaughan
138 Clarke
138 McCutchen
136 Waner

Richard Chester
Richard Chester
6 years ago

Here are my votes:

1) Helton
2) Bonds
3) Sheffield
4) Guerrero
5)Kent
6) Maddux
7)Piazza
8) Bagwell
9) Sosa
10) Giles

Helton’s home/road OPS is 1.242/1.074. so he was excellent at both home and on the road. His OPS+ of163 was third in the league behind Bonds and Sheffield but he had a significant advantage in runners driven home.

Richard Chester
Richard Chester
6 years ago

Should read “…significant advantage in percentage of runners driven home”.

no statistician but
no statistician but
6 years ago

To my mind Doom has picked another race that seems almost impossible to sort out on the basis of seasonal stats. Too many players had good years that, while not being interchangeable, were very similar. The top 11 players in the vote each drove in over a hundred runs, ten of the 11 scored over a hundred, and only one had an OPS of less than .970. Home run totals ranged from 33 to 50. So how do you make distinctions? Let’s go negative and look for chinks in the armor: Mike Piazza batted just .222 in September with a… Read more »

Josh Davis
Josh Davis
6 years ago

I like this approach and I’m inclined to agree closely with your final vote, but just to play devil’s advocate: Helton’s Rockies finished 5 games below their Pythagorean W-L and 12 games out of the playoffs (closer than Houston, but not particularly close). How come Helton avoids drawing your ire?

Also, one could make the argument that although Piazza’s second half was nothing spectacular, his fantastic first half put the Mets into position to make the playoffs, something that despite Helton’s efforts, the Rockies were unable to do.

no statistician but
no statistician but
6 years ago
Reply to  Josh Davis

Josh: I wrote a long reply that got lost. Basically I said that Helton’s season was a lot better than those of the boys from Houston( or anyone else in the league), his road stats are outstanding, so he wan’t just succeeding at Coors, he supplied 43.6% of the Rockies player WAR, and five games is just over the line in my view, as far as Pyth W-L is concerned, whereas nine games is out of bounds. On Piazza: When the season is young the pressure to perform isn’t the same as it is in the heat of a pennant… Read more »

Josh Davis
Josh Davis
6 years ago

Thanks for that 46% of the team WAR number. It quantifies what I’ve been thinking (which is similar to what you’ve been thinking): The Rockies without Helton would have been a sorry sight indeed. Although they were barely a .500 team with him, it is hard to argue that anyone else was more important to his team.

Paul E
Paul E
6 years ago

NSB, JOSH,
“……he supplied 43.6% of the Rockies player WAR….”
You’re talking about offense and defense, but not pitching? Just curious, where would this rank in a typical season for a Rockies’ player? Like Walker in his MVP season? Or, for that matter, all-time? If you’re talking about offense and defense, I believe Allen in 1972 with the CWS had 77 % “of the White Sox WAR”. But, that was an era of extreme low scoring versus the high-flying 1993-2006 era.

no statistician but
no statistician but
6 years ago
Reply to  Paul E

Paul E: We all have our methods of evaluation, but I think you’re picking up a little on the WAR % out of context. I included a few other reasons for picking Helton, the strongest to me being his play away from Coors. Adjusting to stadiums that aren’t hitting paradises after long home stretches a mile high is problematical, but in this particular season Helton overcame the difficulty. The other reasons listed, though, were nearly as strong. On the WAR % issue my own often stated view is that the MVP award shouldn’t go to a player on a team… Read more »

Dr. Doom
Dr. Doom
6 years ago

I’m glad you appreciate the challenge of picking a 2000 MVP, nsb! It’s kind of hard to find these seasons wherein the seasonal stats don’t give you a pretty clear picture of at least a few of the top performers.

Voomo Zanzibar
Voomo Zanzibar
6 years ago

In defending St. Louis’ big contract extension to Yadier Molina, the GM just said:
“This is about us retaining the greatest catcher ever to wear the Cardinals uniform.”

I know he is referring to defense and pitcher-management, but certainly Ted Simmons has a beef here.
Simmons career in St. Louis spanned 300 more PA than Yadi has right now. Here’s their slashes:

.298 / .366 / .459 / .824 / 127
.285 / .339 / .400 / .739 / 99

184 / -19 / -17 / -13
-15 / -29 / -19 / 112

Paul E
Paul E
6 years ago
Reply to  Voomo Zanzibar

OPS +, age 25-30, Catchers

1 159 Mike Piazza
2 141 Joe Mauer
3 138 Buster Posey
4 138 Ted Simmons
5 136 Gene Tenace
6 136 Mickey Cochrane
7 134 Bill Dickey
8 133 Yogi Berra
9 133 Roger Bresnahan
10 132 Roy Campanella

Paul E
Paul E
6 years ago
Reply to  Voomo Zanzibar

WAR, C, Age 25 -30 1 39.3 Gary Carter 2 34.4 Mike Piazza 3 33.2 Johnny Bench 4 32.2 Ivan Rodriguez 5 31.5 Mickey Cochrane 6 30.7 Yogi Berra 7 30.5 Thurman Munson 8 30.3 Joe Mauer 9 28.3 Buster Posey 10 27.7 Ted Simmons Simmons is 7th overall in oWAR as well. IMO, Simmons always suffered from comparisons to his contemporary, Johnny Bench. If his defense was that horrendous, I believe they would have moved him to LF or 1B a lot sooner than Herzog tried to. Being the 2nd or 3rd best player in the whole wide world… Read more »

Dr. Doom
Dr. Doom
6 years ago

Ugh. I worked so motherfarking hard on a super long post, and of course the tab somehow accidentally closed. I’ll try to remember what all I wrote. Basically, here are some items of interest. The AVERAGE team in the 2000 NL scored 5 R/G. Of course, only 5 teams were above average, but three of them were more than 100 runs above average! The Rockies (968), Astros (938) and the Giants (925) all had all-time offensive seasons. In spite of all that scoring, four players participated in 25% of their teams’ runs or more – Sammy Sosa (25.4), Jeff Bagwell… Read more »

Voomo Zanzibar
Voomo Zanzibar
6 years ago
Reply to  Dr. Doom

Barry didn’t really miss much time.
4 games in May. 6 in July. And a regular day off here and there for a 35-year-old.
He had 607 PA.

Dr. Doom
Dr. Doom
6 years ago

REMINDER: Last day to get your vote in, so don’t forget!!

Josh Davis
Josh Davis
6 years ago

1. Todd Helton
2. Barry Bonds
3. Jeff Kent
4. Vladimir Guerrero
5. Jeff Bagwell
6. Andruw Jones
7. Jim Edmonds
8. Edgardo Alfonzo
9. Mike Piazza
10. Brian Giles

Honorable mentions to Sosa and Sheffield.

Brendan Bingham
Brendan Bingham
6 years ago

Vote:

1) Todd Helton
2) Barry Bonds
3) Andruw Jones
4) Jeff Kent
5) Mike Piazza
6) Randy Johnson
7) Gary Sheffield
8) Edgardo Alfonzo
9) Kevin Brown
10) Jim Edmonds

Dr. Doom
Dr. Doom
6 years ago

Well, I have to be honest – I didn’t see this coming. I really didn’t see someone nearly winning this unanimously. I mean, I thought this was perhaps the strongest, most interesting class of players – but then again, we were down to a much lower number of voters than usual, so that was a contributing factor). To some extent, there’s evidence of that – our voting, while producing a near-unanimous winner AND a near-unanimous runner-up, was much more interesting down-ballot. So without further ado, here are your results (the number is the point total, with first-place votes in parentheses):… Read more »

no statistician but
no statistician but
6 years ago
Reply to  Dr. Doom

Doom:

What happened here, I think, was that the competition was so heavy, the candidates so similar in their performances, that going to Helton as the best overall player with the biggest impact on his team seemed the obvious default. As for the low turnout, I hope that was the reason too—a winner was too hard to isolate.

Paul E
Paul E
6 years ago

here’s some Larry Walker numbers for a few years in Colorado where he stayed on the field long enough :
1997 9.8 of team’s 22.2 WAR (83-79) ~ 44% wins M V P
1998 5.7 of team’s 17.8 WAR (77-85) ~ 32%
1999 5.1 of teams 1.6 WAR (72-90) ~320%

Yes, those numbers are correct for 1999. That’s when Walker appears to be the most valuable?