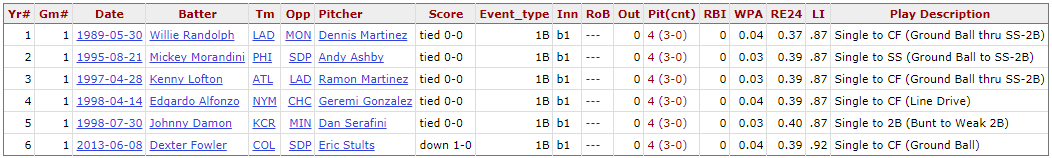
Last week Anthony Rizzo, first baseman for the Chicago Cubs, hit leadoff for the first time in his seven year career. Before Rizzo’s first at bat, Cubs’ color man Jim Deshaies recalled:
Big Riz did it a couple of times in spring training, and on one occasion he went out there and ambushed the first pitch and hit a home run.
Two pitches into the regular season version of this experiment Rizzo hit a leadoff home run. The next evening Rizzo, still batting in the No.1 spot, made an impact one pitch sooner by hitting the first offering of the game over the outfield fence.
Rizzo has continued to lead off for the Cubs, and last night smacked a 1-0 pitch from San Diego Padres starter Jhoulys Chacin over the Wrigley ivy for the third leadoff home run of his career, all coming in the first two pitches of the at bat. In his four leadoff plate appearance between the second and third home runs he hit a double, two singles and walked once, making no outs.
While Rizzo may be new at leading off, he’s following the example leadoff hitters have set in the last season and a half. Last year I wrote about the out-sized impact leadoff hitters were having in their first plate appearance of the game. To recap: in 2016, the first batters of the game, defined as the first plate appearance for both the home and away leadoff hitter, hit better than they have in decades and, in all likelihood, ever.
First batters had an OPS of .802 last season, having never been higher than .780 in the previous 42 years (1974 is the first year where consistent data in this split is available). Their adjusted OPS relative to the league OPS (known as tOPS+ on Baseball-Reference) was 118, having never been higher than 111, and only once higher than 107.
Statistics for first batters of the game and league averages in 2016
| Split | BA | OBP | SLG | OPS | BABIP | ISO |
|---|---|---|---|---|---|---|
| First Batters | .284 | .344 | .462 | .806 | .326 | .178 |
| League Average | .255 | .322 | .417 | .739 | .300 | .162 |
| Difference | +29 | +22 | +45 | +67 | +26 | +16 |
This success was built largely on slugging. Batting average and on-base percentage were up on the league by 29 points and 22 points respectively, but slugging was up a massive 45 points on the league average, leading to a 67 point advantage in OPS.
First batters hit 156 home runs last season, smashing the previous record of 119 set in 2006. Home runs have increased league-wide, but first batters also had a higher home run rate than the league average for the first time in the 43 year sample.
Isolated power, a measure of slugging ability, was up 16 points on the league, which was also the first time that first batters had a better ISO than the league. They’d averaged 19 points worse than the league since 1974.
These trends are continuing this year:
Difference between first batters of the game and league averages
(+1 represents 1 point of batting average, on-base percentage etc)
| Year | BA | OBP | SLG | OPS | BABIP | ISO | TOPS+ |
|---|---|---|---|---|---|---|---|
| 2017 | +16 | +5 | +37 | +41 | +12 | +21 | 110 |
| 2016 | +29 | +22 | +45 | +67 | +26 | +16 | 118 |
| 2015 | +9 | -3 | 0 | -2 | +10 | -8 | 99 |
| 1974-2015 averages | +8 | +6 | -13 | -7 | +12 | -20 | 96 |
Historically, the first batter of the game has been above average in terms of batting average and on-base percentage, but well below average in slugging and isolated power. The deficiencies in those latter two statistics have been transformed into large positives in the last two seasons.
First batters are hitting .271/.329/.463 so far this season, good for a .791 OPS. That OPS is better than any season from 1974 to 2015 and only one season in that timeframe saw a better tOPS+. Their slugging percentage and home run rate this season is actually up on last year, with first batters on course to break last year’s record 156 home runs; the 77 homers they’ve hit in 2017 is already more than first batters hit in 24 different seasons in the sample. First batters are also continuing to hit homers at a better rate than the league, an unprecedented feat prior to 2016.
Assuming this is not the act of randomness, one would be inclined to believe that the quality of these first batters has changed. After all, if Anthony Rizzo, a classic No. 3 / cleanup hitter, is seeing at bats there, perhaps lineup ideology has changed in the last two years.
However, the batters at the top of the order aren’t carrying their first plate appearance performance into the rest of their plate appearances.
Difference between first batters of the game and all other plate appearances by hitters in the No. 1 spot in the lineup
| Year | BA | OBP | SLG | OPS | BABIP | ISO |
|---|---|---|---|---|---|---|
| 2017 | +13 | -1 | +56 | +55 | +12 | +43 |
| 2016 | +14 | +6 | +48 | +54 | +16 | +34 |
| 2015 | -7 | -18 | 0 | -18 | -5 | +7 |
| 1974-2015 averages | -4 | -6 | +1 | -5 | +1 | +5 |
Batters in the No.1 spot are performing vastly better in the first plate appearance of the game than they are in later plate appearances. Comparing these first PA with all other PA by No.1 hitters reveals that batting averages are up in these first PA, mostly driven by a high Batting Average on Balls in Play (BABIP). Last season OBP in No.1 hitters’ first plate appearances was higher than in subsequent ones for the first time this millennium, and this year the difference is minuscule.
But once again, it’s the slugging percentage where the difference really shows. No.1 hitters are slugging more than 50 points better in the first PA of the game than in their subsequent PA, tearing up the precedent of the previous 42 years where the difference has, on average, been indistinguishable. Isolated power by first batters is up by over 30 points versus the rest of their PA , while the average difference has been just five points since 1974.
Let’s rule out some possible reasons for the relative increase in performance by first batters. Firstly, pinch hits in the No.1 spot later in the game are not having an undue affect on performance. Over the last decade, pinch hits in the No.1 spot have accounted for less than 1% of PA in this batting order spot and aren’t noticeably dragging down performance.
Secondly, the relative performance of hitters in the No.1 spot after the first inning is within established norms. Their HR/PA and Isolated Power have risen with the league, just not to the same degree as in the first PA. Their relatively poor performance this year can largely be attributed to bad luck on balls in play.
Plate appearances by hitters in the No.1 spot in the lineup after the first inning
| Year | OPS | BABIP | ISO | tOPS+ |
|---|---|---|---|---|
| 2017 | .737 | .299 | .149 | 97 |
| 2016 | .752 | .310 | .144 | 104 |
| 2015 | .737 | .314 | .135 | 105 |
| 2014 | .717 | .316 | .119 | 105 |
| 2013 | .723 | .309 | .123 | 105 |
Neither is this a trend affecting all batters in the first inning. All batters in the first inning have consistently hit above league average, and that has held true in the last two seasons. But last season the first batters of the game had an OPS 33 points better than all other hitters in the first inning, having averaged 40 points worse since 1974. The isolated power of first batters was better than all other first inning batters for the first time on record, having been 30 points worse on average since 1974. Similar trends are on display this season, with first batters’ slugging percentage and isolated power outpacing all other first inning hitters for only the second time on record.
What is happening in these first PA then? Statcast data confirms that the increased performance is backed up by improved underlying numbers. Average exit velocity by first batters has been above league average in both 2016 and 2017, having been below it in 2015 (the first year Statcast data was publicly available).
The percentage of balls hit at 95+ mph by first batters (the point at which batted balls become productive, per Dave Cameron of Fangraphs) is within half a percentage point of the league average in the last two years, having been more than three percentage points below league average in 2015. The launch angles of first batters have also risen compared to league average in 2016 and 2017.
Data from Fangraphs shows how profile of first batters relative to the rest of their PA has changed over the years.
Difference in percentage points between first batters of the game and all other plate appearances by hitters in the No. 1 spot in the lineup
| Year | Fly Ball % | Ground Ball % | Home Run / Fly Ball % | Hard Hit % |
|---|---|---|---|---|
| 2017 | +3.2 | -3.1 | +2.2 | +1.8 |
| 2016 | +4.4 | -6.2 | +1.8 | +2.8 |
| 2015 | +2.8 | -2.3 | +0.8 | +1.2 |
| 2014 | +1.6 | -1.3 | +0.8 | +1.1 |
| 2013 | +2.8 | -2.2 | -0.1 | +1.8 |
As could be expected, first batter fly balls rates are up and ground ball rates are down relative to their later plate appearances. First batters are also hitting the ball harder and homering more often as a result.
When I investigated this phenomenon last year, I theorized that first batters’ increased performance resulted from an attempt to do damage earlier in the count. The thinking went that pitchers had been getting away with an easy strike one on the first batter of the game, and were throwing fatter pitchers on their first pitch (or first few pitches) of the game.
Data from Baseball Savant bears this theory out somewhat. First batters have increased their swing rate on the first pitch by a large amount in the last few seasons, swinging at 19.1% of first pitches since 2015, compared to an average of 12.9% in the previous seven years.
Not only are first batters swinging more on the first pitch, they’re swinging at better pitches. From 2008-2014 first batters swung on first pitch offerings in the heart of the strike zone 23.9% of the time. In the last three seasons they’re swinging at those middle-middle first pitches 33.3% of the time, and are swinging at a whopping 42.3% of those pitches this season.
First batter swing rates on the first pitch of the game
| Year | Swing % on 1st pitch | Swing % on middle-middle 1st pitches | Swing % on 1st pitches in strike zone |
|---|---|---|---|
| 2017 | 19.5 | 42.3 | 29.2 |
| 2016 | 17.6 | 30.0 | 26.2 |
| 2015 | 20.5 | 33.5 | 29.2 |
| 2014 | 12.4 | 22.4 | 17.8 |
| 2013 | 12.5 | 24.9 | 17.9 |
| 2008-2014 averages | 12.9 | 23.9 | 18.5 |
There seems to be a good reason to swing early in the count. wOBA (a measure of offensive output scaled to league OBP) in these first PA is higher when the ball is put into play early in the count. And first batters have been putting the ball into play more frequently in the last few seasons than in previous years.
wOBA on balls in play (BIP, includes home runs) in first batter plate appearances
(Data collected on June 10th, 2017)
| Year | 1st pitch | 2nd pitch | 3rd pitch | All pitches | BIP% on pitches 1-3 |
|---|---|---|---|---|---|
| 2017 | .395 | .363 | .447 | .396 | 16.6 |
| 2016 | .471 | .395 | .397 | .400 | 15.1 |
| 2015 | .421 | .368 | .325 | .362 | 15.6 |
| 2014 | .369 | .322 | .348 | .352 | 13.9 |
| 2013 | .439 | .351 | .354 | .345 | 14.7 |
Perhaps the surge in slugging can be explained by Jeff Sullivan’s theory of the rise of the middle class of home run hitter. The theory goes that, with exit velocity and fly ball distance up across the game, the players who stand to benefit the most are those who hit a larger frequency of balls to the warning track.
Elite sluggers don’t benefit all that much from an extra few feet of distance on their 450 foot home runs, but those with slightly less power get a greater benefit from those extra feet, turning fly outs into home runs. This middle class would seem to describe your typical lead off batter, who might be a good contact hitter, but has consistently slugged at a lower level than the rest of the league.
That still doesn’t explain why No.1 hitters are performing so much better in the first plate appearance. My leading theory remains that hitters have increasingly been taking advantage of starting pitcher rustiness in the first few pitches of the game – ambushing them, as Jim Deshaies put it. First batters are hitting the ball harder and further, and putting the ball into play earlier in the count. However, I’m still not sure if this entirely accounts for their rise in performance. If anyone else want to help solve this mystery then I’m all ears.