Baseball’s Takeaway/Giveaway Leaders

As football season gets underway, here’s a look at baseball’s version of the takeaway/giveaway margin. On the gridiron, the unit of measurement is turnovers and winning teams usually need to show a positive margin between turnovers forced (takeaways) and turnovers surrendered (giveaways). In baseball, the metric is more like points off of turnovers, as this post will consider unearned runs scored vs. unearned runs allowed, those runs being the “points” arising from errors forced and errors committed, More after the jump.

Here are this year’s leaders (through Aug 31) in Takeaway/Giveaway margin, that is unearned runs scored minus unearned runs allowed.

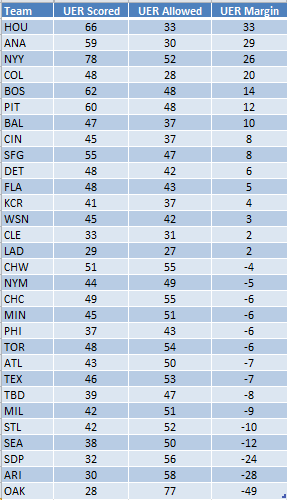
The Astros lead the way with the second best UER Scored and fourth best UER Allowed. The Dodgers, the other runaway league leader, have done things a bit differently with the second lowest UER Scored, but also (and more importantly) the lowest UER Allowed, an approach also favored by last year’s AL champion Indians, the only other team to score and allow fewer than 40 unearned runs. The Yankees are the runaway leaders in UER Scored but rank only third in UER Margin, owing to a UER Allowed total ranking near the bottom of the pack.

Surprises for me in this table include: the Orioles, with indifferent pitching but a lowish UER Allowed total; the Dodgers with so few unearned runs scored; and the D-Backs, challenging for a wildcard berth with the second worst UER Margin.


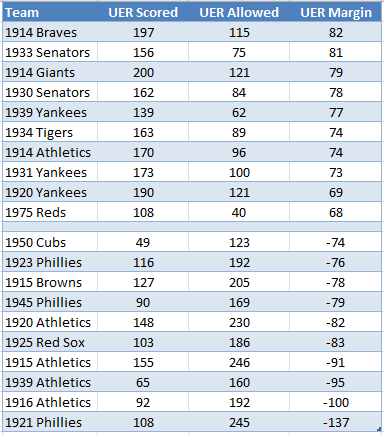
To provide some historical perspective here are the range of team UER Margin totals by season since 1913.

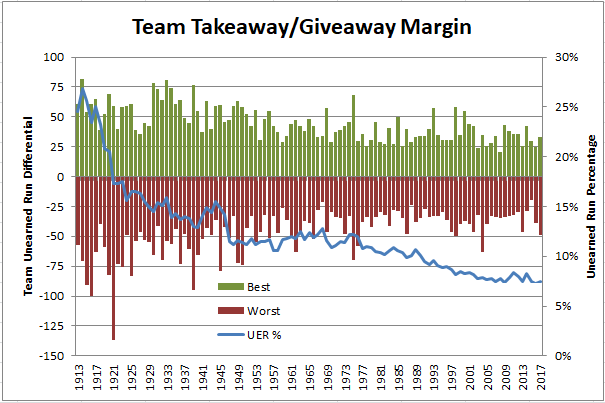
Today’s margins, both positive and negative, are nothing like what was seen 50 to 100 years ago. The reason, of course, is the decline in unearned runs as a proportion of total runs (blue line), a trend reflecting better athletes, better equipment and, in recent years, better technology that has been used to position players on the diamond for (hopefully) optimal defensive utility.

After about 30 years with little change in unearned run rates, these started to decline in the last half of the 1970s for the reasons alluded to, but also due to the increase in strikeout rates that continues, seemingly unabated, to this day. More strikeouts means fewer balls in play and fewer chances to commit errors that lead to unearned runs.

As would be expected, pennant winners have generally done well in takeaway/giveaway margin, especially in the years preceding divisional play, as shown below.


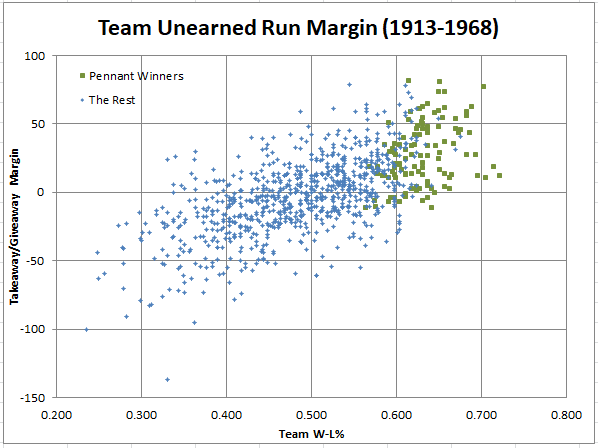
Almost every pennant winner recorded a positive or minimally negative takeaway/giveaway margin, and a number above +50 almost guaranteed a World Series berth. There are somewhat more teams that have a negative takeaway/giveaway margin compared to those with a positive total, reflecting the imbalance through most of this period of a few dominant teams but many more mediocre ones.

Since the inception of divisional play and a longer road to a pennant title, the chart looks a bit different (the post-season qualifiers are shown either as a pennant winner or by their regular season finish, but not both).

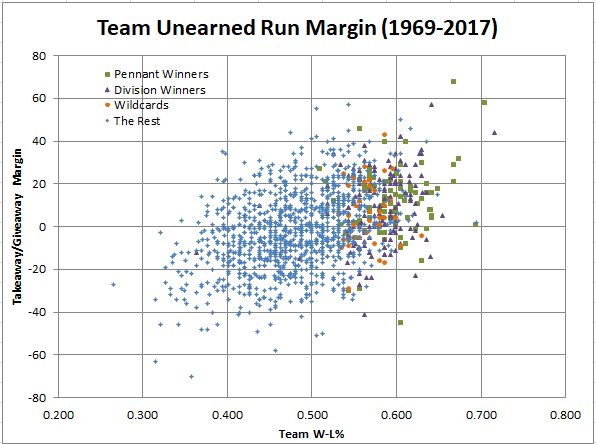
Some notes on the chart above.

  • As was suggested by the first chart. the magnitude of the takeaway/giveaway margin has declined appreciably from the preceding period, reflecting a lower proportion of total runs that are unearned.
  • As with the preceding period, pennant winners usually post a positive takeaway/giveaway margin but, with the declining magnitude of the margin (and, therefore, its significance), more teams reach the post-season with a negative margin.
  • There is less skewing of the data to negative margins, likely reflecting more performance parity among teams in  the divisional era.

The question that remains, though, is whether a good takeaway/giveaway margin is a cause or an effect of championship-caliber teams. To answer that question, I looked at the takeaway/giveaway percentage margin

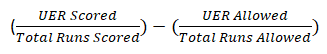
being the difference between the percentage of runs scored that are unearned and the percentage of runs allowed that are unearned.

This approach looks at scoring and allowing unearned runs in each team’s own offensive and defensive context so that a positive result indicates a team that had a higher proportion of runs scored that are unearned than runs allowed, regardless of whether the absolute margin was positive. Similarly, a negative margin reflects a higher proportion of unearned runs allowed than unearned runs scored, regardless of whether the absolute margin is negative. Thus, if achieving a good takeaway/giveaway margin leads to team success, the same pattern observed for absolute takeaway/giveaway margin by successful teams should also hold for the percentage margin.

But, does it? Plotting team results for the same two periods as above shows this result.


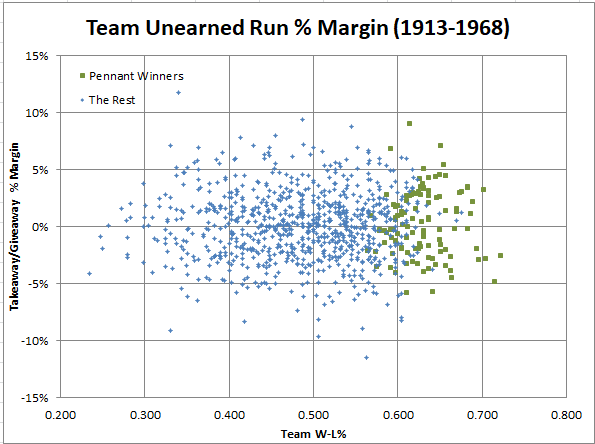
No discernible pattern here with pennant winners mixed in more or less randomly with the rest of the teams, for both typical ( +/- 5%) and extreme results.

Similar story for the divisional era.


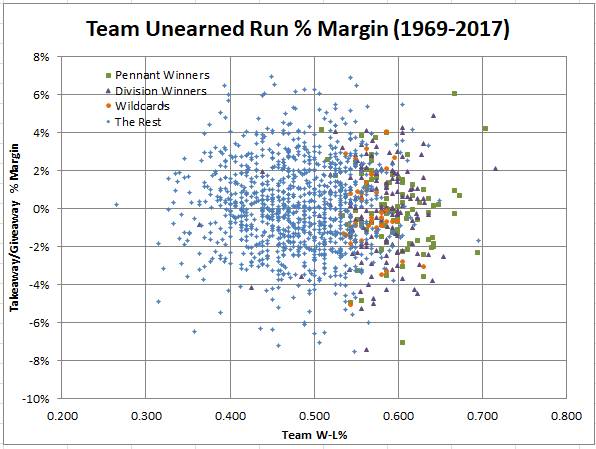
The one noteworthy aspect of this illustration is that the increase in playoff teams starting in 1995 has, probably unsurprisingly, produced a greater variance in this metric, with slightly more playoff teams in negative territory than positive. Teams with good offense and good pitching, but average or worse defense, can certainly make the post-season but will be hard-pressed to record a positive number in the percentage metric owing to allowed unearned runs representing a relatively large proportion of a smaller number of total runs allowed.

The results shown in the last two charts are suggestive of takeaway/giveaway margin being an effect of being a good team rather than a cause. That is, good teams are not good because they have a good takeaway/giveaway margin. Rather, good teams are likely to have a good takeaway/giveaway margin because they are good teams (much as can be said about good football teams).

For those who would like to take a closer look at the data, you can find it here. Note that in B-R’s P-I Split Finder results (the source of these data) a franchise’s current city abbreviation is used for all of the franchise’s seasons. This can lead to some surprising data like OAK 1917, for example, which, of course, is really PHA 1917.

0 0 votes
Article Rating
Subscribe
Notify of
guest

47 Comments
Oldest
Newest Most Voted
Inline Feedbacks
View all comments
e pluribus munu
e pluribus munu
6 years ago

Doug, I appreciate the extremely detailed work here (too detailed for my eyes in the final charts!). I’ve never seen these sorts of figures or thought about ways to measure the relationship between unearned runs and team quality, as opposed to fielding stats and team quality. I have a couple of thoughts that you may be able to respond to. I’m not at all clear why the percentage margin is a better guide than the absolute margin. The percentage applied to runs allowed presumably tends to reflect the relative strengths of pitching and fielding, but not the absolute strengths, so… Read more »

Doug
Doug
6 years ago

The reason for introducing the percentage margin metric was not because it’s a good or meaningful metric (it’s not). Rather, it was to test the hypothesis that a good UER Margin is an effect of having a good team, rather than a cause. That hypothesis is based on the perceived “built-in” advantages in posting a good UER Margin that good teams enjoy, namely: – scoring lots of runs, which will usually include a goodly number that are unearned, based on having more men on base because of more balls in play and, therefore, more chances for errors – giving up… Read more »

e pluribus munu
e pluribus munu
6 years ago
Reply to  Doug

Ah – I see your reasoning now, Doug. Thanks for your patient response.

e pluribus munu
e pluribus munu
6 years ago
Reply to  Doug

Yes, much clearer. Thanks, Doug!

kds
kds
6 years ago

In the very first chart you have MIN twice and WSN (my nats) not at all.

Doug
Doug
6 years ago
Reply to  kds

Sorry about that, kds. I’ll fix the chart.

The Nats are the first MIN on the chart with a +3 UER Margin.

David P
David P
6 years ago

The record for most runs allowed in a season with all of them being earned is held by Joel Piniero. In 2005, he gave up 118 run, all earned. The record “makes sense” since the Mariners were tied for the fewest errors in the majors that year (86). What doesn’t make sense is the record he broke. In 1976, pitching for the Atlanta Braves, Dick Ruthven gave up 112 runs, all earned. That Braves team committed 167 errors, nearly twice as many as Piniero’s Mariners. Four other pitchers on that team gave up double digit unearned runs, including Bruce Dal… Read more »

e pluribus munu
e pluribus munu
6 years ago
Reply to  David P

Maybe Ruthven just left no room for unearned runs: he led the league in earned runs surrendered. I suppose the real way to answer the baffling question of how Ruthven dodged unearned runs is to look game by game. The Braves committed no errors in Ruthven’s initial two starts, but there were two errors behind him in his third start, on April 21: an errant pick-off throw (by the catcher) and a two-out ROE; neither did damage. (I did notice that over his first five starts, Ruthven’s relief pitchers encountered four in many fewer innings. For example, on May 1,… Read more »

oneblankspace
oneblankspace
6 years ago

If the run would have scored without the error, it’s earned. The earned inning on June 28th, giving the pitcher the benefit of the doubt: Single. –1/0 out, 0R Runner steals second. -2-/0, 0R Flyout to right -2-/1, 0R [at this point in real life, an unearned run has scored] Groundout to second, -2-/2, 0R 2-run Homerun, —/2, 2R [that unearned runner would have scored on the homerun, so his run becomes earned] Groundout to second, inning over, 2 earned runs scored [in real life, the inning ended here as well] On September 5th, they decided that either the run… Read more »

e pluribus munu
e pluribus munu
6 years ago
Reply to  oneblankspace

Good explanation, obs. I’ve managed to be a fan for almost 65 years without being clear on the way plays subsequent to the run in question scoring affect the scorer’s call. Your interpretation matches the B-R statement of the principle. I’m relieved to feel assured that no hanky-panky led to scorer prejudice. In considering pitching records, I’ve always tended to view high UER totals as a negative for the pitcher, indicating some softness to his ERA. That’s not wrong, but, of course, the counter view has equal weight: Ruthven’s ERA is rock hard, but that’s precisely what raises it to… Read more »

David P
David P
6 years ago

Wow, that was above and beyond!!! Just send me your address and I’ll be right over to mow your lawn! 🙂

e pluribus munu
e pluribus munu
6 years ago
Reply to  David P

Thanks, David, but when I stepped outside to take a post-post break the crabgrass rose as one to flaunt their bouffant hairdos at me, and I let my mower loose on them faster than a presidential tweet.

Doug
Doug
6 years ago
Reply to  David P

Ted Wilks was the first pitcher to record a qualified season with no unearned runs allowed when he posted a 2.64 ERA in 207.2 IP for the 1944 world champion Cardinals. As a team, the Redbirds allowed 13.5% unearned runs, or 15.4% for all of their pitchers except Wilks (the latter number slightly better than the league average of 15.8%). Of the other Cardinal pitchers, Max Lanier allowed 16 UER in 224.1 IP, or 0.64 per 9 IP, while Blix Donnelly recorded 8 UER in only 76.1 IP, almost one per 9 IP. At the other end of the spectrum… Read more »

no statistician but
no statistician but
6 years ago

To diverge from the subject at hand for a moment, the once nearly unbeatable Dodgers are on the way to losing their 9th game in 10 outings. The new hot team is Cleveland with a twelve game winning streak.

e pluribus munu
e pluribus munu
6 years ago

I’m sure they’d start winning again if the schedule put them back home for a few games, in Brooklyn, where they belong.

alz9794
alz9794
6 years ago

The Brooklyn franchise joined the NL in 1890. From 1890-1957 the Brooklyn franchise played 10,254 regular season games. From 1958-today the “Brooklyn” franchise has played 9,544 regular season games. Unless they move some time soon (and I don’t think that’s happening given that they’ve drawn 3 million fans every year since 1996 except 2000 and 2011 when they drew 2.8 and 2.9 million), they’ll be more LA than Brooklyn fairly soon, even though it may not seem like it. As for the Dodgers team name, they only played 4,337 regular season games under that name in Brooklyn. Though I agree… Read more »

e pluribus munu
e pluribus munu
6 years ago
Reply to  alz9794

Forget the letters on the caps. In 1956, Brooklyn began playing home games in Jersey City and in 1958 they began playing even more of them in Los Angeles. It’s just a ploy to get The City to offer them a bigger stadium with parking. In my opinion, it’s getting old.

Mike L
Mike L
6 years ago

Old ploy, but carried out with conviction.

oneblankspace
oneblankspace
6 years ago

They eliminated the Sox from the AL Central race on Labor Day Monday.

David P
David P
6 years ago

Indians have been playing well but to be fair many of those games have been against the AAA Tigers and White Sox.

Diamondbacks have also won 11 straight with 4 of those victories coming against the once unbeatable Dodgers.

no statistician but
no statistician but
6 years ago

Doug: Could you possibly identify the teams with the best and worst records in terms of takeaway and giveaway? I’m almost certain that the worst was the 1919 Athletics, although their W-L is not quite as bad as their 1916 predecessors. It’s interesting, to me at least, how that abysmal crew was transformed year by successive year into the juggernaut that won 411 games 1928-31. in 1920 Jimmy Dykes and Ed Rommel were added. In 1922 Joe Hauser and Bing Miller, 1923 Sammy Hale, 1924 Al Simmons and Max Bishop, 1925 Mickey Cochran, Rube Walberg, Lefty Grove, and the ancient… Read more »

e pluribus munu
e pluribus munu
6 years ago

My money’s on the ’21 Phillies. (It’s equally amazing to watch how those sad sacks were transformed into a pennant winning team in under thirty years.)

e pluribus munu
e pluribus munu
6 years ago
Reply to  Doug

In my speech at the award ceremony, I will modestly credit my parents and teachers with encouraging my encyclopaedic knowledge of unearned run history. But in my tell-all best seller, I will confess that my ignorance of that history was complete before Doug’s post, which originally included a chart showing an egregious outlier in 1921.

no statistician but
no statistician but
6 years ago

Those Phillies actually finished with 51 wins and had some decent players on board. The 1916 A’s, two years from having a plus 74 margin, came in at -100. Interesting that among the ten best there are only 6 pennant winners and three world champs. 1914 must have been quite a year for this stat, by the way, with three of the top ten all time.

Doug
Doug
6 years ago

Stan Baumgartner on those 1921 Phillies recorded 20 UER in only 66.2 IP for a 2.70 UERA to go with his 7.02 ERA. For the month of July, he had a 5.19 ERA and a 5.19 UERA.

Baumgartner played his entire career in Philadelphia, with varying results:
– 6-11 with 76 ERA+ in 189 IP for the Phillies
– 20-10 with 137 ERA+ in 316.2 IP for the A’s

e pluribus munu
e pluribus munu
6 years ago
Reply to  Doug

I’d never heard of Baumgartner before. Very interesting career; as his SABR bio indicates, unique for the 20th century. After playing for the two Philadelphia teams during the period 1914-26 (including a 5.1 WAR year in 1924), he wound up as the Inquirer‘s Phillies reporter (and a columnist for TSN) until his death in 1955. He was an institution in Philadelphia.

I don’t think you can ever run out of interesting baseball history you don’t know (I certainly won’t).

Daniel Longmire
Daniel Longmire
6 years ago
Reply to  Doug

Doug, my (admittedly incomplete) search unearthed Jim Rooker, who had 4 wins and 4 homers for the Royals in 1969.

Doug
Doug
6 years ago

Thanks Daniel,

e pluribus munu
e pluribus munu
6 years ago

nsb, Thinking about your point concerning 1914, Doug’s charts are somewhat surprising. For example, we might expect the 1939 A’s, with a huge deficit of -95 UER, to have been likely to induce among the seven other teams one that had a surplus high enough to make the top-10 list, and indeed that is the case: the ’39 Yankees, with +77. The case is similar with the 1920 AL Yanks & A’s. Yet the 1921 Phillies created a far greater pool of surplus UERs for the other seven NL teams to divide, and none appears on the top-10 list. Moreover,… Read more »

Doug
Doug
6 years ago

You’re making some interesting points I hadn’t thought of. I’ll post the whole set of data in a spreadsheet so you can take a look. The link is here.

I’m working on a follow-up to find out which teams gained the most advantage or suffered the greatest disadvantage, Pythag-wise.

e pluribus munu
e pluribus munu
6 years ago
Reply to  Doug

Doug, Your table offers more evidence that keys to deep forces of the universe may lie buried in baseball history.

Among the 35 worst teams in terms of UER margins, only two had records at or above .500. They are Chicago in 1914 and Cincinnati in 1917.

These two outlier teams had identical deficits of -61 UER.

Coincidence? Perhaps. But what are the odds?

And now look further and observe that these same teams also had identical W-L records of 78-76.

Coincidence? I think not!

Kahuna Tuna
Kahuna Tuna
6 years ago
Reply to  Doug

I looked at the seasons 1901-12 to see if any other teams might have come close to the 1921 Phillies’ negative UER margin. The most promising candidate, as I see it, is the 1908 Cardinals, who committed 349 errors in their 154 games, allowing 223 unearned runs. Without play-by-play data, of course, we can’t know exactly how many of their 375 runs scored were unearned; my crude extrapolation puts the figure at 106. Their -117 UER margin thus places them solidly in second place behind the ’21 Phillies. The 1908 Cards’ 349 errors committed sets a post-1900 single-season record by… Read more »

David P
David P
6 years ago

According to an article on CBS Sportline, the Diamondbacks have had the lead or been tied for 98 straight innings. That’s just short of the record (102 innings) set by the 2002 A’s. The 1942 Yankees are in second place with 101 innings.

The Diamondbacks will go for the record tonight against the Dodgers.

David P
David P
6 years ago
Reply to  David P

Also, the Indians are the first team with 13+ game win streaks in back to back seasons since the 60-61 Yankees.

e pluribus munu
e pluribus munu
6 years ago
Reply to  Doug

Those 1916 Giants streaks were noteworthy because the first was very long — 17 games — and all the games were road games, while the second and third are usually viewed as a single record-setting 26-game winning streak, with the tie being discounted (like a game with no ABs in a hitting streak). Those 27 games were all part of a single 31-game homestand. In those days, when teams traveled by train, road trips were often marathon affairs, reflecting the economics of time and money of involved in slow travel. Naturally, homestands were often long too, and this pattern applied… Read more »

e pluribus munu
e pluribus munu
6 years ago
Reply to  Doug

Yup. There’s a saying I’ve heard that a team can’t be great unless it beats the teams it’s supposed to beat, and the ’54 Indians certainly did that. Playing .500 ball with each of the real challengers was no shame; those were good teams, with high win percentages (.669 and .610). But those records were inflated by the unusual weakness of the five remaining teams (Boston was a “first division” team, 42 games out!), and that’s probably why the tremendous strength people saw in the Indians disappeared when they played the winners of the better-balanced NL (which, although itself unbalanced… Read more »

David P
David P
6 years ago
Reply to  Doug

Diamondbacks are now up to 13 wins in a row and Cleveland 14 in a row. Is this the first time that two teams have had streaks of that length at the same time?

Richard Chester
Richard Chester
6 years ago
Reply to  David P

The Braves had a 14 game winning streak from 7-26-2013 to 8-9-2013 and the Tigers had a 12 game winning streak from 7-26-2013 to 8-8-2013. That’s the longest I found. There has been a small number of partial overlaps.

Richard Chester
Richard Chester
6 years ago
Reply to  David P

From 5-27-53 to 6-14-53 the Yankees reeled off an 18 game winning streak. From 6-3-53 to 6-14-53 the Browns lost 14 straight. Both streaks ended on 6-16 when the Browns defeated the Yankees 3-1.

no statistician but
no statistician but
6 years ago
Reply to  David P

The curse of being noticed. Dodgers 1, Diamondbacks 0 after one inning in tonight’s game. Diamondbacks tied it up in the second, but . . ..