Sixty feet six inches and the birth of the power hitter

My previous post on the 1893 adoption of the 60 foot 6 inch pitching distance focused on the impact to pitchers. This follow-up post looks at batters and how their offensive stats were affected by the longer pitching distance. More after the jump.

To briefly recap, the 1892 season, the first with a new 12-team National League, saw teams score at a rate of 5.1 runs per game. The next year, the first with the new pitching distance, offense ballooned to 6.6 runs per game, then 7.7 R/G in 1894 and back to 6.6 R/G in 1895. From that point, runs drifted lower, returning to close to 1892 levels by 1898.

For this analysis, I’ll be looking at the 1893-95 seasons in comparison to the preceding years, using a study group composed of the 60 batters with 1000 PA from 1890 to 1892, and also from 1893 to 1895. Here are those players, listed alphabetically, with their rate stats for those two periods.


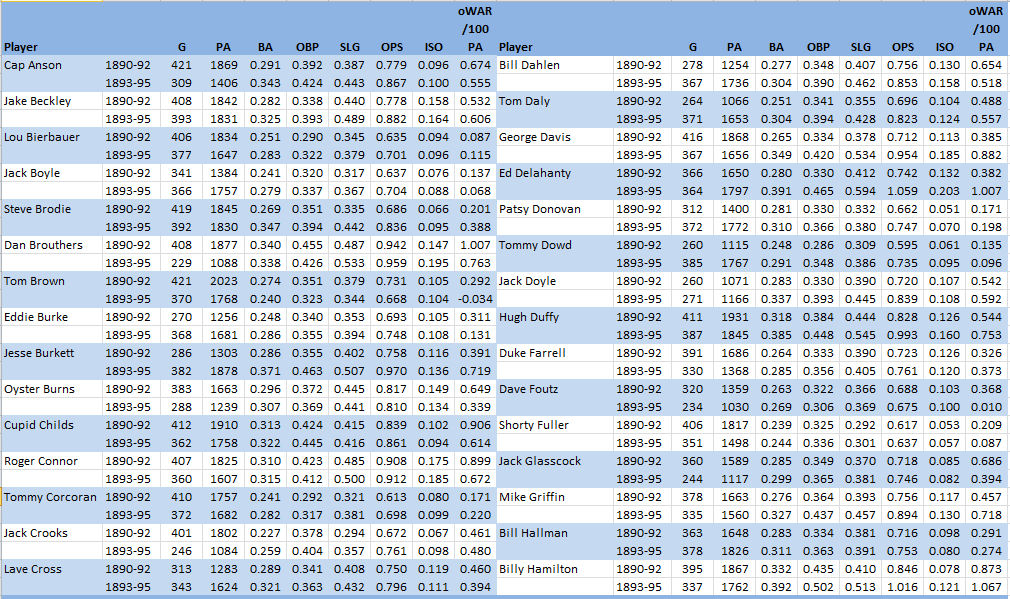
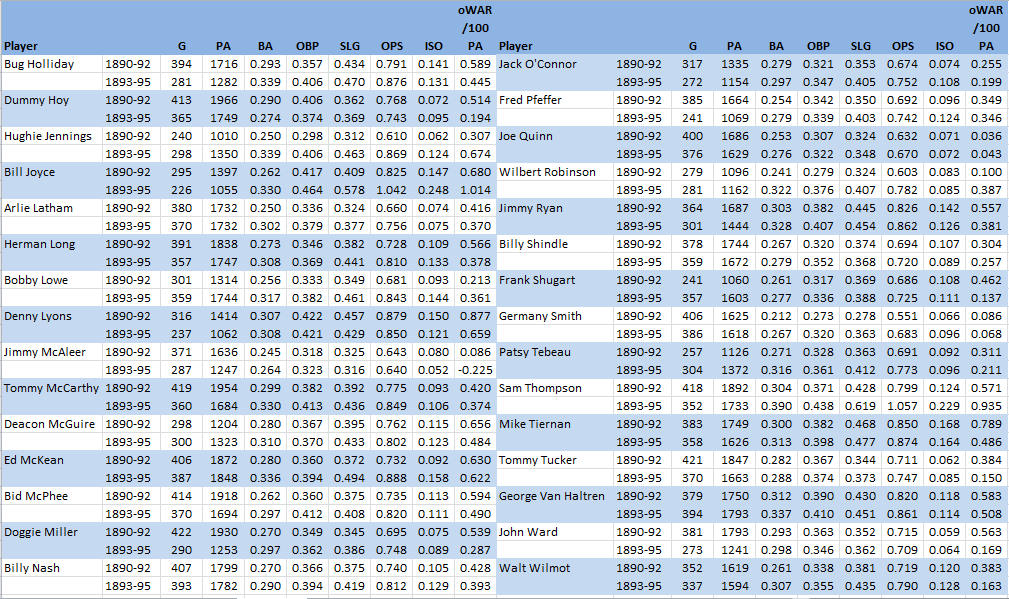
So, just about all of these players posted better results in the second period, with 57 of 60 posting a better BA, 51 a better OBP, 55 better slugging and 53 a better OPS. Fully 49 of the 60 players were better in BA, OBP and SLG. But, it’s a different story for the context adjusted oWAR measure, with barely a third of the players (21 of 60) posting a better result in the 1893-95 period.

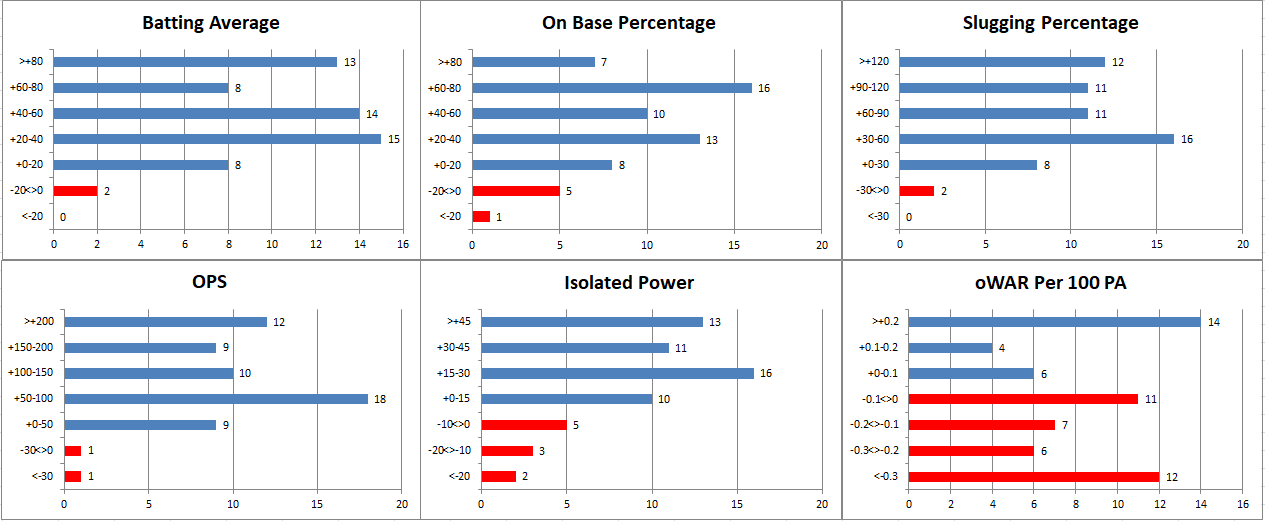
The charts below will give you an idea of the magnitude of those improvements.
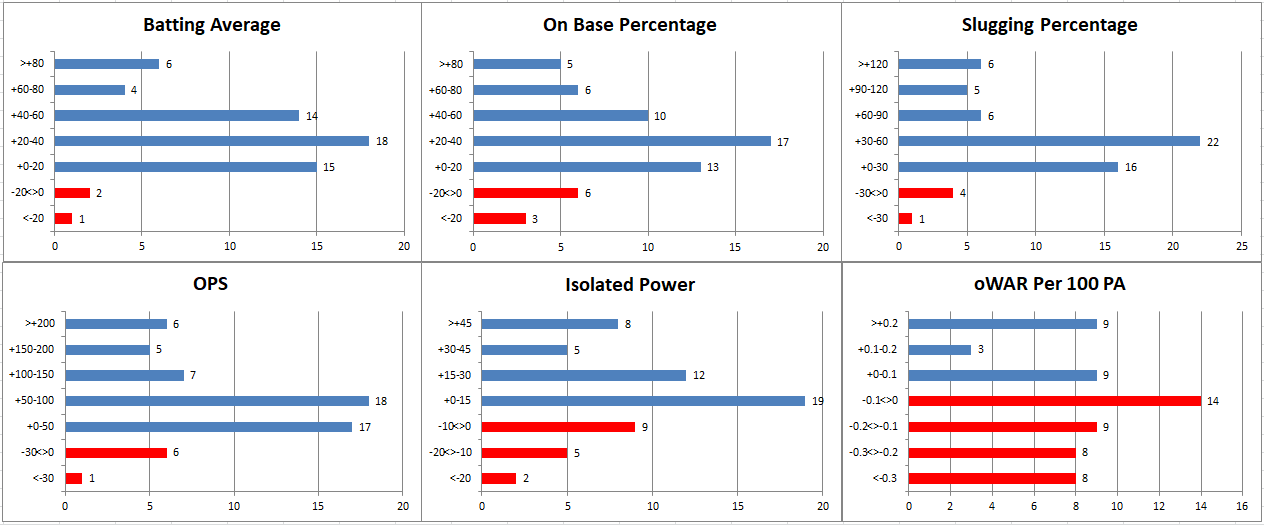
A bit more than half of the players saw their BA improve by up to 40 points, and another 40% improved by more than 40 points. Similar story for OBP with half improving by up to 40 points and a third by more than 40 points. Almost two-thirds saw their slugging increase by up to 60 points with more than a quarter improving by more than that. All of that added up to an OPS increase of 100 points or more for 30% of the players, and by 50 points or more for another 30%. Improvements in ISO were more “isolated” with almost 60% seeing either a decline or no more than 15 point jump. But, a different story for WAR, with almost two thirds seeing a drop in their oWAR per 100 PA, including 40% who saw a drop of 0.1 or more (or more than 0.5 oWAR for a full season).

Some will have already surmised that there were more differences between these two periods than just the pitching distance. Indeed, each of the three seasons in the 1890-92 period was quite unique, with three leagues and 25 teams in 1890, two leagues and 17 teams in 1891 and one league and 12 teams in 1892. With those contractions, one would presume that the level of competition was a good deal stiffer in each succeeding season. So, to provide a more apples-to-apples comparison, here is what the same charts look like comparing the 1893-95 period to just the 1892 season for our 60 study players.
All of our study players saw action in 1892, with 50 compiling 500+ PA, 56 over 400, and only one below 300 (Dave Foutz at 234 PA). As the above charts illustrate, the 1893-95 improvements previously seen were even more pronounced when compared to the more modest totals posted in a stronger 1892 NL. Improvements in WAR, though, were only a bit better with just 40% recording a higher oWAR per 100 PA in the 1893-95 period.

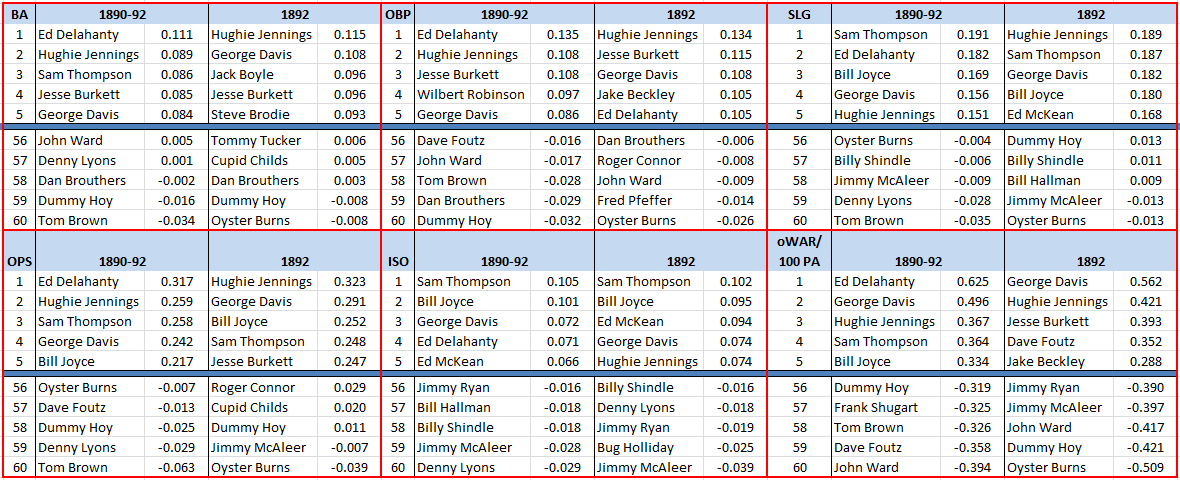
To give you an idea of the degree of improvement by the leading players, here are the top and bottom five of the 60 study players in improvement in each of these 6 metrics, comparing the 1893-95 period to 1890-92 and to 1892 alone.

  • Sam ThompsonEd Delahanty and Billy Hamilton led the offensive powerhouse Phillies who scored over 1000 runs (in a 130 game season) each year from 1893 to 1895. Alas, the Phillies didn’t have the same prowess on the mound and could finish no better than third.
    • Thompson recorded three qualified seasons with 1.25 RBI per game, two with the Phils and one for the 1888 Detroit Wolverines; no other player since 1876 has even one such campaign.
    • Delahanty recorded a .400/.500/.600 season in 1895, one of only four such qualified campaigns since 1876. 
    • Hamilton’s 198 runs scored in 1894 is the all-time record as are his four seasons with 100 or more steals. Hamilton twice posted triple figures in runs, walks and steals; Rickey Henderson, with three such seasons, is the only other player to do so even once.
  • Hughie Jennings was the star shortstop on the Orioles teams that claimed three successive pennants from 1894 to 1896. Among his talents was getting plunked, leading the league in HBP five straight seasons, including 3 times with more HBP than walks.
  • George Davis and Honus Wagner, both shortstops, share the record total of 16 seasons with 20 doubles and 20 stolen bases. Davis likely would have reached those marks a 17th time in 1903, but lost that season when ruled ineligible to play for “jumping” back to his old Giants team.
  • Bill Joyce was possibly the most feared slugger of this period, drawing 284 walks from 1894 to 1896 (second to Billy Hamilton) while leading the NL with 47 round-trippers, many of them tape measure jobs. Joyce, who sat out the 1893 season in a contract dispute, totaled 31 WAR from 1890 to 1898, the most in a career of fewer than 10 seasons.
  • Jesse Burkett‘s 240 hits in a 130 game season in 1896 was the record total until surpassed by Ty Cobb in 1911. No player in the modern era has matched Burkett’s 1.8 hits per game in a qualified season (or even in a season of just 50 PA).
  • Ed McKean was Mr. Consistency for the Spiders, recording 258 to 284 total bases, 45 to 50 walks and 118 to 125 OPS+ each season from 1893 to 1896. McKean, Jack Glasscock and Germany Smith are the only players with 1500 games at shortstop before the modern era.

So, that is our study group. But, how representative is it of the majors as a whole? Here is our oWAR measurement for the study group and for MLB for this period.
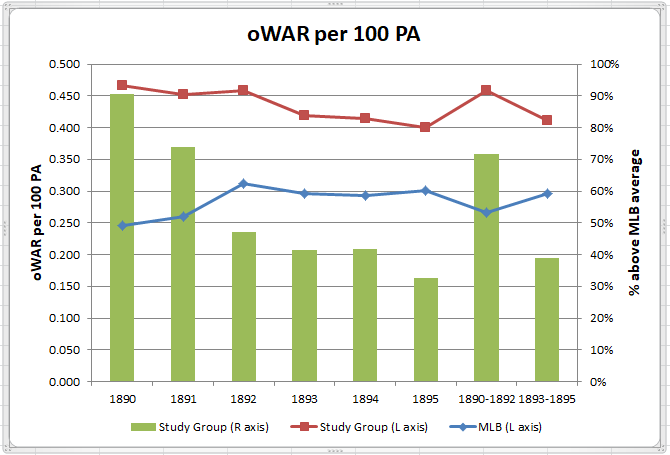
As expected, our study players who consistently commanded regular playing time performed well above the average major league player. As our study players aged (by 1895, more than one-third were aged 31 or older, and more than 20% were 35 and above), that gap narrowed from just above 70% better than the MLB average for 1890-92 to slightly below 40% better for 1893-95. Most of that narrowing, though, occurred not when the study players were oldest, but early in the study period, in 1891 and 1892. As noted above, those two seasons saw significant contraction in MLB teams, the effect of which is illustrated in the next chart.  
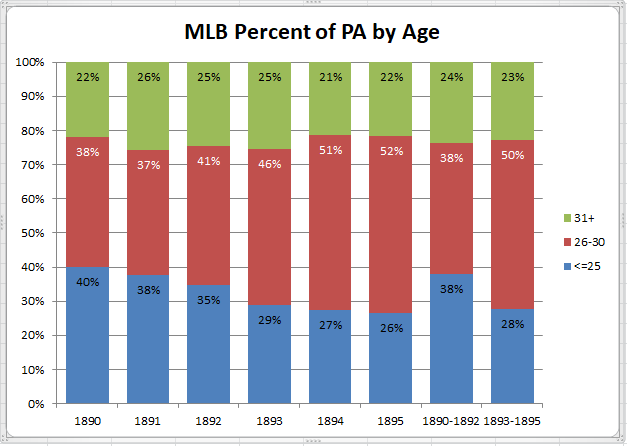
To fill those extra roster spots in 1890 and 1891, teams were turning to younger players, with those aged 25 or under actually  getting more playing time than the age 26-30 group that is normally the “sweet spot” for the highest level of player performance. By 1893-95, the playing time for the under-25’s had declined by one-third from 1890-91 levels, while the 26-30 group had increased by about the same amount. The next chart illustrates how that reallocation of playing time was reflected in performance.
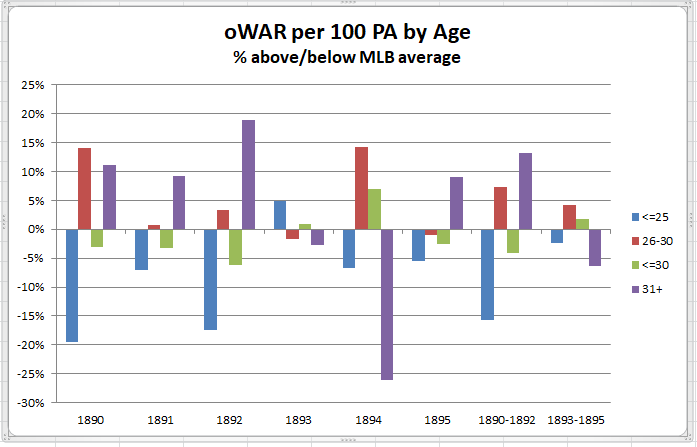
Note the large deviations in oWAR relative to the MLB average that are seen for 1890-92, with the under-25 group having the worst results and driving down the MLB average oWAR, paradoxically resulting in the age 31+ group performing above that average. With a more normal age distribution in 1893-95, the variance in oWAR between these age bands shrinks considerably (indicating a more uniform level of major league performance), with the age 31+ group now the weakest in performance as would normally be expected.

So, which hitters adapted best to the new pitching distance? The chart below of our study group players suggests that batters who were willing to go deep more often benefited their teams the most.
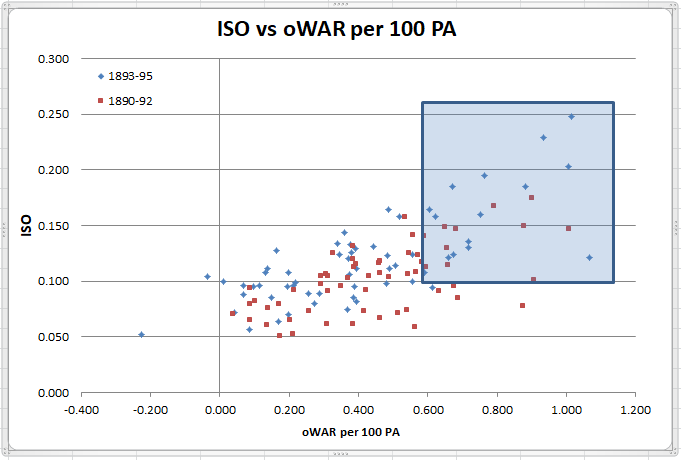
The top results of 0.6+ oWAR per 100 PA (about 3+ oWAR for a full season) mostly belong  to those recording at least 100 points of isolated power, There were 15 study players in this sweet spot for 1893-95 compared to just 10 for 1890-92. Note also that the top 6 ISO results for 1893-95 all surpass the leading result for 1890-92. Looking at ISO change from 1890-92 to 1893-95 shows this same relationship.

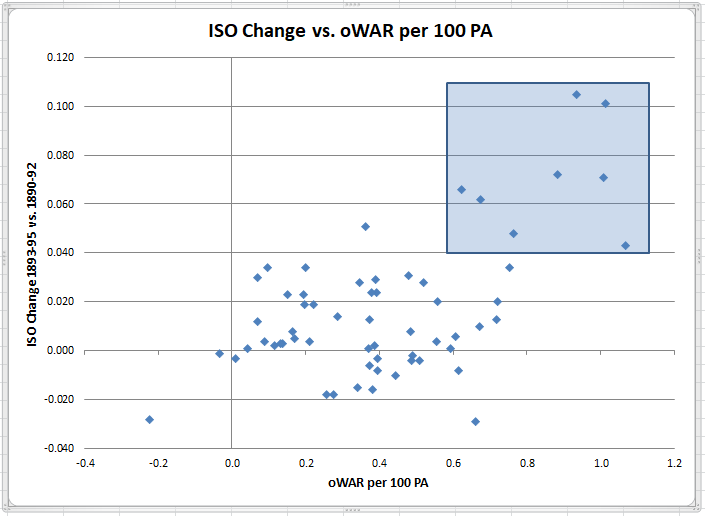
The above chart shows that increasing ISO, regardless of its starting point, generally results in more positive WAR, with the same 0.6 oWAR per 100 PA “sweet spot” corresponding to a 40 point ISO rise.

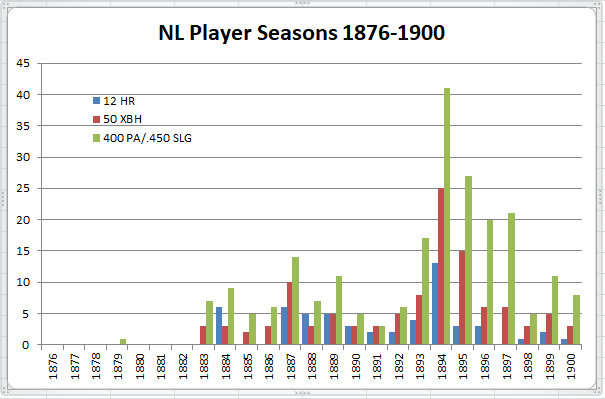
This increase in power was not seen only in our study group, as shown in the chart below of the number of MLB players in the 12 team NL with 200 or more total bases.
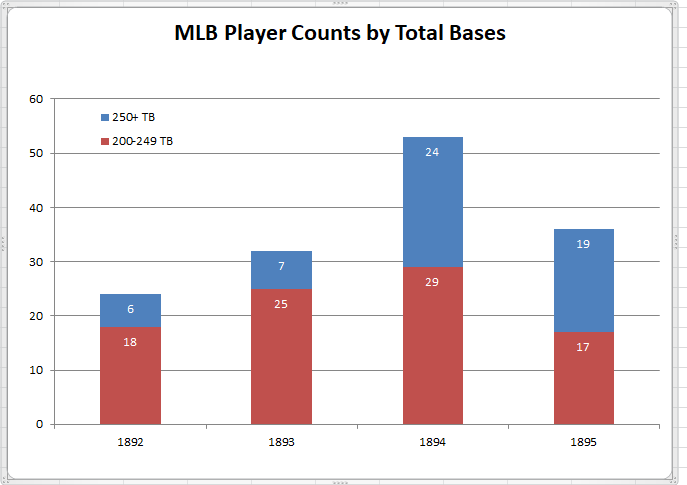
The increase in these seasons starting in 1893 would have been more pronounced had the 150 game schedule used in 1892 not been reduced to the 130 games used for the next five seasons (1893-97). Some other indicators of increased power hitting are shown in the chart below.

0 0 votes
Article Rating
Subscribe
Notify of
guest

41 Comments
Oldest
Newest Most Voted
Inline Feedbacks
View all comments
e pluribus munu
e pluribus munu
5 years ago

There’s an enormous amount to take in here, Doug. The rise in offensive statistics in 1893-95 is, of course, no surprise, but the drop in oWAR levels among leading regulars is, although age may account for some of it. I’m just beginning to sort through it. Thanks again for all the work and for continuing the discussion on the 19th century. One comment I think I can contribute concerns you ISO chart. While it makes sense that there would be a correlation between high ISO and oWAR, I’m not sure we can conclude that, “batters who were willing to go… Read more »

e pluribus munu
e pluribus munu
5 years ago
Reply to  Doug

Uff da! More data. It’s going to take a while to figure out how to work with all these themes. I’m especially interested in looking in more detail to see how different age cohorts and types of players at the 1892/93 border handled the changes.

One further comment in the interim: It may make more sense to work with OPS+, rather than oWAR, since oWAR (like dWAR, but unlike OPS+) embeds positional adjustments, which vary from year to year, usually just by a little, but with the abrupt changes involved here, perhaps by more than usual.

Mike L
Mike L
5 years ago

Great data. Wanted to put something out to the esteemed panel. There are considerable number of players who got a substantial boost. But there are also several who didn’t. I’m interested in that cohort. Are there commonalities between that group? Age, size, or anything else? The rising tide didn’t lift all boats. Why not?

Doug
Doug
5 years ago
Reply to  Mike L

Indeed. More than one quarter of the study group (16 players) saw their ISO decline in the latter period. Here are their totals for 1893-95. – Fourteen of those sixteen saw a rise in all three slash components, but all of them saw a bigger increase in their batting average than in their slugging percentage (obviously) – Only one of the sixteen showed an increase in oWAR/100 PA in the second period – Only four of the sixteen slugged .450 or better in the second period, and none slugged .500 – In sum, these guys were hitting more singles (9… Read more »

e pluribus munu
e pluribus munu
5 years ago
Reply to  Mike L

I’m working through the list of players to understand better whether performance changes were correlated with age, position, and so forth. That’ll take a while. But in the meantime I did want to note that in talking about the rise in ISO, we are speaking of a very ephemeral phenomenon, one that is really significant only for 1893-97 — which Doug did specify in talking about the R/G rise in his post: I’m not writing this to dispute his analysis. These are league ISO figures for the 12-team NL, 1892-99, with the % deviation from 1892 added: 1892 .082 —… Read more »

Mike L
Mike L
5 years ago

Thanks for the response and nice work. The whole thing could be noise, or it could be something that pitchers later learned to adapt to, erasing whatever short-term advantage hitters might have, or there could be other intervening factors later on. One thing that strikes me as possible is that the cohort that didn’t positively change because for some reason they were unable to physically to take advantage, or perhaps had a “small ball” style of hitting, or even were were disproportionately users of the flat bat. You’d love to see spray charts.

e pluribus munu
e pluribus munu
5 years ago
Reply to  Mike L

There’s no question that some players with lower oWAR in the later period were simply aging (like Dave Foutz, 35 in ’93, or Jack Glassock, who was 33, or Tom Brown, who was 32). But there are other things to think about. We take OPS as a far better indicator of a player’s contribution than Batting Average, but in the 1890s, BA was the leading standard, and hitters may not have seen themselves sacrificing anything by adding singles in larger numbers, while letting XBH fall where they may. I’d think Lave Cross would be an example of that (this would… Read more »

CursedClevelander
CursedClevelander
5 years ago
Reply to  Mike L

I’d have originally thought the lagging cohort would be all punch-and-judy types, singles hitting leadoff guys. And that’s certainly true of, say, Dummy Hoy. But it’s not quite true of a guy like Oyster Burns, who was more of a 19th century power hitter (good number of triples, actually led the NL in homers during the 1890 season when a lot of his competition for black ink was in the Player’s League). And I’ll never miss a chance to mention that Oyster Burns is the best player to ever play for the mighty Wilmington Quicksteps of the Union Association (2-16… Read more »

Mike L
Mike L
5 years ago

Altoona makes sense in that it was a railroad hub. Has a minor league team there now.

CursedClevelander
CursedClevelander
5 years ago
Reply to  Mike L

I mean, it’s not the smallest place to ever have a “major league” team – I believe that honor goes to mighty Keokuk, Iowa – but railroad hub or not, it’s a tough sell as a ‘big league’ town.

e pluribus munu
e pluribus munu
5 years ago

Actually, CC, if we’re going to include the National Association, the Rockford Forest Citys of 1871 (starring Cap Anson), played in an Illinois town with a population one-third smaller than Keokuk (11,000 vs. 17,000 in 1870). But Middletown, Connecticut seems to win the prize. When the Mansfields took the field in 1872, featuring future Hall of Famer Orator Jim O’Roarke, they were representing a “city” of under 7000.

CursedClevelander
CursedClevelander
5 years ago

I knew about Rockford, but didn’t realize they were that small back then, since they’re currently a much bigger city than Keokuk.

I suppose all these one horse towns having teams is one reason they decided not to count the NA as a “major” league, but the UA had the same issues, and at least the NA lasted five seasons.

e pluribus munu
e pluribus munu
5 years ago

Yeah. The UA clearly was not a Major League, in the sense we mean, and it shouldn’t have been classed that way in the Macmillan Encyclopedia, which I believe is the authority other sources follow. The problems with changing that now are that it did have some real major leaguers and it’s tough to change their lifetime stats now, and the quality of all the leagues was diluted in 1884, making the UA less amateurish inn context than it would otherwise seem. For example, is it fair simply to throw out Charlie Sweeney’s 24-7, 165 ERA+ pithing record and his… Read more »

e pluribus munu
e pluribus munu
5 years ago

I hadn’t mean to send off that last message without adding that the NA’s problems weren’t only ones of quality: if there was a major league in 1871-75, it was obviously the NA. I think the main issue was governance: wild as the game was in the later 1870s and the decade after, it was nothing like the NA, where fixed games and umpire intimidation made everything on the field suspect. The formation of the NL was about changing the business model and monitoring standards. (But in 1901, there were still enough problems that I believe this was one of… Read more »

e pluribus munu
e pluribus munu
5 years ago
Reply to  Mike L

Well, Altoona was indeed a railroad hub (learn something new every day — check!), but I’m not sure it makes sense. Its population was about 25,000, half the size of Wilmington (which, I think, does make sense, at least as much sense as Toledo, which was in the AA in 1884, or Troy, which was in the NL up till 1882). I doubt there was likely an idea that folks would take in a ballgame while switching trains. I’ve been trying to figure out Burns’s career, and why he wound up on Doug’s list. He had a bad year in… Read more »

e pluribus munu
e pluribus munu
5 years ago

In discussing Oyster Burns, who’s on Doug’s list because his 1893-95 ISO is lower than 1890-92, I should have addressed his ISO pattern specifically: …………….1890…….1891……1892…..1893……1894……1895 ISO………..180……….132……..138…….142……..146……..084 Obviously, the contrast is not between ’90-2 and ’93-5, it’s between 1890, the year Burns won the HR title with 13 in a three-league talent pool, and 1895, when he said his MLB goodbyes. The middle four years, two on each side of the rule change, are consistent when it comes to ISO, with a modest rise of about 10 points following the rule change. The top similarity score for Burns is another player… Read more »

Richard Chester
Richard Chester
5 years ago

Just a question here. With a pitching distance of 50 feet is it possible to have time to swing at a fastball or were the pitchers not pitching as fast as they do now?

CursedClevelander
CursedClevelander
5 years ago

Without radar guns, we really only have people’s recollections. You’ve got a link from one generation to the next, but there’s always a problem of guys looking back at their past with rose colored glasses. Player X batted against Walter Johnson as a wet-behind-the-ears teenage busher, then batted against Bob Feller as a grizzled vet, and swears Johnson was faster. Player Y has the same experience, but faced Feller as a rookie and Koufax as a vet. Player Z has the same, but now with Koufax and Ryan. That being said, there are players who swear Amos Rusie threw just… Read more »

Doug
Doug
5 years ago

No way Rusie was throwing in the 90s consistently AND averaging 500 innings a year (as he did from 1890 to 1894). Also, he threw a lot of pitches, leading 5 times in both strikeouts and walks, incl. both in the same season 4 times.

e pluribus munu
e pluribus munu
5 years ago
Reply to  Doug

I don’t know, Doug. Rusie was pitching 500 innings a year only when the pitcher’s box was in place. We really don’t know what sort of demand on the arm was involved with the shorter distance (an effective difference of about 5 feet). In ’93 and ’94 his IP fell to 482 and 444, and were in the 300s his last three seasons. While Rusie led the NL in Ks and BBs, his total rates per 9IP were actually much lower than was the case for Feller and Ryan when they were pitching well over 300 innings. For example, in… Read more »

Richard Chester
Richard Chester
5 years ago

I decided to run my own numbers. By observing photos of pitchers delivering a pitch it can be observed that the long stride they take indicates that the distance from the point of release of the ball from the pitcher’s hand to the plate is about 5 feet closer than from the rubber, giving a total distance of 55.5 feet to the plate. 30 mph = 44 fps so a 100 mph pitch travels at (100/30)*(44) = 147 fps. The reaction time is 55.5/147 = .378 seconds. Doug mentioned in a prior post that the distance prior to 1893 was… Read more »

e pluribus munu
e pluribus munu
5 years ago

Richard, prior to 1893, pitchers delivered from within a “box,” the front line of which was 50 feet from home. Their front foot could not cross that line. Moreover, their rear foot could not cross a line drawn 55.5′ from home. That 55’6″ is the equivalent of the pitching rubber being at 60’6″, and therefore the difference in distance between 1892 pitching and today’s was five feet, not the 10.5 feet you’re calculating. I was calculating from 60’6″ for contemporary 100 mph pitches, but your calculation of 0.378 seconds is surely more precise. For a 90 mph pitch in 1892,… Read more »

Richard Chester
Richard Chester
5 years ago

epm: Thanks for the update.

CursedClevelander
CursedClevelander
5 years ago

Those calculations can probably give us an upper bound on Rusie’s velocity – we know he was hard to hit, but not impossible, so he couldn’t have been throwing, say, 100 MPH. Of course, we’d have likely come to that conclusion anyway, but the reaction time numbers give us something like complete certainty. As to Doug’s point, I think looking at some of the figures epm gave, Rusie probably wasn’t throwing that many more pitches than Feller or Ryan. I doubt we’ll ever know his average velocity – what was he throwing on pitch 150? – but if Feller threw… Read more »

e pluribus munu
e pluribus munu
5 years ago

Doug’s posts on the 1892/93 transition are, I believe, in response to my hope that HHS would begin digging deeper into 19th century baseball, perhaps looking towards a new CoG wing on that basis. Few, if any, of us know much about the 19th century, and it’s hard to be interested without familiarity. One of the most exciting things I recall about baseball is buying the 1969 Macmillan Encyclopedia and discovering that the 19th century was there in rich detail – a whole world of baseball to explore that had been practically invisible to me before (although my Dad had… Read more »

Voomo Zanzibar
Voomo Zanzibar
5 years ago

Highest OBP with at least 50 SB, since 1901: .486 / 96 … Cobb .467 / 83 … Cobb .467 / 51 … Cobb .467 / 51 … Sisler .466 / 67 … Joe Morgan .464 / 52 … Speaker .456 / 65 … Cobb .456 / 61 … Cobb .452 / 58 … Collins .452 / 68 … Cobb .450 / 63 … Collins Cobb did that in 6 consecutive years. ______ Since 1893: .547 / 73 … John McGraw .521 / 100 . Billy Hamilton .490 / 97 … Billy Hamilton .486 / 96 … Cobb .480 /… Read more »

e pluribus munu
e pluribus munu
5 years ago

Mike L wondered what types of traits characterized the 16 hitters on Doug’s list of those whose ISO declined in 1893-95, over 1890-92. I’ve gone through the list to see what may have cause that decline in the face of a league power surge after the 1893 rules changes. I’m not sure there’s really any dominant pattern, but here’s a closer look at individual cases. Tom Brown (Position: O; WAR: 16.5; age in 1893: 32; first/last seasons, 100PA: 1882/1897) …….…1890….1891….1892….1893….1894….1895 OPS+…104…..146….…78….….77………80….…63 ISO.… .116… .148… .058..… .083…. .142… .086 Brown, a Liverpudlian, was a long-time itinerant outfielder, whose peak years were… Read more »

Mike L
Mike L
5 years ago

Spectacular work, EPM. Deserves a post all on its own.

Richard Chester
Richard Chester
5 years ago
Reply to  Mike L

Too bad so few people are reading them.

e pluribus munu
e pluribus munu
5 years ago

Well, you two are, and I appreciate the comments!

Paul E
Paul E
5 years ago

Yes, EPM, well done! Great descriptions and analysis. Thank you for the work
Years ago I read “The Beer and Whiskey League” about the AA. This is about all I’ve ever read specific to 19th century baseball. And, honestly, I can’t recall a darned thing from the book except Pete Browning being characterized as a heavy drinker. Visually, all we have of the era are colorized photos and we are at the mercy of anecdotal stories told by hometown sportswriters.
I did enjoy, “The Glory of Their Times” with the old guys telling their stories

Richard Chester
Richard Chester
5 years ago

epm: Just to clarify, I do not mean to imply there are too few current readers and commenters on this site who are not reading your comments. I am alluding to the fact that there are too few people overall who access the HHS web site. I logon to Twitter regularly, following mostly baseball fans, and your and Doug’s comments and articles are superior to their comments (except Andy’s, of course).

CursedClevelander
CursedClevelander
5 years ago

Bug Holliday, if he’s remembered at all, is likely remembered for debuting in the postseason. He was only 18, and IIRC Cap Anson basically picked him off the sandlots to fill in for an injured player.

Four years later he re-debuted with the Reds and had a nice little career.

Lave Cross played for three teams called the Philadelphia Athletics in three different leagues. He played for a 4th Philly team in yet another league. I believe he may be the only player that can claim that.

Richard Chester
Richard Chester
5 years ago

Since 1901 Lave Cross holds the record for most RBI with 0 HR. In 1902 he had 108 RBI and 0 HR.

Paul E
Paul E
5 years ago

At retirement in 1907, Cross was 5th all-time in career hits. I imagine if there was a Hall of Fame in 1920, he might have made it?

e pluribus munu
e pluribus munu
5 years ago
Reply to  Doug

Many thanks, Doug. With your new post, it’s time to move back to the present, but I hope there may be more chances over the coming months to revisit the 1890s. I was thinking, for example, of posting a comment about the old Baltimore Orioles, and the enormous impact that distinctive and innovative team had on 20th century MLB history. It’s the source of a managerial lineage that moves through McGraw to Stengel to Martin, and the style of play — restrained by rules to curb its rowdiness — did much to shape the following two decades. And the Orioles… Read more »

e pluribus munu
e pluribus munu
5 years ago
Reply to  Doug

I’ll work on something about the Orioles that can be a change of pace after the first phase of the new season, and some follow-up ideas if there seems to be interest.

trackback

[…] mound gave birth to the enhanced roles of key features of modern baseball: relief pitching and slugging. Having spent some time learning more about those years, I now see the impact of the 1893 pitching […]