Sixty feet six inches and the birth of relief pitching

This season marks 125 years since pitchers first launched their offerings from the current distance of 60½ feet from home plate. That’s 10½ feet or more than 20% further than before the 1893 season, a massive change that launched the 1890s “ultra-live ball” era but also introduced the more lasting change of pitchers who were used fairly frequently in relief roles. More after the jump. This new breed of pitcher was not a relief specialist by any means, but it was a recognizable start to regular employment of some starting pitchers in relief roles. Even after the lively ball of the 1890s and early 1900s gave way to the following dead ball era, use of relievers continued to expand as complete games began their inexorable descent to today’s miniscule levels. But, before we get into that, here are some of the immediate effects resulting from the increased pitching distance.

  • Scoring increased from 1892 to 1893 by 1.47 runs to 6.57 per team game, then increased a further 0.81 runs in 1894. The five seasons from 1893 to 1897 remain the five highest scoring seasons in the 125 years since 1893.
  • Batting average in 1893 increased by 35 points from the year before, from .245 to .280, and then jumped a further 29 points in 1894 when the league slugged at .435, the second highest rate of the past 125 seasons (though only the 51st highest ISO season, with 2017 topping that list)
  • Home runs jumped 26% from 1892 to 1893, and a further 34% from 1893 to 1894.
  • League WHIP increased by .246 from 1892 to 1893, and jumped again by .122 in 1894. The four seasons from 1893 to 1896 remain the four highest WHIP seasons of the past 125 years.
  • Strikeouts fell by more than one-third from 1892 to 1893, dropping from 3.24 per team game to just 2.13. Walks jumped 16.7% to almost 4 per team game.
  • Perhaps surprisingly, stolen bases held steady from 1892 to 1893, but that level (1.75 per team game) was already down sharply from 1887-90 when better than two stolen bases were recorded per team game. Nonetheless, the 1893 to 1897 seasons remain the five highest in stolen bases of the past 125 years.

I think you get the idea. An already high scoring environment (by modern era standards) became hotter still, reaching levels not seen since. Pitchers struggled to adjust to the new pitching distance and batters took advantage.

So, who were the unfortunate moundsmen thrust into the role of lab rat as baseball undertook this radical experiment? These are the 31 pitchers who recorded a qualified season in both 1892 and 1893.

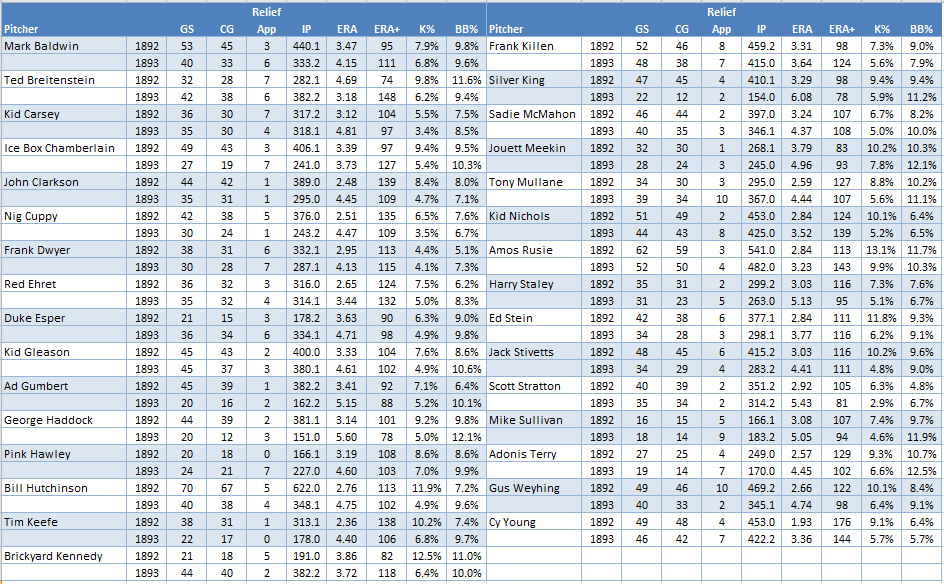
  • Of these 31 pitchers, only two (Breitenstein and Kennedy) posted a better ERA in 1893, despite 13 of the 31 recording a better ERA+
  • All 31 pitchers recorded a lower strikeout rate in 1893 than in 1892, and 20 of 31 recorded a higher walk rate
  • 23 of the 31 pitchers saw their percentage of starts completed fall from 1892 to 1893, while 20 of 31 made more relief appearances in the latter season
  • 24 of 31 pitchers saw their innings totals drop from 1892 to 1893, and 21 of 31 recorded a drop in IP per game

Most of these pitchers ultimately adapted to the new pitching distance, with over half (16) recording 1000+ IP from 1893 and only two of those (Karsey, Weyhing) with an ERA+ below 100. Those who struggled to adapt included:

  • Kid Gleason actually had a slightly better ERA+ from 1893 than before, but nonetheless switched to second base in 1895.
  • HOFer Tim Keefe was released before the end of the 1893 season due to ineffectiveness, but was likely close to the end of his career anyway. Ditto for Tony Mullane, who stuck around for one more forgettable season (155 IP, 6.59 ERA) in 1894, though he continued pitching in the minors until 1902 at age 43.
  • George Haddock had recorded 34-11 and 29-13 seasons in 1891 and 1892, but could manage only a 77 ERA+ in 1893-94 at age 26-27 and never pitched professionally again (maybe hitters were no longer intimidated by the cross-eyed stare on display in his B-R page picture).
  • Silver King won 30+ games for four straight seasons (1887-90) with 147 ERA+ pitching in the AA and Players League, but was less effective in the NL the next two seasons, a trend which worsened from 1893 with only a 90 ERA+ in 453 IP to the end of his career.
  • Scott Stratton saw his pre-1893 ERA+ of 112 slide to 79 in 516 IP to close out his career. Gus Weyhing had a similar ERA+ drop, from 118 to 86, in 1000+ IP on both sides of the 1893 demarcation.
  • Don’t know if it had anything to do with the new pitching distance, but Pink Hawley hit 20+ batters for a record eight straight years starting in 1893, with the aforementioned Gus Weyhing in second with six seasons (but four of those were before 1893); Weyhing and Hawley rank 1st and 3rd in career HBP, bracketing Chick Fraser, a rookie teammate of Weyhing’s on the 1896 Colonels.

The above results are reflected in a decline in complete game percentage from 1892 to 1893, from 88% to 82%, as shown below. At the same time, reliever usage, which was already on the rise, increased over 35%, from a pre-1893 high of 0.150 per team game in 1891 to 0.207 in 1894 and 1895.

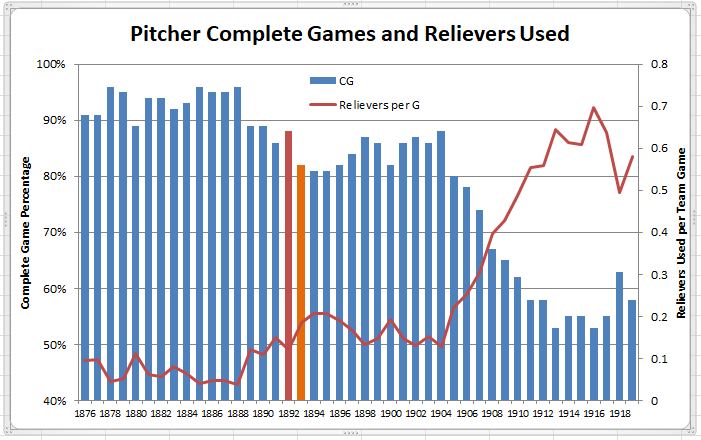
What piqued my interest, though, was how those extra relief appearances were doled out. The list below shows the pitchers each year with a qualified season that included at least 25% of appearances in relief.

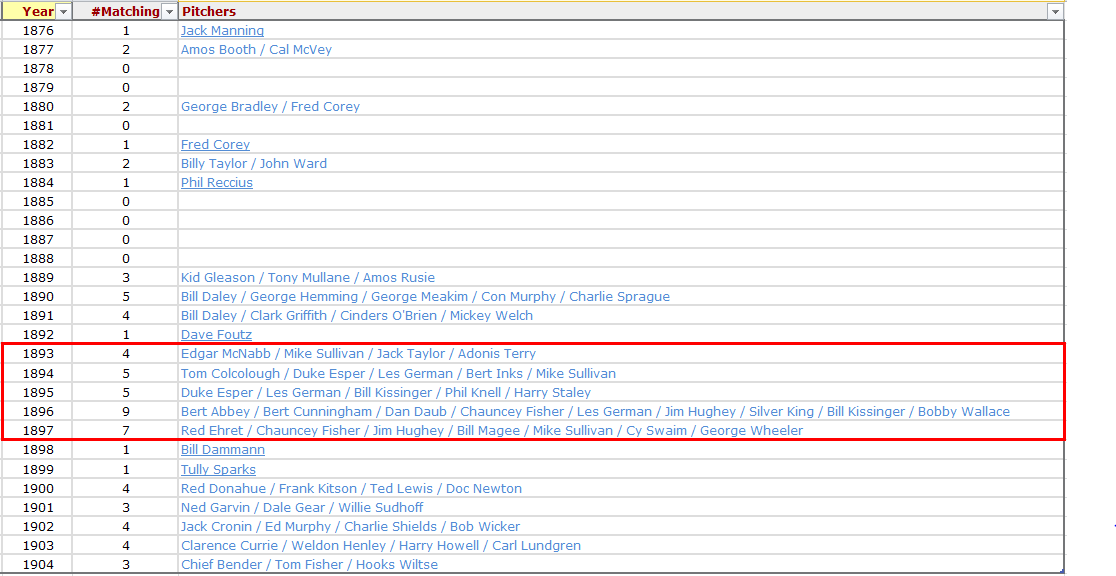
As is evident from the above list, there were virtually no such pitchers before the 1889 season when runs per game jumped by over a run from 1888 levels. However, by the time the Players League and American Association had folded, there was again just one such pitcher in the 1892 NL, similar to the experience before 1889. But, look what happened over the next five years (highlighted) in a 12 team league, with record numbers of such pitchers each year, albeit still at levels below one such pitcher per team.

When runs per game started to moderate in 1898, complete game percentage edged up again and the numbers of these 25% relief pitchers declined. But only briefly; when the season extended to 154 games in 1905, there were 11 such pitchers, climbing to 29 in 1908, 41 in 1913, and 50 in 1916, the last representing more than three such pitchers per team.

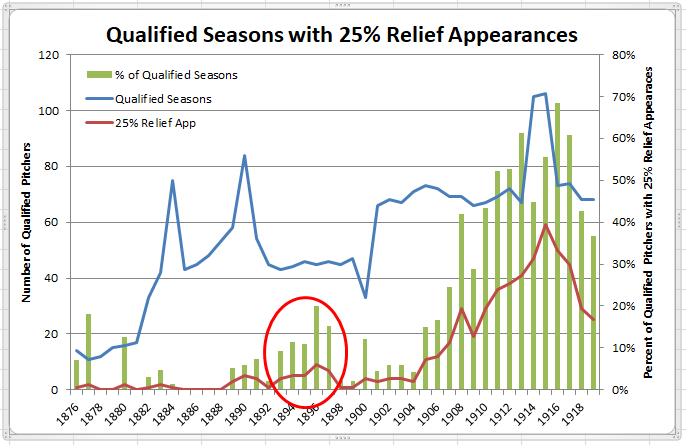
Here are those results graphically, with the 1893-97 period circled. The green bars in this period represent 10%-20% of all qualified pitching seasons having 25% or more of appearances in relief, the first sustained period of pitchers having that level of relief responsibility.

You might be wondering whether there were any relief pitchers who were not just starters picking up their teammates. The answer is not really. Bumping up the relief role to 40% of appearances and dropping the workload threshold to 100 IP yields 1908 as the first season with a sizable number, with 16 that year (an average of one per team), compared to the previous MLB high of only four.

The exclusive reliever on a roster really didn’t exist at all; of the 851 seasons from 1876 to 1919 with zero starts, over 97% were of fewer the 20 IP, with a high prior to 1893 of only 23.1 IP, a mark that would stand until 1908. Bumping that up to a 5 start maximum and 50+ IP yields only 126 seasons over that period, just 36 of which came before 1908.

The other aspect of pitcher usage that changed significantly in the 1893-97 period was in the innings workload by the workhorses, those pitchers with seasons of 300+ IP. As shown below, prior to 1893, the smallest percentage of total innings pitched by these workhorses was just below 50%, in 1890 and 1891.
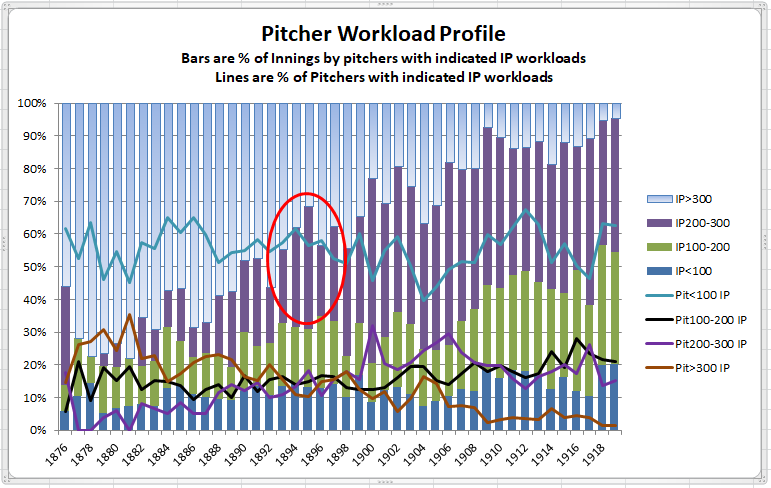
Those workhorse pitchers were under that previous minimum each season from 1893 to 1897 (circled) and not by a little, with all of those seasons below 45% and three below 40%. That trend would escalate rapidly, with workhorse workload dropping below 25% in 1900, and below 10% in 1909.

0 0 votes
Article Rating
Subscribe
Notify of
guest

60 Comments
Oldest
Newest Most Voted
Inline Feedbacks
View all comments
e pluribus munu
e pluribus munu
6 years ago

As I may have hinted, I hope that HHS contributors will be interested in using this site to help strengthen our understanding of and interest in 19th century base-ball, particularly for the period 1893-1900, when the game had taken almost all important aspects of its modern form (excepting the foul strike), but was hampered by the absence of what we tend to see as the appropriate league structure, and by the fact that year numbers begin with 18–, which seems quaint. In opening up discussion on 19th century ball, Doug has surprised me by his choice of topic — I… Read more »

e pluribus munu
e pluribus munu
6 years ago

Uh oh: “the “%” markers need to come off the legend items on the right” . . . what does that mean? It means I forgot to specify I was referring to the final chart,

e pluribus munu
e pluribus munu
6 years ago
Reply to  Doug

Thanks for the changes, Doug. I’ve often thought the answer on 1894 could be as you say, but I see no reason why batters, who certainly adapted quickly in 1893, would continue to improve their adaptation while pitchers remained unable to adjust, until suddenly the dynamic reversed a year later. It makes sense only if you consider one side of the equation and not the other. So I’m hoping there is some data point about 1894 that I simply have never discovered — a temporary change in the ball; some odd field ground rules; whatever . . . One thing… Read more »

mosc
mosc
6 years ago

While I don’t share the drive to research 1800s players, I do share your general sentiment that the originality of analysis on here is much more relevant in a historical perspective. The best work here, like this piece by Doug, covers historical contexts and changes in baseball over time. Future player projection and comparative analysis of guys vying for MLB active rosters is sexier, and sometimes even funded (ha!), but in some significant ways it relies on deeper dives into historical context like this one. Doug, I read every word. I process it. Your work not only helps me understand… Read more »

CursedClevelander
CursedClevelander
6 years ago

Breitenstein is an interesting guy. I think I glossed over him once when talking about Nap Rucker – Rucker might be the best pitcher ever with exactly a .500 career record, and Breitenstein has a good argument for best with an under .500 record. (The other two are Jack Powell and Bobo Newsom – or Bob Friend, if you prefer someone a bit more modern) He’s probably most well-known nowadays for throwing two no-hitters, including one in his first career start. He had pitched five games in relief, so he doesn’t quite match Bumpus Jones or Bobo Holloman. His no-no… Read more »

e pluribus munu
e pluribus munu
6 years ago

CC, Breitenstein’s 1893 season is like an exaggerated Dick Farrell 1962 or Ned Garver 1950 — 11.3 WAR with a losing record! A spectacular season. I’d go with the Hoosier Thunderbolt over Breitenstein for the balance of the era, but that’s no knock on Breitenstein. (Freedman did more than knock Rusie out of the 1896 season; his demand to cut Rusie’s salary effectively ended Rusie’s career at the age of 27.) It would be interesting to pursue your idea of finding the supreme losing pitcher of all time. You might add Murray Dickson to your list, especially since the War… Read more »

Doug
Doug
6 years ago

Breitenstein’s 1893 season ranks second in WAR in a losing season, trailing only the 18.0 WAR put up by Jim Devlin in 1876. Devlin recorded a 30-35 record with a 1.56 ERA (168 ERA+) in 622 IP for the Louisville Grays (who finished the season at 30-36). The Grays’ defense looks a little suspect as Devlin allowed 201 unearned runs to go with the 108 of the earned variety that he gave up. The top such seasons of the live ball era belong to Jon Matlack (9.1 WAR, 13-15) for the ’74 Mets and Phil Niekro (8.9, 16-20) for the… Read more »

e pluribus munu
e pluribus munu
6 years ago
Reply to  Doug

Doug, It wasn’t the Louisville defense alone that was suspect. Devlin and others were throwing games. They were, in turn, thrown out of baseball, and the club was disbanded.

What a surprise to see Matlack’s name on this list. Nothing in that ’74 season suggests a stratospheric WAR. It looks to me as though he’s getting enormous credit for the team’s terrible defense.

Doug
Doug
6 years ago

I suspect, beyond poor Mets defense, the biggest contributor to Matlack’s big WAR was the estimation of what an average pitcher would have given up in the same innings against the same teams. In Matlack’s case, it was 4.72 RA/9 compared to the to 2.78 that he actually gave up, a huge difference of almost two runs. His next largest gap was 1.1 runs in 1978 when he garnered his second highest WAR total of 6.4.

e pluribus munu
e pluribus munu
6 years ago
Reply to  Doug

You’re right, Doug. That does seem to be the case. It’s hard for me to see the basis of the extremity of that calculation: it’s basically a strength-of-schedule issue, and I don’t see Matlack up against a exceptionally unbalanced set of opponents. It’s true he didn’t get to pitch against his own, weak offensive team, and he faced above-average run-producing teams a bit more than normal on top of that. But the two big outlier run producing teams were LA (+0.78) and Cincinnati (+0.61), and he only started against the three times each (out of 34 starts), while he started… Read more »

Doug
Doug
6 years ago

I did a very crude estimation, calculating game-by-game Matlack’s runs allowed above or below what his opponents scored that season, weighted by his innings pitched. The result was 1.46 runs better which. when added to the Mets’ 0.38 run defensive deficit, gets Matlack to 1.84, not far from the 1.94 runs better that B-R credits him with. Matlack also did have a slightly tougher than usual schedule, with a 4.23 avg R/G of his opponents compared to league avg of 4.15, or 4.21 excl. the Mets. He faced the top three offensive teams (Dodgers, Reds, Pirates) 11 times in 34… Read more »

e pluribus munu
e pluribus munu
6 years ago
Reply to  Doug

Perhaps the 0.10 divergence between your results and B-R was just park factors, Doug. I’m sure you have it right: I too estimated a slightly tougher than expected schedule for Matlack. The fact that this adds up to 9.1 WAR still seems very strange to me. I guess I’ll look for the time to go through his season game-by-game, looking at the contexts for his pitching. If I can get the 9.1 figure to make sense to me — I mean after-the-fact intuitive sense, rather than just an understanding of how the calculation was done — then perhaps I’ll be… Read more »

Richard Chester
Richard Chester
6 years ago

I ran the PI for pitchers from 1871 to date with 100+ GS, W-L% equal to or less than .500 and sorted by ERA+. Here are the pitchers with ERA+ equal to 114 or higher. ERA+ W-L% GS Player 150 ….. 0.486 ….. 153 ….. Jim Devlin 124 ….. 0.374 ….. 158 ….. Ned Garvin (not to be confused with Ned Garver) 122 ….. 0.496 ….. 132 ….. Johnny Rigney 121 ….. 0.484 ….. 226 ….. Jim Scott 119 ….. 0.485 ….. 272 ….. Thornton Lee 119 ….. 0.500 ….. 274 ….. Nap Rucker 118 ….. 0.456 ….. 101 …..… Read more »

Richard Chester
Richard Chester
6 years ago

I think it should be noted that several of those pitchers were active pre-1901, in the days of no gloves or tiny gloves, and official scorers’ decisions of error or hit were questionable.

Doug
Doug
6 years ago

You mean official scorers’ decisions aren’t questionable any longer? To me, scorers have become much more lenient in the past 20 years, giving the fielder the benefit of the doubt on hard hit balls and awarding hits where errors would have been more likely 30 or 40 years. Strictly a perception thing, but it’s sure seemed that way to me.

Richard Chester
Richard Chester
6 years ago
Reply to  Doug

I am not saying that official scorers’ are no longer questionable, just that it was more difficult to make judgments prior to 1900. Concerning your comment below about muddy fields, I remember reading in the Charlton Chronology that there were games played with actual puddles on the playing field, usually in the outfield.

Doug
Doug
6 years ago

I was being half facetious there, Richard. But, I do think scorers have become kinder to hitters and defenders (and tougher on pitchers) in recent years.

Puddles in the outfield would definitely help fielders keep the ball in front of them; cuts down on those annoying gappers that turn into triples and IPHRs.

Your many references to the Charlton Chronology have convinced me to buy a copy. They’re available on Amazon (probably various versions), mostly used, but a few new ones starting from $21 incl. shipping.

e pluribus munu
e pluribus munu
6 years ago

It may be sign of second childhood, but I’ve followed up on my interest in the counter-intuitive rise of hitting in 1894, a year after we might expect hitters to have their peak advantage over pitchers, in the immediate wake of the pitching distance. Using Retrosheet line/game scores, I’ve calculated the R/G (both teams) for each month from September 1893 through June of 1895 (and also for early 1893). The results do seem to show something a odd: 1893 Apr. 11.6 (only 4 dates/16 games) May 13.3 (Apr./May average: 13.2) ….. Sept. 12.5 ….. 1894 Apr. 12.3 (11 dates/50 games)… Read more »

Mike L
Mike L
6 years ago

I realize this is an insane shot in the dark, but I wonder if the Panic of 1893 (which went on for some time) impacted rosters. And, one more thing that might have been mentioned above. In February of 1895, the league reduced the size of gloves and permitted the dirtying of balls.

e pluribus munu
e pluribus munu
6 years ago
Reply to  Mike L

Mike, That fact about the rule changes of 1895 is interesting, though the timing may not quite solve this problem. Where did you find it? I use the Baseball Almanac to track rule changes and it doesn’t mention those.

As for the Panic of 1893, I think you’re exactly right: it’s an insane shot in the dark. If someone ever casts light on this mystery we’ll be able to take a look and see if you hit anything.

Mike L
Mike L
6 years ago

I excel in insane shots in the dark. Y’all who have been patient with me over the last several years know that. I thought the Panic, given how serious it was, might have caused teams to be folded or stripped down, with perhaps players not being paid because owners were strapped and attendance would be down. There could have been a bleed-off with the one year creation of the Union Association as well. The rule came from doing a down and dirty on team liquidations in 1893/4/5 where I came across a reference to Cap Anson pushing for a rule… Read more »

e pluribus munu
e pluribus munu
6 years ago
Reply to  Mike L

Mike, I don’t think there was any effect on rosters. Richter’s history of baseball (1914) begins its account of the 1894 season by saying, “The season was uneventful, but marked the gradual return of prosperity with peace” (just what we keep hoping for nowadays!). Francis Richter was an observer throughout the late 19th century, and I’d expect him to have noted extreme financial pressures, which he did in his accounts of league struggles and baseball wars. The UA was actually a decade earlier: it was the 1890 Players League that had most recently disrupted things, but the major hit was… Read more »

Mike L
Mike L
6 years ago

I think Richter is wrong on the history of the Panic of 1893–it wasn’t over in 1894, when unemployment peaked. Then the Pullman Strike in mid 1894, over reduced wages but same rents in company towns, and a Wall Street-aided bailout of the government in Feb 1895. Here’s an interesting link: https://www.jpmorgan.com/country/US/en/jpmorgan/about/history/month/feb

e pluribus munu
e pluribus munu
6 years ago
Reply to  Mike L

Mike, Richter has nothing to say about the Panic, and, of course, you’re correct that the effects were still being felt in 1894 and beyond, just like the 2008 recession’s impact lasted multiple years. Richter’s just talking about the National League, and since his accounts of baseball history do include economic impacts on the game, I think what we can conclude from his comments is that he observed none that he felt merited mention from the Panic in 1894 (he also does not mention the Panic in his brief account of the 1893 season). I suspect that histories of baseball… Read more »

Mike L
Mike L
6 years ago

EPM, here’s a link to a site that talks about 19th Century equipment. I don’t have a way of judging its credibility:
http://www.19cbaseball.com/equipment.html

e pluribus munu
e pluribus munu
6 years ago
Reply to  Mike L

Nice article. Notice that the 1893 rule changes eliminated the flattened bat preferred by hitters, perhaps to balance somewhat the effects of the pitching change.

Doug
Doug
6 years ago

That rule changing to a rounded bat might also explain why 1894 was more favorable to hitters than 1893. By the latter year, batters would have more fully adjusted to their new lumber and its effects on their swings.

e pluribus munu
e pluribus munu
6 years ago
Reply to  Doug

Perhaps. But, as with the “learning curve” explanation vis a vis pitching, why did they all figure out how to handle their new 1893 bats together at the end of May 1894? (And why did that sudden burst of learning subside a year later? The “learning curve” model doesn’t really work on the pitchers’ end — how do you reverse the effects of batters mastering use of the rounded bat?) Fully round bats were not actually novelties; the flat-sided bat was only allowed 1885-1892 — all 1893 players would presumably have learned to play the game with fully rounded bats,… Read more »

Mike L
Mike L
6 years ago

All this business about flattened bats leaves us with a bit of a sticky wicket in figuring things out, ay?

Doug
Doug
6 years ago
Reply to  Mike L

I think Bells’ comment below is worth noting. We may be searching for a specific reason for something that happened as a result of many factors, not least among them chance.

e pluribus munu
e pluribus munu
6 years ago
Reply to  Doug

Just a small note, Doug: “chance” is not a reason: it’s just a term. “Chance” means we are unable to determine the reason or reasons, so we use the term to stand in for it/them.

Doug
Doug
6 years ago
Reply to  Mike L

Roster sizes did appear to shrink in 1893-94. These are the number of players, league-wide, with fewer than 200 PA, excl. pitchers. 1892 – 64 1893 – 57 1894 – 53 1895 – 82 1896 – 67 1897 – 62 1898 – 94 1899 – 86 But, didn’t see the same kind of result for pitchers. For example, number of pitchers with fewer than 30 IP. 1892 – 36 1893 – 31 1894 – 49 1895 – 33 1896 – 36 1897 – 25 1898 – 36 1899 – 37 Unless the high number of such pitchers in 1894 was… Read more »

e pluribus munu
e pluribus munu
6 years ago
Reply to  Doug

The 1894 roster figures are interesting, Doug, especially on the pitcher side. I’m going to explore this further — it seems likely that the roster and scoring issues are related.

Doug
Doug
6 years ago

This might be an explanation. 11 of those 49 pitchers in 1894 were primarily position players that year, which would make sense in a season with offenses running wild and likely lots of blowouts.

Don’t know if there was similar usage of position players in the other seasons.

Doug
Doug
6 years ago

Great work, Mike. Very odd, indeed.

One thing to consider is field condition. Muddy fields in the early season was a persistent problem (one reason for so few games in April) and this could have continued well into May given the poor drainage in place for most if not all fields. Wet fields would slow done balls and runners and take quite a bite out of the offense in a game dominated by small-ball tactics. This supposition, if correct, would also account for offense slowing down in September.

e pluribus munu
e pluribus munu
6 years ago
Reply to  Doug

The field condition hypothesis should apply to seasons generally, and so it seems to run into problems in June 1895. I’ll take a look at the summer pattern for ’93 and ’95 after I catch up on the snacking I missed, but given the season stats available on B-R, there doesn’t seem any reason to expect a 25-30% summer scoring bump in those years.

e pluribus munu
e pluribus munu
6 years ago

In 1893, the April/May R/G rate was 13.2; the June/July rate was 13.9. If dry fields was the cause of the rise in ’93, it was on the order of 5%, not 25%+.

CursedClevelander
CursedClevelander
6 years ago

I imagine the contraction from 3 major leagues in 1890 to just one in 1892 had some effect as well – we know expansion causes odd statistical quirks, and contraction is no different. The only problem is that we would have expected to see that effect in 1892, not 1894. Also, the separation between major and minor leagues wasn’t quite as stark in the 19th century as it is now. And since the Players League took a lot of top shelf talent, a lot of the “major league” guys in the 1890 NL and AA really weren’t – they were… Read more »

bells
bells
6 years ago

I’ve got a few guesses: 1. Statistical noise. I don’t think it’s implausible that this is just fluctuation due to whatever factors. A month of games in a… 12(?) team league isn’t that much, and things do fluctuate just because of this and that – weather, player injuries, randomness. So month-to-month, or even quarter-to-quarter, these trends aren’t impossible to attribute to simply noise. 2. Pitcher fatigue. Pitchers were workhorses back then, and sports conditioning was certainly not a thing. Although Doug’s wonderful graphs don’t go so far as to show average IP for starters in these years, the three main… Read more »

Doug
Doug
6 years ago
Reply to  bells

“I think it’d be interesting to see which hitters might have had an increase in fortune pre-to-post 1893 – I wonder if that would give any clues as to what hitting strategies were successful in the new setup.”

I’m looking at that right now for a future post. Limited data is, alas, a significant constraint, but if I miss something in the analysis, I’m guessing our astute readers may pick up on it.

Incidentally, that limited data is why I couldn’t show you IP in relief vs. IP starting for this post.

e pluribus munu
e pluribus munu
6 years ago
Reply to  bells

A very thoughtful reply, bells. I particularly appreciate the detail of your thought experiment in the final paragraph, which really does address the issue of timing in various ways. However, of course, I’m going to push back on your ideas, which I’ll take in turn. 1. It is naturally possible that any phenomenon is the result of a confluence of so many factors that none can be seen as determinative, and we substitute “chance” for an explanation. When we’re looking at statistics (to the degree I understand them), that’s pretty much what “noise” is about, and it’s equally true that… Read more »

e pluribus munu
e pluribus munu
6 years ago

I want to follow up my earlier reply to bells, which ended by saying, “Bot that I have anything better to offer . . .,” since my fingers couldn’t tell ‘b’ from ‘n’ on the keypad, by offering an idea that I think does have the form of a satisfactory explanation for the 1893-95 hitting pattern, but which is entirely imaginary: no information supports it and I’m not asserting that it is true, only using it as an illustration of the sort of explanation that would fit the facts. (1) Imagine that in the 1893-94 off-season the NL contracted its… Read more »

Paul E
Paul E
6 years ago

Epm,
ML switched balls in 1977 (Spalding to Rawlings). In the NL, scoring increased only 0.42 R/G and it was noticeable and drew much commenting……AL had another variable-expansion- so I guess we would throw AL data aside.
Obviously, 1920 is another example but certainly not as drastic as 1892-1894

e pluribus munu
e pluribus munu
6 years ago
Reply to  Paul E

Paul, I don’t really want to press my idea as a respectable hypothesis, because I have zilch to back it up — it’s just a model of how a hypothesis could fit the scoring data — but I noted on an earlier string that according to non-MLB testing reported on the website FiveThirtyEight.com, the baseballs used in last year’s season-long homer-fest were also, almost certainly without intent, juiced, despite meeting all the specs that MLB imposes on ball manufacture. I think this was in the back of my mind when the idea popped into my head to imagine a one-year… Read more »

Paul E
Paul E
6 years ago

not too related to anything in particular, Al Reach, inventor of the cork-centered baseball, sold his sporting goods company to Albert Spalding in 1889. But, if we’re gonna go red herrings:
1) Vitamin D shortage due to extremely overcast weather in damp spring initially weakened batters
2) Gamblers, in an effort to divert attention from overtly poor fielding by bribed fielders, begin bribing pitchers exclusively

e pluribus munu
e pluribus munu
6 years ago
Reply to  Paul E

Paul, I think that with a little refinement your hypotheses will be at least as good as mine — and you have two to my lonely singleton!

Paul E
Paul E
6 years ago

of anything that’s been postulated, proposed, suggested, or even joked, bells’ “pitcher fatigue” makes the most sense to me. I’m also digging “statistical noise” as acceptable and good enough to put this puppy to rest.

bells
bells
6 years ago

Thanks for the thoughtful reply as well, epm. One of the reasons I don’t participate in too many discussions here is because I simply don’t have time to come here and participate all the time, so I hope you’ll forgive the belated reply. Indeed it’s more than likely that we won’t be able to grab onto anything definitive through discussion, so I’m under no illusion as to the investigative reach of any points I’m making, but it’s an interesting thought experiment nonetheless. Just to reply in kind: 1. Your understanding of noise in statistics is similar to mine, but with… Read more »

e pluribus munu
e pluribus munu
6 years ago
Reply to  bells

bells, Not everyone is retired and has the option to prattle endlessly online the way I do. Your posts are always thoughtful, and there’s nothing belated about your reply – I’m grateful you thought it worthwhile to write another detailed response to my arguments. On your point #1, we really do see eye to eye on the issue of statistical noise, and, as you note, where we differ is on the likelihood that the 1893-95 runs scored pattern provides a data set robust enough to suggest that noise is an unlikely solution. In your comment, you point to the skimpiness… Read more »

bells
bells
6 years ago

Well, if I were retired, I could think of worse ways to spend my time than immersing myself in baseball stats and positing ideas about some stories behind them. I can only dream. Your points are well taken, and I’m not so attached to the ideas I put forward that I’d choose them as my hill to die on, so I’ll just say that I appreciate the thoughtful back-and-forth, and want to put forward a couple of small clarifications. First, I didn’t mean to bring up hitting consecutive baskets or dWAR as anything more than analagous fluctuations that it’d be… Read more »

e pluribus munu
e pluribus munu
6 years ago
Reply to  bells

To show how close we are, bells, I grew up in a home where ‘to-mah-to’ was correct, along with a number of other hifalutin forms meant to signal that we’d left the old country behind. Among them all, ‘to-mah-to’ is the only one that as an adult I consciously abandoned, though it took a lot of practice ignoring the parental corrections echoing in my head, and every time I mention tomatoes I taste a mild spice of irony. Stats is not my natural game: my gig was teaching kids how to decipher inscriptions, which is less useful here than one… Read more »

Mike L
Mike L
6 years ago

Quick thanks from someone who stayed up far too late watching election returns. The community here is smart, informed, and always civil.

e pluribus munu
e pluribus munu
6 years ago
Reply to  Mike L

It’s eerily like our political discourse, isn’t it: calmly intelligent, fact based and critically reasoned, and, of course, polite to a fault. It’s nice to think that HHS is just a reflection of America at large.

Richard Chester
Richard Chester
6 years ago
Reply to  Doug

They all have 500+ G, 0 GS and ERA+ >= 135, but so do 11 others

Richard Chester
Richard Chester
6 years ago

Should be 10 others.

Paul E
Paul E
6 years ago

How about all of the above AND IP > 1 x G ?

trackback

[…] previous post on the 1893 adoption of the 60 foot 6 inch pitching distance focused on the impact to pitchers. […]

trackback

[…] of the pitcher’s mound gave birth to the enhanced roles of key features of modern baseball: relief pitching and slugging. Having spent some time learning more about those years, I now see the impact of the […]