Fun Facts: a sampling of statistical oddities

Thanks to Richard Chester for providing this fun assortment of odd statistical facts.

In recent weeks there have been several articles posted by Doug and Dr. Doom which have been very deep and thought-provoking. As a change of pace I have decided to submit an article which is not as mentally challenging and somewhat fun (I post regularly on Twitter, so you may have seen some of these items there). Many of these facts have probably never been seen anywhere else, and you may get a kick out of some of them. All stats are for the searchable era.

Team Scoring

Here is a list of the most frequent game scores in the ML, 1901-2017:

Notable are the high incidence of one-run scores among the most common game scores. The proportion of games decided by one run is illustrated below together with runs per team game (a spreadsheet with these data is available for download here).

The two data series tend to move in opposite directions, with 1 run games declining when scoring is up, and increasing when runs are harder to come by. It’s notable, however, that in the similar offensive environments of the 1920s to early 1930s and the mid-1990s to mid-2000s, the percentage of 1-run games was noticeably higher (in relative terms) in the earlier period. My hunch is this would be attributable to more home runs being hit in the latter period and the propensity for the long ball to break open close games.

As would be expected, the most unusual number of runs scoring in a single half inning are the highest totals, illustrated below for seasons through 2017.

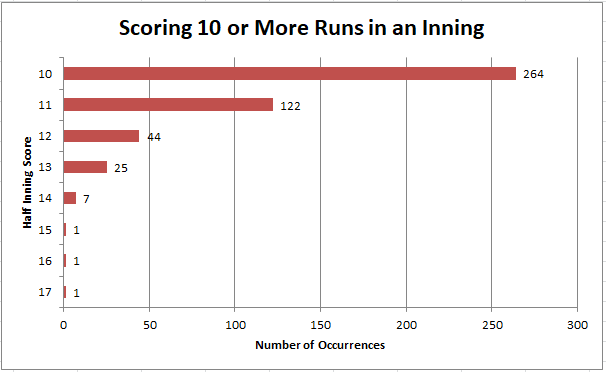
  • The Red Sox are the latest team to score 11 times in an inning, squishing the Fish on August 29th this season.
  • On July 31st this season, the Mets scored exactly 3 runs in each of 4 consecutive innings in their 25-4 romp over the Nats. That’s happened only five other times since 1908: by the Yankees on 6-25-30 and 6-30-30; the Dodgers on 8-15-53; the Cards on 8-27-78; and the Red Sox on 6-30-93.
  • On June 30 this season, the Red Sox beat the Yankees 11-0, and the next night, the Yanks returned the favor, leading 11-0 after 8 innings of an 11-1 rout. Had New York held onto that 11-0 lead, it actually would not have been the first time that teams had exchanged wins in consecutive games with that score – the Brewers and Reds did so in 2006, on April 22nd and 23rd.
  • Perhaps the most bizarre extra-inning line score was this game between the Mariners and White Sox on June 5th, 2013. Scoreless through 13 frames, both teams put up a 5-spot in the 14th before the visiting ChiSox won it with a pair in the 16th.
  • On July 17th, 1918 the Cubs defeated the Phils 2-1, scoring singleton runs in the first and 21st innings. The Cubs’ 19 consecutive goose-eggs is the longest streak in a game in which a team scored all of its runs in the first and last innings of a game.
  • Looks to me like the Yankees-Twins 2017 wild card game was the first in post-season history with a 3-3 score after one inning.
  • 2017 WS game 7 was the 4th WS game with a 5-0 score starting the bottom of the second inning.
  • Largest margin of victory on Opening Day was 18 runs as the Yankees defeated the Senators 19-1 on April 13th, 1955, a game that I attended.

Iron Men

Players with a qualifying season in every season played (entire career since 1901). Minimum of 10 seasons.

Only Puckett and Johnson from the above list met the modern qualifying standard in each season of 3.1 PA per team game. Going into 2018, Robinson Cano had 13 such seasons but after this year he drops off the list.

Most consecutive seasons with 150+ games played.

The other Billy Williams was also quite the iron man, playing at least 85 games in all 18 of his minor league seasons, including 100+ games 15 times. His only major league service came in the last of those seasons, at age 37.

Tale of the Tape

  • Since 1901 there have been 167 players 5’6″ or shorter. 154 of them began their careers before 1959.
  • In 1901 25% of all ML players were at least 6 feet tall. In 2017 that percentage was 85%.
  • The first really big man with a notable career, Frank Howard launched 10 blasts in only 20 AB during a 6 game home run steak from 5-12-68 to 5-18-68.

Hitting Pitchers

Some cool stats about Johnny Sain.

  • In 1946, as a batter, he had 0 SO in 104 PA, most seasonal PA for a pitcher in a season without a whiff, and bettered by only 2 position players.
  • Sain struck out only once in his first 167 PA; the only player I can find with a longer career start before his second strikeout is Sain’s teammate Tommy Holmes, who struck out once in his first 198 PA.
  • Sain’s career rate of striking out once in every 42.8 PA makes him one of only 6 players to play their entire careers (min. 800 PA) since 1901 and record a rate above 40 (Sain pitched to four of the others, and recorded just one strikeout in 93 PA).

Tony Cloninger on 7/3/1966, and Camilo Pascual on 4/27/1965, are the only starting pitchers to hit a GS before they threw a single pitch (making these events in consecutive seasons odder still). Obviously the homers were hit in the top of the first inning. with Cloninger doing so in the game in which he hit a pair of grannies.

The only relief pitcher (and not a position player who came in to relieve) to match Cloninger’s and Pascual’s feat is Early Wynn, then of the Senators in a 9/15/1946 game against the Tigers. His GS came as a pinch-hitter for starting pitcher Roger Wolff in the top of the 5th inning, after which he finished the game and earned the win. As Wolff had allowed three home runs over his 4 innings of work, it makes you wonder whether Sens manager Ossie Bluege had already decided to replace him in the next inning and had Wynn warming in the bullpen as the Sens batted in the fifth. As the inning was a lengthy one (the Tigers had already made a pitching change before Wolff’s spot came up 8th in the inning) perhaps Wynn was already warm and thus was allowed to hit, given the score (Washington was leading 7-3) and his reputation as a good hitting pitcher.

Potpourri

Lou Gehrig (twice), Jimmie Foxx and Todd Helton are the only players to accumulate 100+ 1B, 100+ BB and 100+ XBH in a season. Foxx’s season (1932) was his first of three straight with 40 HR and 100 RBI, a feat unmatched by another Athletic until Khris Davis completed that three-peat this season.

The RC Cola fun fact: Roberto Clemente and Roy Cullenbine are the only retired position players with 4+ WAR in each of their last 5 seasons.

Most GIDP in a rolling 5 year period.

  • 150 – Jim Rice (ending 1986)
  • 145 – Jim Rice (1985)
  • 143 – Jim Rice (1987)
  • 137 – Miguel Tejada (2009)
  • 132 – Miguel Tejada (2008)

Most 2B in a rolling 5 year period

0 0 votes
Article Rating
Subscribe
Notify of
guest

58 Comments
Oldest
Newest Most Voted
Inline Feedbacks
View all comments
Richard Chester
Richard Chester
5 years ago

Doug: Thanks for rearranging those stats in a more logical order. And thanks for the correction for the Clemente-Cullenbine. Also Cullenbine has the lowest BA for a qualified player with a seasonal OBP of greater than .400. In 1947 he batted just .224 with an OBP of .401.

Bob Eno (epm)
Bob Eno (epm)
5 years ago

Too much to take in on a single reading, but I already know my favorite among these dazzling factoids: the most lopsided opening day rout ever, Yankees over Senators 19-1 in ’55 — because Richard was there.

Richard Chester
Richard Chester
5 years ago
Reply to  Bob Eno (epm)

Attendance for that game was all of 11251. It was a miserable day, cool, damp and drizzly. My friends and I were so chilled that we ran up and down the bleacher stairs between innings to keep warm. By the way, Bob, if you were an ML player you would be tied for 3rd place with 69 others for the shortest name. Ed Ott and Ed Hug had the shortest names.

Bob Eno (epm)
Bob Eno (epm)
5 years ago

Not just ranked high among those short in name, Richard. According to your gathering of stats, I’d have been among the top 14 shortest in stature debuting post-1959. It seems I was an outstanding prospect in multiple respects. Too bad skill playing baseball wasn’t among of them.

no statistician but
no statistician but
5 years ago
Reply to  Bob Eno (epm)

In retrospect, Richard, I’m sure you wish that you had been more aware that history was being made, even minor history. As Walter Cronkite was intoning on Sunday afternoons around then, “What sort of a day was it? A day like all days, filled with those events that alter and illuminate our times”—and you really were there. Some random stats from that game: In the Washington lineup were probably the four best long-term position players the Senators fielded in the Fifties, Yost, Vernon, Runnels, and Sievers. The Nats still only managed two hits. Ford went the distance for the Yanks… Read more »

Mike L
Mike L
5 years ago

” Ford went the distance for the Yanks and garnered three hits himself and four RBIs…” And Ford registered negative WAR for the game.
Sorry, couldn’t help it. Good morning. I had writers block (for something else) all weekend and y’all just gave me an idea.

no statistician but
no statistician but
5 years ago

A few more comments: Good to see Del Pratt mentioned in any context. Like Larry Gardner, an under-appreciated infielder from a hundred years ago, a bona fide RBI man, as noted somewhere by Bill James. Howard was certainly the first big position player of note, but to my mind Gene Conley wasn’t too shabby on the mound in the previous decade. Roy Cullenbine’s record is probably somewhat inflated by the fact that his career bloomed late, meaning that three of those five years were 1943-45. The only really surprising name in your many observations is Wid Conroy, infielder for the… Read more »

CursedClevelander
CursedClevelander
5 years ago

In JAWS ranking among 2B, Pratt slots in right between Buddy Myer and Larry Doyle. That seems fantastically appropriate to me – three guys largely forgotten by history but well represented in contemporary accounts and well regarded by the baseball men of their day.

Some great warriors die and go to Valhalla. Pratt was born there – well, almost. Walhalla, with a W.

Bob Eno (epm)
Bob Eno (epm)
5 years ago

I think your RC Cola fast fact may need to specify that it is a hitters-only stat, Richard. Among pitchers, Koufax, at least, would qualify.

Richard Chester
Richard Chester
5 years ago
Reply to  Bob Eno (epm)

Bob Eno: You are right about Koufax. As a matter of fact he did it for his last 6 years. Since 1901 no other pitcher has done it for more than his last 2 years.

Paul E
Paul E
5 years ago

Richard Chester:
“Largest margin of victory on Opening Day was 18 runs as the Yankees defeated the Senators 19-1 on April 13th, 1955, a game that I attended.”
A true omen of things to come as those Senators finished 43 games behind the NYY in last place

mosc
mosc
5 years ago

Here’s a random 2018 statistical feat.

Betances threw 100 K’s for the 5th straight year without starting a game on September 1st. How many other pitchers have done that?

Chapman? No (close, but no)
Gossage? No
Kimbrel? No
Rivera? No
Hiller? No

Anybody else done this?

Richard Chester
Richard Chester
5 years ago
Reply to  mosc

My PI search shows only 2 pitchers with as many as 5 seasons with 100+ strikeouts and no starts. One is Betances and the other is Goose Gossage but his (Gossage’s) were not in 5 consecutive years

no statistician but
no statistician but
5 years ago

In 1946 Bob Feller pitched 371.1 innings and struck out 348. Betances in five years and some small change has pitched 370.0 innings and struck out 604. Feller was awarded 10.1 pWAR for the one season. Betances is currently riding 11.5 pWAR. The longest stint Betances has ever thrown is 2.1 innings, twice early in his career. Feller in ’46 pitched 36 complete games and 10 shutouts. I don’t doubt that the WAR figures are correct. It’s just that no one could ever explain to my satisfaction that these two utterly non-comparable sets of results can be equated on the… Read more »

Bob Eno (epm)
Bob Eno (epm)
5 years ago

Well, WAR is blind to CGs and ShOs, which I think is ok. The relevant figures here are K/9 and IP, though, of course, the WAR figures are picking up other factors, such as Betances’ career ERA+ being 30 points higher than Feller’s in 1946. But skipping that to address your main point, I think the key issue is that if we consider a starting pitcher who is averaging, say 8 IP/G versus a closer or equivalent with 1 IP/G, what changes that WAR does not consider is the superiority or rarity of the performance level compared to expectations for… Read more »

Mike L
Mike L
5 years ago
Reply to  Bob Eno (epm)

Let’s pretend you are a GM with perfect foresight. You can select one of the following five pitchers:
Mariano (56.2 BWAR), Hershiser (56.3). Hamels (56.1), Stieb (56.7) or Ford (56.9)?

Dr. Doom
Dr. Doom
5 years ago
Reply to  Mike L

Ford, assuming there’s no Korean War to contend with… which is why this isn’t Ford’s best comp group. But let’s pretend he had two seasons with no value – replacement-level seasons in 1951 and 1952. (For the record, you also did your search including hitting value; Orel Hershiser the pitcher is nowhere near the others, since 5 of his WAR come from the bat.) I’d probably take Ford. Mostly because Fangraphs likes him considerably more than the other 4 – Fangraphs sees him as the only 50-win player in the bunch (no one else above 48, with Ford at 55).… Read more »

Dr. Doom
Dr. Doom
5 years ago
Reply to  Bob Eno (epm)

WAR does use different replacement levels for starters and relievers. There is a much higher level of performance assumed for a reliever than there is for a starter… although that change only occurs after 1960, because that’s when, in terms of the data, we start to see a difference in performance between starters and relievers. Plus, many relievers prior to that time WERE starters. Or, anyway, there wasn’t that same divide. An explanation can be found here. A different divide happens due to the leverage index; reliever innings (well, those handled by closers and set-up men) are leveraged and are… Read more »

Bob Eno (epm)
Bob Eno (epm)
5 years ago
Reply to  Dr. Doom

Thanks for this information, Doom. I didn’t know about either factor, and appreciate having the link (for some reason, I always have trouble on B-R when I try to search out the pages on WAR calculations). The replacement-level distinction is, obviously, something I think is good, but the leverage index factor seems problematic to me, and it seems, from your phrasing, that I have company. However, I really need to think this over more thoroughly, since I can see the beginning of a counter-argument. (Gotta say, those B-R page explanations aren’t exactly models of clarity.)

Dr. Doom
Dr. Doom
5 years ago
Reply to  Bob Eno (epm)

The replacement-level change for starters and relievers is found under the column “RA9role” when you’re looking at the pitcher’s WAR stats. As for the leverage index factor: Wow, are there a lot of perspectives on this. When designing a WAR framework, it’s certainly something worth considering. For one thing, it means that pitchers who come in to do 3 innings of mop-up duty when down 11 runs are treated as if their innings don’t matter… which, really, they probably don’t. So that’s intuitive. Likewise, closers are sure paid like their innings mean more. So… probably they do. The skepticism comes… Read more »

Bob Eno (epm)
Bob Eno (epm)
5 years ago
Reply to  Dr. Doom

You’re absolutely right, Doom. I think WPA is a very valuable concept to incorporate, although I have reservations about the stat, because it deals only with end-of-play outcomes, and hitters and pitchers — as hitters and pitchers — only have direct impact on the start-of-play dynamics (so, for example, the batter who hits a clutch single to advance the runner to third gets negative WPA if the runner is thrown out when he unwisely tries to score). And I’ve wrestled with the Runs/Wins alternatives. I read James’s articles when they came out (and remarkably bad-tempered ones they were, though his… Read more »

Mike L
Mike L
5 years ago
Reply to  Bob Eno (epm)

Bob, how do you think the radically different approach to roster management (12/13 man pitching staffs?) and in-game usage impact WPA results. I went back and looked at the entire 1950’s decade for Cleveland and it turns out they had only three total seasons where any pitcher appeared in more than 48 Games: Lew Brissie in 1951 (54), Ray Narleski (60) and Don Mossi (57) in 1955. A lot of the high leverage situations were just left to the starters to work through. Looks like carrier a total of eight pitchers most of the time.

Bob Eno (epm)
Bob Eno (epm)
5 years ago
Reply to  Mike L

Sorry I missed seeing this yesterday, Mike. You raise a good issue. The rise in staff numbers and of short-stint relief roles would certainly have dispersed pitching WPA numbers among a larger group, and probably raised the total positive value, since the staffs are an enlarged run-prevention tool for managers. I expect that trend (assuming I’m right about its existence) to rise, as I think more and more managers will use position players as mop-up men in true blowouts (although you get a few nice performances, I think this is a bad development because such games lose their integrity). For… Read more »

Doug
Doug
5 years ago

Here’s an interesting stat I just heard. The Rays blanked the Blue Jays tonight on three hits. It was the 7th straight game that Tampa has held Toronto to 5 hits or less, said to be the single-season live ball era record for any two opponents. The Orioles also held the Washington Senators to 5 hits or less in 7 straight games, but it was one of those wrap-around streaks, starting in Sept 1968 and continuing into the following season.

yippeeyappee
yippeeyappee
5 years ago
Reply to  Doug

Speaking of the Jays, Doug. Rowdy Tellez just began his career with 3 straight doubles. Who was the last player (if any) to do that?

Doug
Doug
5 years ago
Reply to  yippeeyappee

Tellez is the third player with three doubles in his first career start, following Ben Grieve (1997) and Nick Evans (2008). After his pinch double yesterday, Tellez joins Grieve as the only players with four doubles in their first two career games.

Like Tellez, Grieve’s first four career hits were all doubles. Ditto for Del Rice and maybe some others.

yippeeyappee
yippeeyappee
5 years ago
Reply to  Doug

Thanks. I saw a posting from MLB saying he is the first player in the live ball era to have an XBH in each of his first 3 ABs

Richard Chester
Richard Chester
5 years ago
Reply to  Doug

Carlos Gonzalez’s first 7 hits were all doubles.

Richard Chester
Richard Chester
5 years ago
Reply to  Doug

Jim Lefebvre’s first 4 hits were all doubles.

Doug
Doug
5 years ago
Reply to  yippeeyappee

Staying with the Blue Jays, tonight they walked off the Indians with one out in the 11th, the shortest (by one out) of 18 games that a team has won despite striking out 20 or more times. Kevin Pillar delivered the winning HR and was the only Toronto starter that Indian hurlers could not whiff.

Updating Tellez, he had two more doubles (and no other hits) for a total of 6 two-baggers three games into his career, two more than any other searchable player.

Doug
Doug
5 years ago
Reply to  yippeeyappee

Tellez had his first oh-fer on Sunday, ending his extra-base hit streak at 4 games, one game shy of the record to start a career (shared by Enos Slaughter, Will Middlebrooks and Jorge Soler). Tellez in the 9th player to start a career with an extra-base hit streak of 4 or more games, three from 1908 to 2011, three just in the 2012 season (Machado, Cespedes and Middlebrooks), and three more since 2012.

no statistician but
no statistician but
5 years ago

To get back to Richard’s original stats for a moment, it may be self-evident to everyone but me, but in terms of the most common outcomes in baseball historically, I find it something of a shock that the four at the top of the list are decisions by one run, that five of the top eight are decisions by one run, that all of the top eight are by one or two runs. This made me take a look at the percentage of one run contests with my limited capabilities—i.e, spot checking, since I don’t have the knowhow to do… Read more »

Bob Eno (epm)
Bob Eno (epm)
5 years ago

Terrific comment, nsb! I looked at the chart and completely missed its implications, and I wouldn’t have followed up as you have and discovered that we’re in the midst of another apparently systematic change (because I wouldn’t have known how to do it, because I’m lazy, and because I doubt the question you asked would have occurred to me). It makes sense that R/G would be a key driver of the proportion of games decided by one run: the higher the average score, the less likely the winning margin will be small. My intuition would be that, in addition R/G… Read more »

Richard Chester
Richard Chester
5 years ago
Reply to  Bob Eno (epm)

Bob: Here’s how you can do it but you need a BR PI subscription. To determine the number of 1-run games logon to the BR PI and set it as follows: Click on Play Index and set it for: 1) Team Batting Finder 2) # of Team Games Matching Criteria in a Season 3) Years, 1908-2018 4) Additional Criteria, Run Differential (RS-RA) = 1 5) Get Results The Results Page shows the number of games in which the criteria was met for each season. This list shows games for the winning teams only as only 1 team can have a… Read more »

Bob Eno (epm)
Bob Eno (epm)
5 years ago

Whew! I got it Richard, after a few misfires too embarrassing to describe. Thanks!

no statistician but
no statistician but
5 years ago
Reply to  Bob Eno (epm)

How did I find the data? At B-R under Seasons in the bar near the top you can pull down a list of MLB Standings by year. In the Detailed Standings there’s a column recording 1-run games per team with an average at the bottom. For 2018 I also looked at the two league averages—19-19 for the NL, 18-18 for the AL which translates into 18.5-18.5, or 37 one run games per team so far. It’s obvious that the figure is approximate and gets rounded up or down. Anyway, last year the average was 21-21, or 42 games per team.… Read more »

Bob Eno (epm)
Bob Eno (epm)
5 years ago

That’s ok. All you have to do is change your screen name to,”no statistician? but”.

I found the table you used — many thanks!

Richard Chester
Richard Chester
5 years ago

nsb: Due to an oversight on my part the numbers in the 2 charts above are about 1% too high. The “Most Common Game Scores” chart should read as follows: 11274 10851 9290 8437 7201 6584 6236 6009 5817 5654 The” Scoring Ten……” chart should read 263 121 The remaining numbers are correct. As of yesterday, 9/6, there have been 2098 games played. According to the BR Play Index 573 have been decided by 1 run. the percentage of 1-run games is 27.3%. Average per team is 573/30 = 19.1. For a full season that projects to 22.1. I think… Read more »

Richard Chester
Richard Chester
5 years ago

nsb: I think my last 2 sentences in my last paragraph are incorrect.

Richard Chester
Richard Chester
5 years ago

Should be last 3 sentences.

no statistician but
no statistician but
5 years ago

This is not a reply but a test

Spahn 7308 95 81 54 .0241
Osteen 5315 76 110 41 .0284
Simmons 4984 121 78 61 .0299

Bob Eno (epm)
Bob Eno (epm)
5 years ago
Reply to  Doug

Thank you, Richard. I was planning to do this, putting off the work, and I’d never have done it this neatly.

Doug
Doug
5 years ago
Reply to  Doug

Make it 55 one-run games for the Mariners, after a 5-4 loss on Wednesday.

no statistician but
no statistician but
5 years ago

Before leaving the subject of Whitey Ford to another time, I decided to do something I’ve often thought about, but considered too daunting, comparing his supposed superiority at containing baserunners to that of his peers. The following figures—hope they come through in a relatively ungarbled fashion—compare five things among Ford and the other prominent to adequate lefties whose careers corresponded with or overlapped with Whitey’s. Totals for some of the earlier pitchers like Newhouser and Lopat are partial, but the sampling is large enough to be indicative, if not precise, or so I have decided. SBO: Stolen base opportunities. SB:… Read more »

no statistician but
no statistician but
5 years ago

Oh—I’m going to be away for a week or so, meaning I’ll only be able to reply to responses, if any, through tomorrow morning.

Richard Chester
Richard Chester
5 years ago

Whitey Ford holds the seasonal record for the most IP without a SB against him. In 1961 he threw 283 such innings. Altogether he had 4 seasons of 0 SB with more than 162 IP.

Doug
Doug
5 years ago

The A’s are the latest team to score 10 in an inning, roasting the Orioles in the 3rd inning on Wednesday. All but one of those 10 runs scored with nobody out as the first 11 batters of the inning all reached base safely. The other odd thing was that that was the only inning Oakland scored in as they shutout Baltimore 10-0, holding the Orioles to only a first inning single.

Richard Chester
Richard Chester
5 years ago
Reply to  Doug

Most runs in a game with all runs being scored in 1 inning.

13 runs:
9/20/1972 Braves
4/13/2003 Phils

12 runs:
7/2/1943 Indians

11 runs:
6/3/1933 A’s (they lost that game to the Yankees 17-11)
9/7/1942 Pirates
7/6/1954 Indians
9/2/1959 White Sox
7/15/1972 Phils
5/8/1995 Padres
9/6/2002 Cards
9/17/2007 White Sox
7/3/2010 Yankees

Doug
Doug
5 years ago

Red Sox beat the Blue Jays 1-0 on Wednesday to reach 100 wins for the first time since 1946. It was only the 89th 1-0 win for Boston at Fenway, and the first since 2015.

Voomo Zanzibar
Voomo Zanzibar
5 years ago

Kyle Freeland, of the Denver team, home/road splits:

8-2 … 2.21 … 1.143
6-5 … 3.51 … 1.316

Maybe it helps to actually be from Denver.

Voomo Zanzibar
Voomo Zanzibar
5 years ago
Reply to  Voomo Zanzibar

The only two qualifying seasons where a Rockie had a lower ERA than Freeland, neither of them approached that sort of home performance:

2.90 … Marvin Freeman (’94)
3.19 … Ubaldo (2010)

oneblankspace
5 years ago

The Orioles today scored 5 runs on 3 hits (and 1 Sox error) in the first inning today, with no walks or hit batsmen. Two Orioles reached on fielder’s (bad) choices that failed to retire the runner.