
Always the staple of most pitchers’ repertoires, fastballs have nonetheless become less prominent during the time that data have been consistently recorded at the pitch level. I’ll explore that phenomenon and related questions after the jump.
Here’s our first chart, showing the percentage of pitches thrown since 2002 that were judged to be fastballs.
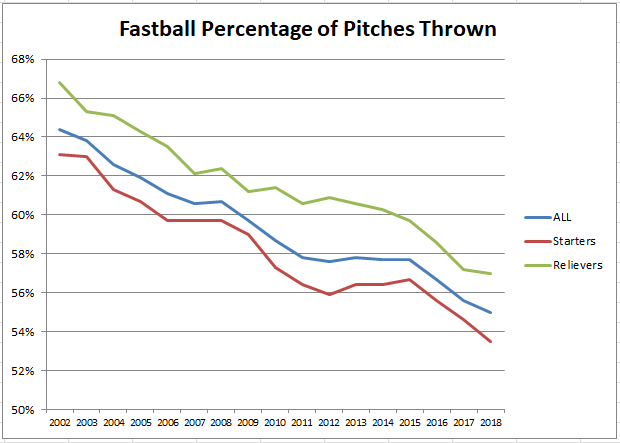
Relievers do throw more fastballs than starters, but the decline in fastball usage is consistent for all pitchers. That decline stalled from about 2012 to 2015, but has since resumed its slide over the past three seasons.
So, what are pitchers throwing instead of the fastball? Here are the trend lines for the other pitches.
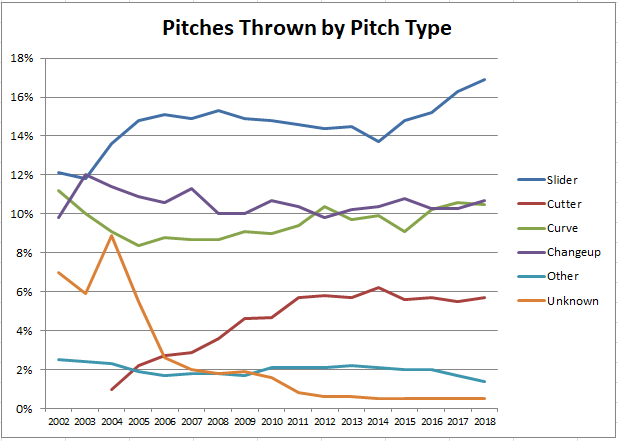
Some observations on the above chart.
- In the first few years that these data were recorded, there were sizable numbers of unknown pitches, but as the pitch identification mechanism has been refined, unknown pitches have diminished to well under 1% since 2010.
- Cutters have been recorded separately only since 2004, with their initial sharp rise likely attributable to refinements in the pitch identification mechanism, and to increased popularity of the pitch owing to the success enjoyed by early adopters, most notably Mariano Rivera. Since about 2010, though, there has been little change in cutter usage.
- Slider usage surged in tandem with cutters early in this period (possibly the two were not always distinguished accurately when cutter identification was introduced) then steadied for about 10 years before rising fairly sharply over the past few seasons.
- Curveballs and changeups have been mostly steady throughout this period.
So, the question that remains is why has pitch selection changed as much as it has over the first part of this century. Part of the answer has been the approach batters have taken. It’s certainly obvious that batters are swinging harder and, as a result, missing more than ever before, with new strikeout records being set every year. But, with those harder swings also comes harder contact, as shown in the chart below.
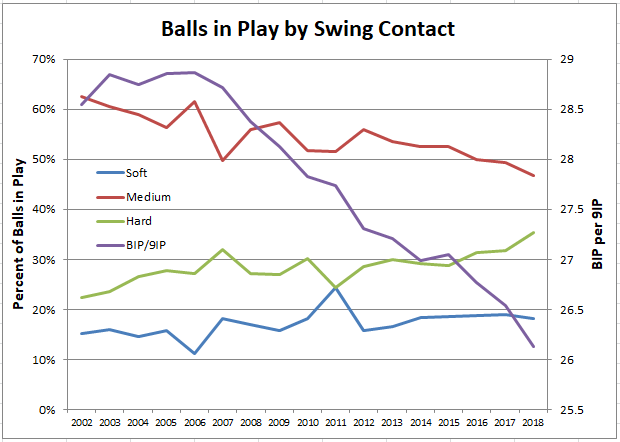
So, both hard and soft contact have increased at the expense of medium contact. Meanwhile, the interminable rise in strikeouts has produced a corresponding steady decline in balls in play as shown by the violet line.
The increase in hard contact is most notable on fly balls, indicated in the chart below showing recent increases in line drives as a percentage of balls in play (left axis) and in home runs as a percentage of fly balls (right axis).
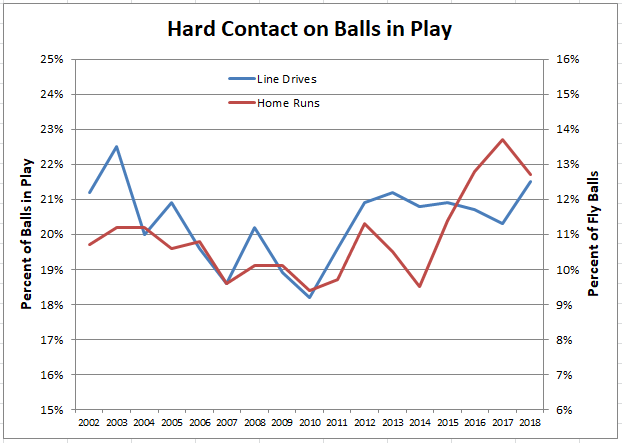
The measure of line drives as a percentage of fly balls has also shown noticeable increases recently, averaging just over 34% from 2006 to 2010, but jumping to an average of more than 37.5% since then.
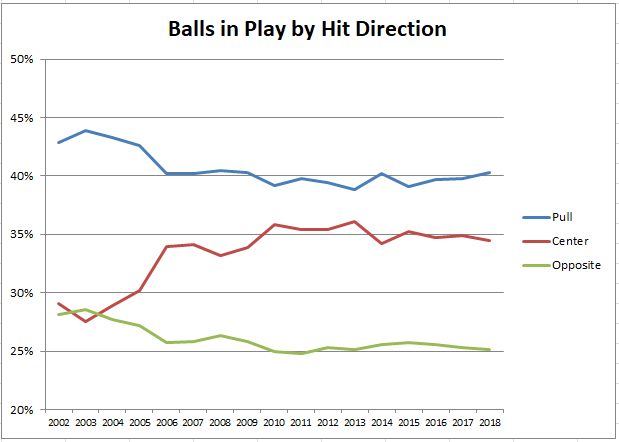
Given the increase in hard contact, it’s not surprising that pitchers have chosen to move away from the fastball and instead feature pitches with more movement that should be harder to square up. That strategy has paid off with more strikeouts and more soft contact, but batters are making up that deficit with harder and more damaging contact when they do connect. To limit that damage, teams in recent seasons have attempted to reduce the number of runners reaching base by employing defensive shifts for batters with pronounced tendencies in the direction of their balls in play. So far, any adjustments batters may have made are not reflected in overall measures of hit direction, as shown below.
I’ll close with a look at the question of the run value of different pitches. These run values are provided by FanGraphs and are derived from a linear weights model developed by Baseball Info Solutions that assigns small positive or negative run differentials to each pitch in a pitch sequence. Thus, a first pitch ball would be assigned a small negative run differential (from the pitcher’s perspective) as the batter’s prospects have now improved. Similarly, a first pitch strike would receive a small positive run differential. The largest run differentials, of course, would result from the last pitch the batter sees, resulting in a strikeout, walk (or HPB), or ball in play (an earlier HHS post on pitch sequencing and changes in expected outcomes can be found here). Here are the run differentials for different pitches for the 2018 season.

Remember that this chart is from the pitcher’s perspective, so the pitches that work out better for the pitcher are in green above the line, and those that work out better for the batter are in red below the line. Gross run differential is the sum of the mostly tiny positive and negative differentials of almost three-quarters of a million pitches thrown, so it’s hard to grasp exactly what the number means (I’ll make that clearer in the next chart), but the point I want to emphasize here is that the slider has about the same positive magnitude for the pitcher as the fastball has for the batter, despite the fact that pitchers throw more than three times as many fastballs as sliders. Let that sink in for a moment as I normalize those run differentials in the next chart.
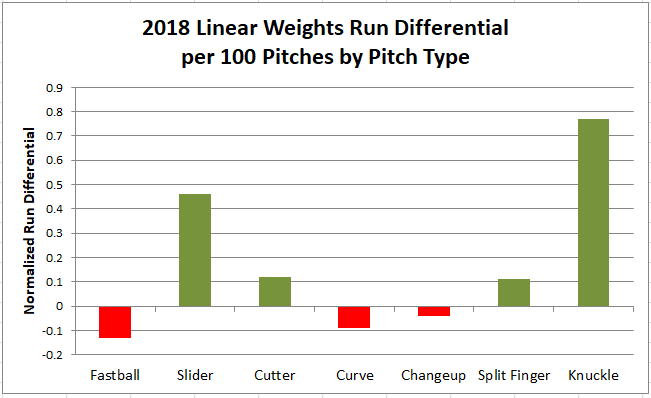
The chart above is showing the same data as before, except that the data have now been normalized to 100 pitches for each type of pitch. As we have seen, the same pitch can have different run values depending on the count or whether the pitch is put in play, so I’m not sure exactly what values were assigned for the 100 pitches (FanGraphs doesn’t say), so will have to just acknowledge that these normalized data are intended to represent the relative run values of each pitch type. Regardless, the fastball is actually not as deadly to pitchers as was suggested in the first chart, but the slider is a huge weapon, more especially since it is used more often than any of the other secondary pitches.
There is, however, quite a difference between starters and relievers, as shown in the chart below.
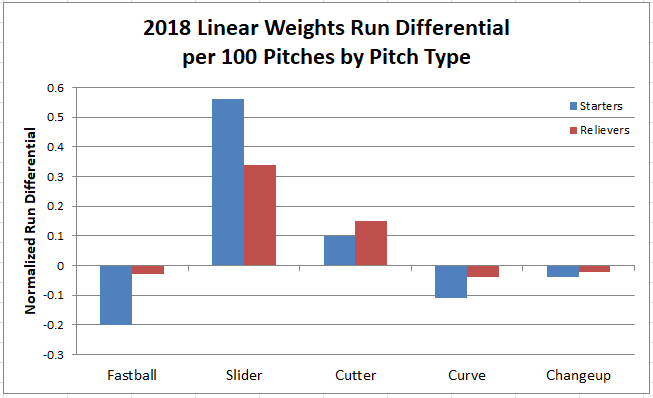
As would be expected, flame throwing relievers that are the mainstay of major league bullpens are more effective with the fastball and cutter while starters have the edge with the slider. Somewhat surprisingly, relievers also have the edge with the curve and changeup, though those pitches (especially the curve) are not commonly featured in the repertoire of most relievers.
So, that is the run differential picture for 2018. But, how has that changed over the period under study? Here’s that chart.
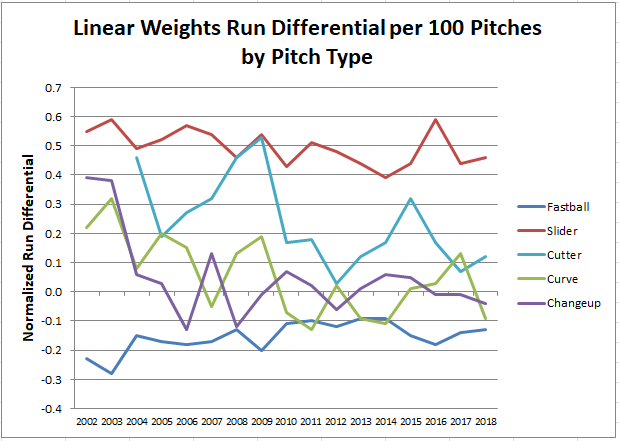
I would tend to discount the first few years on the chart as the kinks were worked out of the pitch identification mechanism. But, fairly consistent results since about 2006 or so, with the notable exception of the cutter which at one point was on a par with sliders for effectiveness, but has since become much more hittable. Bear in mind that these results reflect the changes in pitch usage over this period, so that fastballs have become slightly more effective as their use has reduced, and sliders slightly less effective as their use has increased.
Looking at the same data for starting and relief pitchers shows a bit different results.
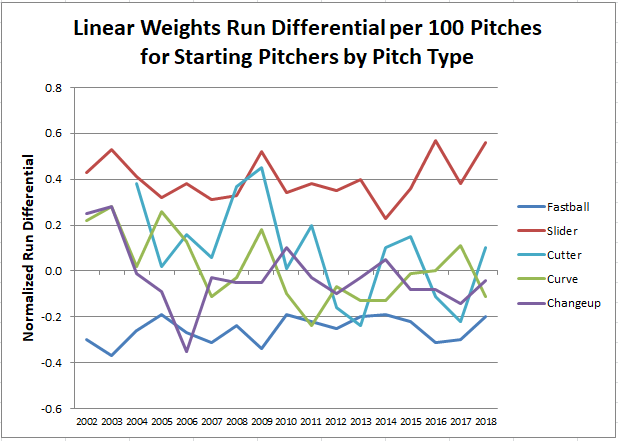
Starters enjoy their best advantage with the slider, an edge which has widened over the past few seasons, even as slider usage has increased. The batters get the upper hand with the fastball, an advantage which has declined only slightly over this period, despite reduced fastball usage. The other pitches are basically a saw-off between pitcher and batter.
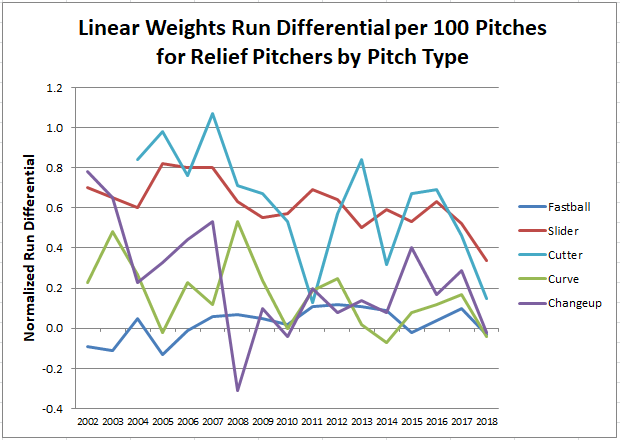
Relievers have the upper hand with the cutter and slider, though that advantage has reduced noticeably in the past few seasons. Pitcher and batter are about even with the other pitches, including the fastball. Looking at these results, the dominance of later inning relief pitching over the past decade is not hard to understand; relievers are no worse than even with whatever pitch they throw, and enjoy moderate to sizable advantages with most offerings.
My thanks to FanGraphs for providing the data for this post. There’s a lot to digest, so I’ll let you do that. But, please do let me know if anything is completely unintelligible and I’ll try to make it clearer.