Power Surge

Home runs and strikeouts are both on the rise this year, to new record levels. So, what else is new, you say. Find out after the jump.

What’s new this year is the magnitude of the increases in whiffs and whallops, especially the latter. At the All-Star break this year, teams had connected for 3691 long balls, 408 more (11%) more than last year, despite having played 7% fewer games than in the first half a year ago. That total is also 379 more (10%) than in the previous record first half in 2017, despite playing only 1% more games in this year’s first half.

Looking at the number of players with 20 home runs by the All-Star break, there were 34 such players this season, 14 more than last year and 10 more than in 2017, and trailing only the 37 such players in 2000.

Projecting this year’s totals to a full season produces results that look like this.

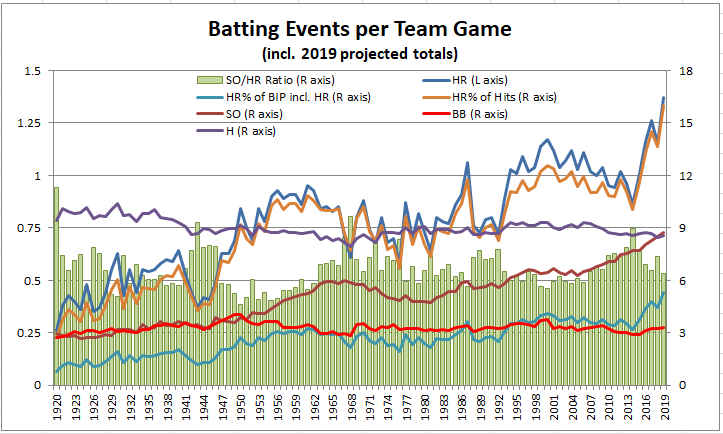
Lots to talk about here, so let me explain. First, let’s look at what hasn’t changed much. That would he hits, which continue their very slow decline, but are generally averaging about 9 hits per team game for the past 75 years or so. And, walks, also basically steady at about 3 per team game. So, with essentially constant hits, the top two lines on the chart, HR per team game, and HR as a percentage of hits, pretty much track each other in lock step as you see on the chart. And, look at the increase since 2014, a mere 5 years ago – the home run rate has jumped from 0.86 per team game to 1.37 this year, a staggering 59% rise.

The other line showing a steady increase is strikeouts, crossing the hits line this year and last, as strikeouts have exceeded hits for the first time. That result combined with the rise in home runs has pushed balls in play ever lower, dropping below 25 per team game for the first time this year and last, after previous first time depths below 26 in 2015, and below 27 in 2009. Thus, compared to 2007, this year there are 11% fewer balls per game that fielders can make a play on. That trend is depicted in the turquoise line near the bottom of the chart, showing HR as a percentage of BIP plus HR, with a result of 5.3% this year compared to 3.2% in 2014, a 66% jump in just 5 years.

The last item on the chart is the ratio of SO to HR, showing a range between 6 and 9 for most of the past 60 seasons or so. That relationship may be more clearly appreciated in the next chart, showing home runs and strikeouts in the first half of the season.

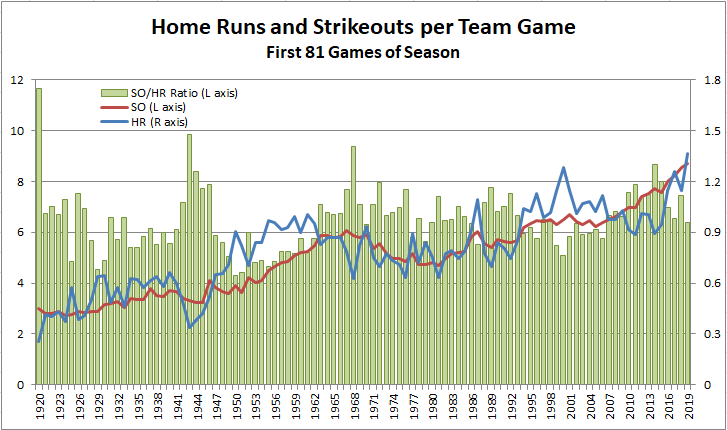
Without the extra things on the chart, the fairly consistent relationship between home runs and strikeouts stands out more clearly. Mostly the two lines track each other closely, with home runs increasing faster than strikeouts only in the 1950s and the 1995-2005 decade, and strikeouts outpacing home runs only in brief periods, the longest being from about 2006 to 2014. In a sense, then, the big jump in home runs since 2014 has really been about “catching up” to the rise in strikeouts over that period.

How do these changes manifest themselves at the team level. That result is shown in the charts below. First, for home runs:

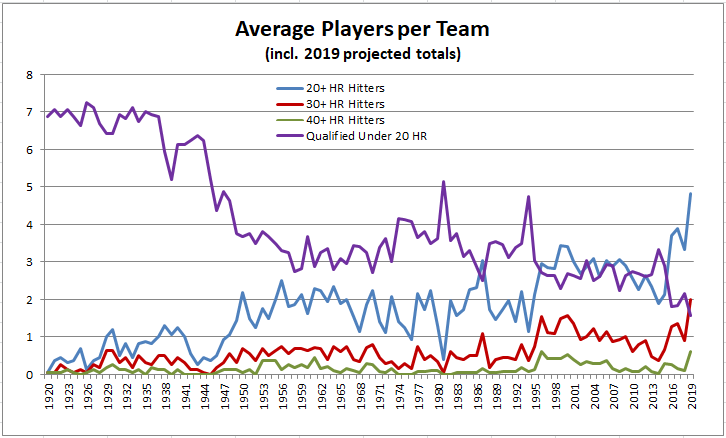
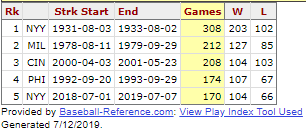
The forecast for 2019 is for each team to average almost five players with 20 home runs, or 145 such players overall. That compares to 57 such players, or fewer than two per team, as recently as 2014. For 30 home run players, the forecast is just over two per team, more than the number of qualified players with fewer than 20 home runs. At the end of the 2017 season, games between the Cubs and Cardinals, and between the Cubs and Reds, featured as many as 11 players in a game then with 20 home runs; look for that record to fall this year.

The picture for strikeouts looks like this.

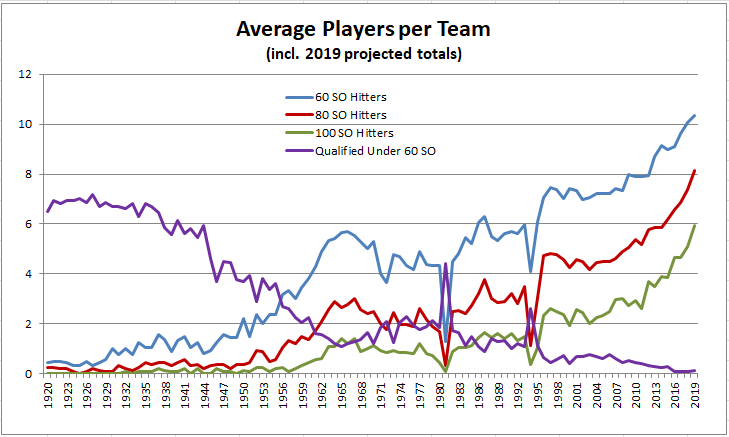
Pretty much every regular player now will exceed 60 strikeouts, with an average of 6 players per team in triple digits, more than double the number in 2011.

Who’s hitting all these home runs? That result is depicted below.

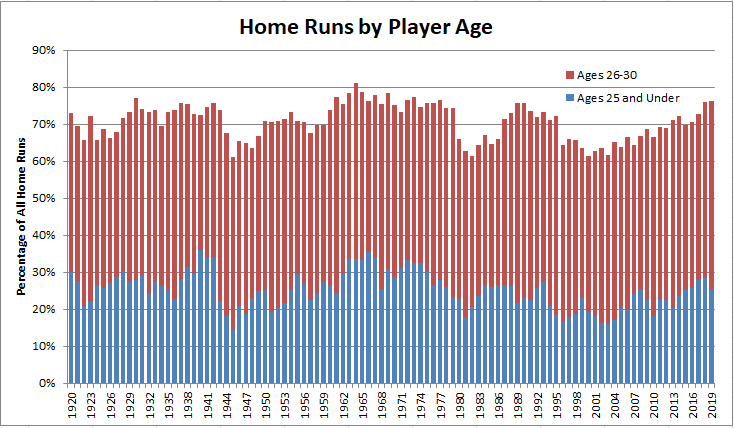
More than 75% of home runs this year will be hit by players aged 30 or younger, not a record proportion but in the same ballpark as the previous highs in the 1960s. It’s also a marked departure from the record lows just above 60% that were seen in the late 1990s and early 2000s. This change over the past 20 years has produced the result shown below.

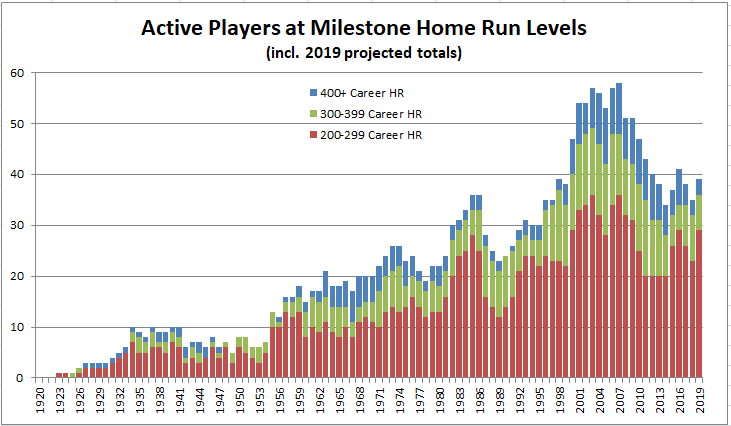
With a larger proportion of home runs being hit by older players twenty years ago, the number of career 200 home run hitters peaked in 2007 before falling by more than a third by 2014. As the current large group of younger power hitters ages over the next 5 to 10 years, expect to see rises in the 200 home run club matching or exceeding previous record totals.

0 0 votes
Article Rating
Subscribe
Notify of
guest

76 Comments
Oldest
Newest Most Voted
Inline Feedbacks
View all comments
Bob Eno (epm)
Bob Eno (epm)
4 years ago

Thanks again for finding and organizing all this data, Doug. It confirms anew the trends that we’ve been discussing here (and that are discussed very broadly, including by MLB). My usual reaction, dutifully fulfilling the requirements of old-guy commentary, is to deplore the narrowing variety of game plays as K’s and HR’s continue their relentless ascendancy. Balls in play, fielders vs. runners, are for me the greatest excitement in the game, though an occasional HR can be great to see. But this time I want, seriously, to share a positive impression I have about the way the game has changed.… Read more »

Mike L
Mike L
4 years ago

To echo Bob below, these trends are not necessarily to baseball’s long-term benefit as entertainment. One of things that’s different about baseball than the other three major sports is that, with the exception of the pitcher, catcher, and perhaps first baseman, most players are involved in a comparatively small number of plays in any game. The rest of the time, they are either standing still (or moving into position) or in the dugout waiting to come to the plate. The more we go to TTO, and to modern management that eschews things like the bunt, the hit and run, hitting… Read more »

Doug
Doug
4 years ago

While attention was focused on the Yankees record 31 game streak with a HR that ended last week, they have another notable streak still going. Friday’s game is their 171st straight scoring a run, the fifth longest searchable streak. It could become the second longest streak before the end of August.

Voomo Zanzibar
Voomo Zanzibar
4 years ago
Reply to  Doug

Reds managed to do it and barely crack .500. Their streak actually began with a tie on opening day. They were shut out for the final game of 1999, one of only two shutouts in that season, the other being on April 30th. So that was 141 out of 142 games without a goose egg immediately before the 208. (no such lack-of-zeros after the streak ended in 2001). _________ The Yankees streak began the day after being stopped in the 2nd game of a doubleheader by the Red Sox’ Wilcy Moore. The streak was ended by Lefty Grove. Grove was… Read more »

Bob Eno (epm)
Bob Eno (epm)
4 years ago

Back on the topic of Doug’s post, I just came across an article on Deadspin.com that attributes part of this year’s home run surge to changes in the manufacture of baseballs by Rawlings, that have made the ball more aerodynamically active. The article connects three elements: Rob Manfred’s declared wish for increased offense; MLB’s purchase of Rawlings; scientific studies indicating changes in the ball that have the effect of juicing it. (The main scientific article referenced is, unfortunately, behind a pay wall.) It seems to me we’ve been here before. FiveThirtyEight.com reported small changes in baseballs since 2015 that enhanced… Read more »

Doug
Doug
4 years ago
Reply to  Bob Eno (epm)

I recall an article we discussed some time ago about the technical specs for baseballs. There was an “expert” quoted who explained how the different specifications (for weight, circumference, seams, etc.) would enhance aerodynamics, The main point was that the tolerances for these specs (e.g. the weight must be between x and y) were large enough to significantly affect how the ball would fly, So, if there’s been a change in manufacturer, or the location of manufacture, or even just the raw materials and/or their supplier, and one or more specs has shifted in the direction of a livelier ball… Read more »

Bob Eno (epm)
Bob Eno (epm)
4 years ago
Reply to  Doug

I’m not sure how much this sort of random variation could account for what we’re seeing. After all, the variation can move in either direction and I haven’t encountered any data that MLB has loosened its tolerances, so the leap this year is outside the range of normal variation. Moreover, unlike a truly anomalous year, like 1987, the 2019 spike is part of an ongoing trend, especially when we consider the stat, HR/(BiP+HR). The message of the Deadspin article was Justin Verlander’s: MLB is not getting sloppy and letting Rawlings determine the quality control of the balls, it is directing… Read more »

Doug
Doug
4 years ago
Reply to  Bob Eno (epm)

Give everyone McNeil’s bat. I like it. Just by the by, but I happened to catch the final inning of the ’68 WS on You-Tube. The whole inning, top and bottom, was less than 10 minutes, including commercials. Most hitters were swinging on the first pitch and, often as not, putting it in play. But, their swings seemed so strange compared to today’s mighty cuts. Just trying to meet the ball and make contact. Even the one home run ball was nothing like today’s max effort swings – just a controlled, smooth swing that found the sweet spot. But, it… Read more »

Bob Eno (epm)
Bob Eno (epm)
4 years ago
Reply to  Doug

Well, climatologists tell us we’re in for a sea change, so perhaps . . .

Paul E
Paul E
4 years ago
Reply to  Bob Eno (epm)

Move the fences back, no kidding. This might cut down on seating but at least more balls would be in play and it might encourage athleticism in outfield play as well as speed on the basepaths. Perhaps a mandatory 345′ in the corners, 385′ in the alleys, and 415′ to CF? To balance it out, move the fans closer to the game and reduce foul territory. This will also provide additional seating and revenue to make up for the seating lost to the deeper fences. IIRC, when the Phillies opened their current home park, they had something like “375” painted… Read more »

Doug
Doug
4 years ago
Reply to  Paul E

Might actually see some more triples in the game with deeper fences, which would be a welcome change.

Really, it’s only the two old-time ballparks where this would be a problem. Extending fences would impinge on bullpens in many parks, but that can be easily remedied by moving the bullpens to foul territory and, in some configurations, replacing lost seating with new seating where the bullpens were before.

Voomo Zanzibar
Voomo Zanzibar
4 years ago

Yankees were down to their last out before scoring today.
Was getting ready to comment on Doug’s jinxing abilities.

Doug
Doug
4 years ago
Reply to  Voomo Zanzibar

Well, maybe the jinx was this. The last two games are the first time this season that neither team has homered in consecutive games at Yankee Stadium.

Doug
Doug
4 years ago

Travis d’Arnaud tonight became just the 17th player with a searchable game with 3 HR and 2 BB. He’s the first catcher in that group, and the first to post those totals against the Yankees. It’s the third year in a row with such a game; all but two have come since 1985.

Voomo Zanzibar
Voomo Zanzibar
4 years ago
Reply to  Doug

While that crime was being committed in The Bronx, Brandon Crawford enjoyed a balmy night at altitude and became the 23rd searchable player to have 5 hits and 8 RBI.
First ever by a shortstop.

And that has also been done in three consecutive years.
Mark Reynolds in 2018, and both Scooter Gennett and Anthony Rendon in 2017.

All 23 times it was done in victory.

Doug
Doug
4 years ago

In Tuesday’s Red Sox loss to Toronto, Xander Boegarts had three hits incl. a HR to become the 31st searchable player with an 8 game streak including a hit, a run and an RBI in each game. Boegarts becomes the first shortstop to accomplish the feat. The only other Red Sox player with such a streak is Ted Williams, with two streaks. Lou Gehrig with three streaks, incl. two in the space of 6 weeks in 1930, is the only other player with multiple streaks. Rudy York has the longest streak at 12 games in 1940. Joe DiMaggio had one… Read more »

Richard Chester
Richard Chester
4 years ago

Yesterday’s (7/16/2019) games broke a string of 4 consecutive days in which at least one team scored exactly 7 runs.

Richard Chester
Richard Chester
4 years ago

That should read “exactly 7 runs in one inning”.

Bob Eno (epm)
Bob Eno (epm)
4 years ago

Ah! That certainly makes your post of greater interest, Richard.

Richard Chester
Richard Chester
4 years ago
Reply to  Bob Eno (epm)

I’ve been trying to see if it is a record but I got bogged down in my search.

Bob Eno (epm)
Bob Eno (epm)
4 years ago

Just noticed that the D-Backs scored 7 runs in the first this evening, Richard. While you’re bogged down, a new record streak may be underway.

Bob Eno (epm)
Bob Eno (epm)
4 years ago
Reply to  Bob Eno (epm)

Well, the streak seemed destined, but the Nationals showed no self-restraint and scored 8 runs in the third last night, spoiling it for everyone.

Richard Chester
Richard Chester
4 years ago

With a little help from a friend of mine I found that there were at least 2 occasions of a 5 consecutive date stretch in which at least one team scored 7 runs in an inning, Sept. 24-28, 1984 and Sept. 4-8, 2000.

Bob Eno (epm)
Bob Eno (epm)
4 years ago

Well, congratulations on climbing out of the bog and back onto the blog, Richard. It’s always good to get by with a little help from your friends.

Voomo Zanzibar
Voomo Zanzibar
4 years ago

Matt Barnes has thrown 10 Wild Pitches in 38.1 innings. A Wild Pitch less than every 4 innings? Here’s who’s done it, listed by most innings pitched: 39.1 … Stu Flythe 38.1 … Barnes (2019) 33.1 … Fautino de los Santos 29.1 … Tony Balsamo 29.1 … Henry Rodriguez 28.0 … Jesse Biddle (2019) 27.2 … Billy Wagner 27.2 … Henry Rodriguez (again!) Barnes has been effective in his wildness, unlike most of the fellas on this list. He has struck out 41% of batters faced. Flythe, Fautino, and Balsamo were one-and-done rookies. Henry Rodriguez’ seasons were 2010 and 2012.… Read more »

Voomo Zanzibar
Voomo Zanzibar
4 years ago
Reply to  Voomo Zanzibar

I pointed out in an earlier post that Barnes’ teammate, Brandon Workman, is also managing to be wildly effective. Workman is still giving up twice as many Hits to Walks. That has been done just three time before in a season of 20+ innings, and never effectively: 42.1 … Workman 26.1 … Dibble 23.1 … Mickey McDermott 20.1 … Brad Pennington _________________________ Workman has an era of 1.7, and has given up 3.0 H/9 Most IP with less than 3.0 H/9: 42.1 … Workman (2019) 18.2 … Alex Young (2019 – a nice start to his time in the Show)… Read more »

Doug
Doug
4 years ago
Reply to  Voomo Zanzibar

Opponents’ batting average against Workman was .102 before his marathon 40+ pitch save on Wednesday. Was running on fumes at the end, but managed to close the deal.

Paul E
Paul E
4 years ago
Reply to  Doug

Sounds a bit like former NY Mets pitcher Anthony Young who managed an epic 3-30 W-L record in his age 26-27 seasons

Doug
Doug
4 years ago
Reply to  Paul E

Sanchez did *not* extend his streak against the Indians on Tuesday, getting an ND after the Blue Jays tied the game 1-1 in the 9th and won it in the 10th. Also broke another streak as it was Toronto’s first win of the season when trailing after 8 innings. Trevor Bauer went 7.2 scoreless IP, his 7th start of the year with 7 IP and 115 pitches; no other pitcher has more than 4 such games. Justin Smoak delivered the game-tying RBI with a 9th inning HR, and game-winning RBI in the 10th. He leads the majors, by a wide… Read more »

Aweb
Aweb
4 years ago
Reply to  Doug

Sanchez also ended a long streak of walking at least one in every start, which ends at 61. Considering he’s been terrible and had a lot of short starts, it was “impressive”.

Doug
Doug
4 years ago

In Thursday’s early action, Rafael Devers’ 3 run HR was the big blow as the Red Sox blanked the Blue Jays 5-0 behind Chris Sale, notching his first regular season home win in over a year. Devers raised his season RBI total against Toronto to 28, the most in the expansion era against one opponent in the first 100 games of the season.
28 – Rafael Devers 2019 (Blue Jays)
25 – Norm Cash 1961 (A’s), Juan Gonzalez 1998 (Royals)
24 – Jose Cruz 2002 (Rays)
23 – Justin Morneau 2007 (White Sox)

Bob Eno (epm)
Bob Eno (epm)
4 years ago
Reply to  Doug

Devers’ productivity against the Blue Jays is part of a very high run-scoring environment when these teams have played this year. Boston has won nine of the 14 games the two teams have played, and scored 96 runs in those games, or 6,9 R/G. But what is surprising in that the Jays, 5-9 against the BoSox, have themselves scored 92 runs, almost as many as Boston. Toronto’s run total against Boston is the third highest head-to-head total in the Majors. Only the Angels have scored more against any team than either Boston or Toronto: 106 vs. Seattle, also in 14… Read more »

Bob Eno (epm)
Bob Eno (epm)
4 years ago
Reply to  Bob Eno (epm)

Off track: Looking for unusual team head-to-head results along the lines of the Boston/Toronto match-up this year, I was thinking about past examples that might be interesting, and realized that undoubtedly one of the greatest is well known to almost every fan — certainly every fan of a certain age: the 1960 World Series. It’s often marveled that the powerhouse Yankees fell to the Pirates in seven games, despite having a 55-27 run advantage. What I recall was the sense of doom (as a NL fan) going into the seventh game. At that point the Series was all even, with… Read more »

Doug
Doug
4 years ago
Reply to  Bob Eno (epm)

The 1960 Pirates scored 37% of their runs for the 1960 series in game 7. Somewhat surprisingly, that is only the second largest proportion for a WS winner in a 7 game series. The largest is the 1985 Royals at 39.3%, but that was a very different series from 1960 with 6 low-scoring tight games and a blowout at the end.

Scary Tuna
Scary Tuna
4 years ago
Reply to  Bob Eno (epm)

Colorado holds a 6-3 edge over San Diego so far this season, having outscored the Padres 86-61. They will play each other ten more times this season.

Mike L
Mike L
4 years ago
Reply to  Doug

And tell me the ball didn’t look juiced in that game. At times it looked like they were hitting golfballs.

Mike L
Mike L
4 years ago
Reply to  Doug

That was Ruth’s final season, on the horrible (38-115!) Boston Braves (who brought him in to sell a few tickets). 3HR, 6RBI, and he retired a week later, going hitless in his last 13 at bats.

Voomo Zanzibar
Voomo Zanzibar
4 years ago
Reply to  Mike L

Did you see the John Goodman starred biography movie?
In that mess, Ruth bats right-handed and retires on the field after the third home run in that game.

Mike L
Mike L
4 years ago
Reply to  Voomo Zanzibar

Accurate in every description!

Bob Eno (epm)
Bob Eno (epm)
4 years ago
Reply to  Voomo Zanzibar

Too bad they took Ruth out of the game in the middle of the 7th inning — he had one sure PA left and could have made his last hurrah even more hurrahful. Even with his early departure that day he had time to hit an RBI single amidst his three dingers. (Of course, Boston lost anyway: that’s about all they did in 1935 — worst NL team record since the Cleveland Outcasts.) The movie was awful, but the temptation to rewrite the end of Ruth’s career must have been irresistible. When I was young, I knew an older guy… Read more »

Richard Chester
Richard Chester
4 years ago
Reply to  Bob Eno (epm)

I remember reading somewhere that Ruth wanted to retire after that game but Braves’ owner Judge Fuchs promised other NL team owners that Ruth would play at their parks in a scheduled Braves’ game and convinced Ruth to not retire. Ruth was then released several days later.

Mike L
Mike L
4 years ago

interesting if true. Ruth played 3 against Cincy (the first of which was his 2,500th game, then two against Philly. He hadn’t played either team before.

Doug
Doug
4 years ago
Reply to  Mike L

Ruth had played once before against the Phillies earlier in the season, and also once in the 1915 WS.

Doug
Doug
4 years ago
Reply to  Bob Eno (epm)

Ruth actually played just one complete game in his final season; it was in Cincinnati the day after his three homer game in Pittsburgh.

Richard Chester
Richard Chester
4 years ago
Reply to  Bob Eno (epm)

And Ruth’s 6 HR that year was second most for the Braves.

Bob Eno (epm)
Bob Eno (epm)
4 years ago
Reply to  Bob Eno (epm)

The 1935 Braves are an enigma to me. The team had been terrible in the ’20s — six seasons under .400 — and then Fuchs (who had managed himself in ’29) brought on Bill McKechnie. Within three years, McKechnie had the team on a string of seasons at .500 or better (1932-34), and he added another in ’37. But in 1935, with pretty much the same team as the year before, the Braves went 38-115 (.248) — only the 1916 A’s were worse in the post-1900 period (and those A’s were really poor by design, after Mack had broken up… Read more »

Doug
Doug
4 years ago
Reply to  Bob Eno (epm)

Seems that their pitchers fared a lot worse in ’35 than ’34. The Braves top 6 pitchers recorded almost identical innings totals in the two seasons, but very different ERAs of 3.80 and 4.78, while the league ERA moved only slightly, from 4.06 to 4.02. In 1934, only one of the top 6 had an ERA over 4.50, while only one had an ERA under that mark in 1935. Here are the comparisons for individual pitchers, showing IP and ERA for the two seasons. – Ed Brandt: 255/3.53, 174.2/5.00 – Fred Frankhouse: 233.2/3.20, 230.2/4.76 – Huck Betts: 213/4.06, 159.2/5.47 –… Read more »

Bob Eno (epm)
Bob Eno (epm)
4 years ago
Reply to  Doug

I think that’s part of the story, Doug, especially the pitching, but there are two really odd features about that story: 1) most of the pitchers who tanked in ’35 recovered in ’36, and 2) “the normal expectation is to start seeing year-over-year declines” doesn’t jibe with a team dropping 40 games in the standings, from a 4th-place, .517 team to an all-time league worst record. On (1), here are the pitchers you listed with their 1936 records added: – Ed Brandt: 255/3.53, 174.2/5.00, [234.0/3.50] – Fred Frankhouse: 233.2/3.20, 230.2/4.76, [234.1/3.65] – Huck Betts: 213/4.06, 159.2/5.47, — – Ben Cantwell:… Read more »

Doug
Doug
4 years ago
Reply to  Bob Eno (epm)

I called it “luck” for want of a better term. Here is how the teams did in different run differences.
1 run – 23-16, 7-31
2 runs – 17-13, 11-28
3 runs – 13-15, 3-16
4 runs – 7-8, 4-9
5+ runs – 18-21, 13-31

Seems to me there must been quite a change in good fortune to go from 53-44 to 21-75 in games decided by 3 runs or less.

Bob Eno (epm)
Bob Eno (epm)
4 years ago
Reply to  Doug

Doug, The cause of the change from 53-44 to 21-75 in low margin games looks less mysterious when you add that the record in high scoring games went from 25-29 to 17-40. I annoy everyone with my harping on “luck.” But I haven’t for a few months, so I’ll refresh the effect. Using “luck” or “fortune” suggests that there was a cause, but it was a force (traditionally female) operating in the world outside human control. Saying the outcome was “random” suggests there was no cause — well, to be fair, which I’m not, it suggests no consistent cause. In… Read more »

Richard Chester
Richard Chester
4 years ago
Reply to  Bob Eno (epm)

In 1935 Berger drove in 22.61% of the Braves’ runs. Only Nate Colbert of the 1972 Padres has more, 22.75%.

Bob Eno (epm)
Bob Eno (epm)
4 years ago

Glad you searched that, Richard. I was wondering whether it was a record and didn’t know how to find out.

Bob Eno (epm)
Bob Eno (epm)
4 years ago
Reply to  Bob Eno (epm)

Actually, now that I think of it, the record I was wondering about was percent of team runs represented by a player’s R+RBI-HR. Berger’s percent was something like 32.5%.

Richard Chester
Richard Chester
4 years ago
Reply to  Bob Eno (epm)

I retrieved that information from “The Baseball Maniac’s Almanac”.

Bob Eno (epm)
Bob Eno (epm)
4 years ago

I just ordered “The Baseball Maniac’s Almanac,” Richard. I fear you may be having a questionable effect on my character.

Richard Chester
Richard Chester
4 years ago
Reply to  Bob Eno (epm)

It must be for the better. I see the 5th edition is now available, I’ll have to consider buying it.

Voomo Zanzibar
Voomo Zanzibar
4 years ago

K.C. and Cleveland played a 14-inning game last night… with 13 total strikeouts.
Notable in this era.

10.1 innings from the starters with one K.

The teams went 2-26 with RISP (but only 4 SO)

Those 13 punchouts were achieved by 11 different Pitchers.

https://www.baseball-reference.com/boxes/KCA/KCA201907250.shtml

Doug
Doug
4 years ago
Reply to  Voomo Zanzibar

Both teams recording strikeouts of one half or less of IP. No of games by season:
2019 – 4
2018 – 8
2017 – 12
2016 – 24
2015 – 36
2014 – 27
2013 – 35
2012 – 33
2011 – 61
2010 – 72
2009 – 65
2008 – 93
2007 – 119
2006 – 108
2005 – 128

Paul E
Paul E
4 years ago

Betts (Mookie, not Dickie) homered thrice last evening for the 5th time in his short career. The career record is only 6 and, apparently, he’s got plenty of time left to make that record his own

Doug
Doug
4 years ago

Some of you will be aware that in their game on Thursday, the Orioles took a 10-8 lead against the Angels with two runs in the 16th inning, then used outfielder Stevie Wilkerson to pitch the bottom of the inning. Wilkerson retired the side in order, despite delivering no pitches that reached 60 mph. He is the first position player to collect a save since it became an official statistic in 1969. Before 1969, the last position player to pitch in a save situation and finish the game preserving the lead was Gil Torres of the Senators in the second… Read more »

Doug
Doug
4 years ago

Three straight Red Sox wins over the Yankees, each scoring 9+ runs. It happened in 1977 and 2013, and now in 2019. But there was also a streak of 4 such games in 1912, which Boston will try to match on Sunday.

What’s notable, of course, about 1912, 1977 and 2013 is that the Yankees or the Red Sox were WS champions in each of those seasons.

Voomo Zanzibar
Voomo Zanzibar
4 years ago

Kyle Schwarber yesterday became the 3rd batter to have this boxscore line;

3-4-3-7

https://www.baseball-reference.com/boxes/MIL/MIL201907280.shtml
_____________________________________

The other two were Shane Victorino:

https://www.baseball-reference.com/boxes/BOS/BOS201308270.shtml
_____________________________________

And Bobby Higginson:

https://www.baseball-reference.com/boxes/DET/DET199706300.shtml

Doug
Doug
4 years ago

Brad Keller is a young (age 24) right-hander in his second season in the Royals’ rotation. Until tonight (Monday), he led all starters over the last two seasons in HR/9 (but, with 3 HR allowed to Toronto on Monday, he’s now slipped slightly behind Jacob deGrom). In two starts against the Blue Jays this season, Keller has allowed 5 HR, but only 8 HR in his other 21 starts. With a good finish to the season, Keller could move past Bret Saberhagen for the best ERA+ by a Royals starter over his first two seasons.

Voomo Zanzibar
Voomo Zanzibar
4 years ago

Checking in a the Home Run Derby participants.
Did the Derby wreck them?
Here’s how they’ve fared since the break:

.294 / .377 / .485 / .862 … Acuna
.280 / .345 / .500 / .845 … Matt Chapman
.220 / .394 / .440 / .834 … Alex Bregman
.295 / .368 / .443 / .810 … Vlad Jr.
.196 / .318 / .429 / .747 … Carlos Santana
.220 / .304 / .420 / .724 … Joc
.118 / .313 / .353 / .666 … Pete Alonso
.170 / .290 / .226 / .517 … Josh Bell

Voomo Zanzibar
Voomo Zanzibar
4 years ago

Hyun-Jin Ryu has now started 21 games this season.
He has given up more than 2 earned runs just once.
Took his obligatory lumps in Denver.

18 Quality Starts
One where he was pulled after 5.2
The mile high debacle.
And one game where he left in the 2nd with a groin strain.

His record is 11-2.
Could easily be 18-2.

Voomo Zanzibar
Voomo Zanzibar
4 years ago

Not sure what the Naps were thinking in trading Bauer.

Here’s the production of their current corner outfielders, Luplow and Naquin, vs their replacements, Puig and Reyes:

.265 / .346 / .508 / .855 / 119
.292 / .324 / .500 / .824 / 111

.252 / .302 / .475 / .777 / 96
.255 / .314 / .536 / .849 / 121

That and Reyes as rated poorly on defense.
And these guys now have to learn a new league/parks/pitchers on the fly.

CursedClevelander
CursedClevelander
4 years ago
Reply to  Voomo Zanzibar

Luplow’s a pure platoon guy – he’s shown no ability to hit righties so far. Naquin has been riding a very hot bat lately – I’d like to think he’s bouncing back to the potential he flashed in his rookie year, but his BABIP for the month is sky high. He’s shown legitimate growth defensively, though. Reyes is definitely a DH, but he’s young and his power is off the charts – he’s a potential 40-50 HR guy and he’s under team control for a long time. Puig obviously isn’t as good, but he’s likely going to be taking PAs… Read more »

Voomo Zanzibar
Voomo Zanzibar
4 years ago

Well, that all makes sense.
Seems like a move for the future, while playing lip service to the notion of advancing this year.
If Im Cleveland, facing NYY or HOU in the playoffs, Id rather have Bauer than a slight uptick in corner outfielder offense.

Yeah, they’ve got arms, but those guys are young and inexperienced.
Bauer has 6 career playoff starts and excellent numbers against both Ny and Hou.

Voomo Zanzibar
Voomo Zanzibar
4 years ago
Reply to  Doug

There’s really no comparison.
Bauer is a competitor who cares so much about winning and losing that it hurts.
Puig seems like he might literally murder another human being on the field someday.