2019 Award Elections – AL CYA

Greetings, HHS folks! Dr. Doom here again with another awards voting post. I’ve done these for the last two seasons, so I’m continuing the tradition in 2019. For the next award, we switch leagues and awards as we vote on the AL Cy Young. As it turns out, everything’s coming up Astros! More after the jump.

Our first contender is perpetual Cy Young candidate Justin Verlander. With one CYA already and three second-place finishes, Verlander attempts to avoid “bridesmaid” status again, but the competition is thick. A good way to get traction is to be durable – and Verlander led the league by any count in durability, starting the most games, pitching the most innings, and winning the most games. But none of that matters if you’re not effective. Verlander was second in the league with a 179 ERA+, and led the league with 7.8 WAR, a 7.14 SO:BB ratio, and a miniscule 0.803 WHIP. Oh – and for good measure, Verlander struck out 300 opposing batters, and logged a third career no-hit game! Only a susceptibility to homers (a career-high 1.5 per nine and worst among serious award contenders) damages Verlander’s credentials.

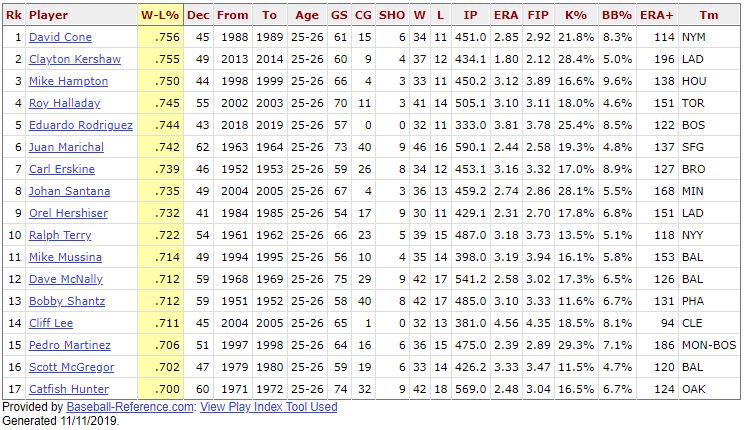
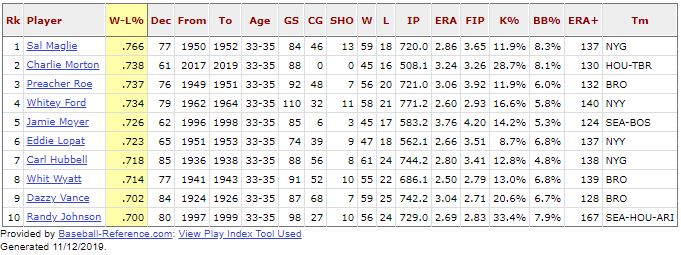
If there’s a competitor to Verlander, it’s his teammate, Gerrit Cole. Cole is a former #1 overall draft pick who never seemed to live up to that billing… until he came to Houston. He posted a blistering 13.8 SO per nine this year – a new MLB record, topping Randy Johnson‘s 13.4 in 2001! Cole’s 326 K’s led the majors, making he and Verlander the second-ever teammates to whiff 300 (the first, naturally, were Johnson and Curt Schilling, in 2002). Cole had the best FIP (2.64) and ERA (2.50) in the AL, and the best ERA+ (185) in all of baseball. Had Cole won one more game, he would’ve tied his teammate and recorded the very rare “pitching Triple Crown”; as it was, he and Verlander became the first teammates to win 20 games since Johnson and Schilling, and Derek Lowe and Pedro Martinez, both in the 2002 season. Finally, Cole notably became the first searchable pitcher to finish a season with 16 straight winning decisions as a starter, a streak he continued for three more games in the post-season.

While sorting out those two might be tough, you do have three more spots to fill, so let’s look at some other contenders. Lance Lynn of the Rangers managed to avoid homers in a notoriously homer-prone home park, to the tune of less than one per nine innings, helping him to a career best 141 ERA+ and 3rd ranked 7.6 WAR. Lynn’s FIP (3.13) was even better than his ERA (3.67), as he posted a creditable 16-11 record for a sub-.500 Rangers team. Leading the league in WAR (tied with Verlander) was Lynn’s teammate Mike Minor who, oddly enough, pitched the EXACT same number of innings as Lynn, and posted a similar 14-10 record to go with a 144 ERA+ that tied for 4th in the AL with the Indians’ Shane Bieber. Bieber ably filled the void in Cleveland created by Trevor Bauer‘s departure and Corey Kluber‘s lengthy injury layoff, leading the majors in CG (3) and shutouts (2), while placing 2nd in IP (214⅓) and 3rd in strikeouts (259). In Tampa, new hire Charlie Morton became this season’s Blake Snell, taking the role of staff ace in place of the defending CYA champ who lost time to injury and struggled to find his form of a year ago. Morton allowed homers at the lowest rate of any pitcher – less than 0.7 per nine, leading to a 2nd ranked FIP (2.81) and third best ERA (3.05).

There are some other interesting pitchers to look at: Lucas Giolito (1st in shutouts, 5th in ERA, 6th in WAR) of the ChiSox; and Eduardo Rodriguez (1st in starts, 3rd in wins, 5th in WAR) of the BoSox, to name two. In Minnesota, Jose Berrios was so hot at the beginning of the season (8-2, 3.01 over his first 14 starts) that it seemed he might make it into the conversation, but a rougher second half doomed him to down-ballot consideration.

So who’s it going to be? Which stud from the AL champion Astros will you take? Or, were one of the Rangers’ top two more valuable to a struggling team, and deserving of CYA recognition? Who’s going to slide in at the bottom of your ballot? Let us know by voting in the comments section below!

Also, apropos of nothing, here’s a fun fact: 19 different pitchers in the overhand pitching era have had a season of 300+ strikeouts. FIVE of them (J.R. Richard, Mike Scott, Nolan Ryan, Cole, and Verlander) did so as Astros. No other franchise has had more than two such pitchers. Must be something in the air.

Rules: Vote by making a comment below and numbering your choices with 1 being the MOST preferred candidate, and 5 being your LEAST preferred candidate of your five choices. Your ballots will be EXACTLY five places, just as the BBWAA does. You must vote for 5 players. Scoring will be 7-4-3-2-1, just as the BBWAA does. You are not required to vote in all elections; only vote in the ones you would like to vote in. You may make vote changes, if the discussion so moves you. If you change your vote, please do so in a new comment, not as a reply to your original comment (it’s a lot easier to find new comments than replies to old ones). Please don’t vote strategically; we’re trying to get the best result, not to manipulate the vote totals based on what others have done. Voting will remain open about one week. When players are tied, tiebreakers go as follows: first tiebreaker is number of ballots on which players were named; second tiebreaker is highest placement on a ballot; third tiebreaker is the first player to be named (as this usually only happens when a bunch of players are tied for last). Results will be posted when balloting closes.

0 0 votes
Article Rating
Subscribe
Notify of
guest

46 Comments
Oldest
Newest Most Voted
Inline Feedbacks
View all comments
Scary Tuna
Scary Tuna
4 years ago

1. Cole
2. Verlander
3. Morton
4. Giolito
5. Bieber

Doug
Doug
4 years ago

Eduardo Rodriguez’s .744 W-L% over his past two seasons is 5th best in the live ball era in 40+ decisions aged 25-26. These are the 17 pitchers with a .700 record at that age.

Mike L
Mike L
4 years ago
Reply to  Doug

For exactly 20 regular season IP of Andrew Miller, and 7.1 playoff IP, the Orioles gave up Eduardo Rodriquez. He did manage 1 WAR in those 20 IP and gave up just one hit and one walk in the playoffs, but you’d have to think the Orioles would like that one back.

Doug
Doug
4 years ago
Reply to  Mike L

It’s actually quite a list. Not a dud in sight. The median career WAR of the group is Cliff Lee at 42.8. Rodriguez has already passed Terry in career WAR and, with a similar season next year, will pass Erskine and possibly McGregor and Hampton.

Bob Eno (epm)
Bob Eno (epm)
4 years ago
Reply to  Doug

Well, it is a list of good pitchers (not sure McGregor, at career 98 OPS+ really qualifies there, Shantz’s story is complicated), and in that sense it may prove its own worth as diagnostic of future success, but I’m not sure whether W-L is a particularly useful tool here if our interest is the quality of age 25-26 seasons. Cliff Lee had a fine career, but these two .711 W-L seasons were mediocre, judging by ERA, ERA+, FIP, and IP (his age 25 season included a 5.43 ERA, 80 OPS+, but a 14-8 record). Rodriguez ranks as a good-not-yet-great young… Read more »

Doug
Doug
4 years ago
Reply to  Bob Eno (epm)

Agreed it’s more of a mixed bag at the bottom of the list. But, all of the pitchers have name recognition for pitching well for a good chunk of their careers.

I was kind of expecting to see a pitcher or two who is long forgotten and who happened to luck out with a couple of high W-L% seasons. But, on reflection, while lightning may strike twice, it’s pretty unlikely to happen in consecutive seasons.

Paul E
Paul E
4 years ago
Reply to  Doug

Doug,
Eduardo must be pitching to the score 🙁
I believe I may have already copied and pasted it, but Charlie Morton is actually 2nd in W-L% from age 33-35 among those with 60 + decisions in the live ball era. Sal Maglie is first

koma
koma
4 years ago

1. Verlander
2. Cole
3. Lynn
4. Morton
5. Bieber

Dr. Doom
Dr. Doom
4 years ago

Let’s close the polls at 11:59:59 PM on Monday the 18th. Thanks, and happy voting!

Paul E
Paul E
4 years ago

1) Cole
2) Verlander
3) Morton
4) Bieber
5) Rodriguez

Paul E
Paul E
4 years ago
Reply to  Doug

Doug,
Re “Cole and Verlander both appear in 15 of the 18 top 5’s”, the sum total of the 15 “Top 5” appearances for Cole would be 34 and 35 for Verlander. It’s that close

Bob Eno (epm)
Bob Eno (epm)
4 years ago

Here are main stats I used to think about this vote: ……………………WAR……….IP………….WAR/162…………ERA+ Bieber………….5.0………214…………….3.8………………..144 Cole……………..6.9………212…………….6.9………………..185 Giolito………….5.6………177…………….5.1………………..134 Lynn…………….7.6………208…………….5.9………………..141 Minor…………..7.8………208…………….6.1………………..144 Morton………..5.1………195…………….4.2………………..146 Rodriguez……6.0……….203……………4.8…………………126 Verlander……7.8……….223……………5.7…………………179 On Verlander vs. Cole, I began with a predisposition towards Cole because of his tremendous second half, and because there’s something nice about a break-out pitcher. The two are, as others have noted, amazingly close on many calculations, and where they’re not, there are trade-offs: e.g., Verlander’s significantly better in H/9 and Cole is significantly better in HR/9 (and, of course, in the figures above the trade is over WAR and WAR/162). I wound up tipped towards Verlander for an… Read more »

Doug
Doug
4 years ago
Reply to  Bob Eno (epm)

I was also looking for something to tip the decision one way or the other. One of these is high quality starts (6 IP, 2 ER or less).
24 – Cole
20 – Verlander, Bieber
17 – Lynn
16 – Morton, Gonzales, Berrios
15 – Tanaka, Rodriguez, Fiers
14 – Minor, Giolito

To your point, it’s easier to mow down a dispirited opponent, which could account for a good chunk of Cole’s lead over Verlander.

Surprising to see the WAR leader Minor so far down the list.

Bob Eno (epm)
Bob Eno (epm)
4 years ago
Reply to  Doug

Doug, I had Minor in third, after Verlander and Cole. I think Verlander is the fractional WAR leader, no? He’s listed first on the leaderboard. but neither one seems to have the black ink. The reason I put Cole over Minor is that Cole pummels Minor on ERA+, and I balance those two types of stats when I’m doing shortcut calculations like this. I’m sure Minor’s bWAR stat works out, but it is super-reliant on strength-of-schedule calculations, and eyeballing his game log I just don’t see it, so I’m a little uncomfortable with pairing a 7.8 WAR and a 144… Read more »

Doug
Doug
4 years ago
Reply to  Bob Eno (epm)

Not questioning your numbers. Just remarking that I too was looking for something to tip the Cole/Verlander decision. You decided on run support, accurately reasoning that Verlander had to work harder in his starts. I was leaning towards “how reliable is the starter in giving his team an excellent chance to win?” to which purpose I went with the “6 IP, 2 ER or less” test in which Cole shines and he, Verlander and Bieber seem to have a leg up on the rest of the field. Not saying one way is better than another, just that we both found… Read more »

Bob Eno (epm)
Bob Eno (epm)
4 years ago
Reply to  Doug

Yeah. I saw your major argument and agree it could cut either way. It was the Minor point I was quibbling with.

Scary Tuna
Scary Tuna
4 years ago
Reply to  Bob Eno (epm)

I took it that Doug was referring to the list in his own post of leaders in high quality starts (6 IP, 2 ER or less) and that he found it surprising to see Minor tied for 11th place with just 14 such starts, yet the AL co-leader in pitching WAR.

If that was a correct understanding, then I agree: it is surprising to see a WAR leader trailing so many others in high quality starts.

Scary Tuna
Scary Tuna
4 years ago
Reply to  Bob Eno (epm)

…and I totally missed your play on words, Bob, until after I posted my reply. Nice.

Bob Eno (epm)
Bob Eno (epm)
4 years ago
Reply to  Scary Tuna

You clearly read Doug better than I, Scary. We were writing to cross purposes and you’ve untangled us.

But the solution to the quandary of how low key Minor’s starts were lies in the WAR factor that boosted him: strong opponents. Assuming B-R is right about that, he racked up value in starts where >2 earned runs still counted for “high quality.”

Dr. Doom
Dr. Doom
4 years ago

I have a few things to say: First of all, the actual results of voting are in. Personally, I believe our electorate to be better than the BBWAA’s, so I’m still excited to see how ours comes out. Second of all, I’m sorry I’ve been absent for a couple of days. I was at a conference in the woods with no internet, so I’m back for the discussion now. Third and finally, I’ve seen some discussion here about pitching WAR, particularly baseball-reference flavor. There is a FABULOUS twelve-part series that Bill James wrote last year in February and March on… Read more »

Paul E
Paul E
4 years ago
Reply to  Dr. Doom

Doom, Funny that you mention “double-counting”. Somehow I suspect b-r double counts fielder’s position at the plate and the field. If you’re a SS fielding really well and batting 8th with a 95 OPS+, are you contributing more than an iron-gloved 1B who bats third with a 160 OPS+? Athletes “play” positions in the field on defense – all of which are of varying relative importance. Are not the batting order positions what differentiates “hitters” and their relative importance? You know, Pete Alonso, when he bats fourth, is a clean-up hitter – not a first baseman. And Ahmed Rosario, when… Read more »

Dr. Doom
Dr. Doom
4 years ago
Reply to  Paul E

B-ref specifically does NOT double-count fielding position on their WAR. oWAR counts position + offense; dWAR counts position + defense. WAR is NOT equal to oWAR+dWAR; in fact, WAR=oWAR+dWAR-position. If you really wanted a “pure” oWAR, you can find it by just looking at Rbat and dividing by the Runs:Wins ratio. For Pete Alonso, for example, his Runs:Wins ratio this year was 10.8:1. He had a 47 Rbat. You have to add that to Rrep, which is the difference between AVERAGE and REPLACEMENT. So that means his offensive WAR would be (47+22)/10.8, or 6.4 (4.3888, really). That’s his oWAR, if… Read more »

Bob Eno (epm)
Bob Eno (epm)
4 years ago
Reply to  Dr. Doom

Doom, I’m not picking up the specifics of the argument on pitching bWAR, but it seems to me I recall that the speculation was that the double counting occurred when park effects and defense were combined: that park effects impacted defense, but was also being counted separately. I was anxious for this to be the case because of a debate you and I had once had about Mordecai Brown and the CoG. Although my argument may have prevailed, I felt I’d lost the debate, and the double-effect effect promised to make me a winner in retrospect (I guess I’d be… Read more »

Dr. Doom
Dr. Doom
4 years ago
Reply to  Bob Eno (epm)

Well, honestly, I think the biggest thing about Mordecai Brown for me is that I see him as a pretty clear HOF pitcher, but not necessarily COG, particularly given the MANY pitchers already enshrined from that period, and my preference for people to be elected from more modern-day periods, particularly when compared to players from the segregated era. But that’s neither here nor there. The bigger thing is that Baseball-Reference has anomalies in who it considers the best pitcher of certain years. For instance, take this season, and Mike Minor, as I stated above. In <a href="https://www.billjamesonline.com/the_early_cy_young_seasons/?AuthorId=3&pg=8"this article from the… Read more »

Bob Eno (epm)
Bob Eno (epm)
4 years ago
Reply to  Dr. Doom

Doom, On this one, I’m not going to have the chance to pursue the James series and your detailed points about B-R now, but I’d like to respond to your final paragraph. One of the things I find dispiriting is to have an argument refuted by misreading. You write: “Again, you want to say Mike Minor was the best pitcher in MLB, fine with me. I just don’t see any way that’s true.” Having taken some time to explain why I did not want to say what you say I said, I can’t understand why you’d make me a straw… Read more »

Dr. Doom
Dr. Doom
4 years ago

My own vote: 1. Gerrit Cole – Incredible finish. FIP loves him, ERA loves him, Strikeouts love him. He was great, and he’s gonna get PAID. On a win-loss scale, I have Cole’s performance as representative of an 18.0-5.6 record; Verlander at 17.7-7.1. With more decisions but fewer wins for Verlander, that makes Cole an easy choice at #1. 2. Justin Verlander – FIP absolutely hates Verlander, simply because of the homers. If you think the homers were a weird fluke – it wasn’t his pitching, but rather just bad luck – then he tops Cole. (There’s evidence to support… Read more »

Bob Eno (epm)
Bob Eno (epm)
4 years ago
Reply to  Dr. Doom

No matter how you slice it, it’s a tossup between Cole and Verlander, so I don’t want to argue that point. But I do want to point out what I see as a weakness in FIP. You accurately point out that FIP sees a vast difference between Cole and Verlander because of HR/9 — obviously key for a TTO-based metric. (Cole’s K-rate was ~15% better, Verlander’s BB-rate was ~15% better; on ERA they are nearly identical, Cole with a ~3% edge.) But what FIP ignores, because it involves BIP, is that Verlander had the fifth best H/9 record among qualifiers… Read more »

Dr. Doom
Dr. Doom
4 years ago
Reply to  Bob Eno (epm)

One point: “the defense was constant for Cole and Verlander.” Well, the OFFENSE was constant for Cole and Verlander. I mean, if the defense was, so was the offense, right? Yet, there’s nearly a two-run difference in support. Thank goodness that’s fiction, since they pitched in front offense. Thing is, we can’t assume that the defenses played the same, even if the same players were there. Yes, defense is more consistent than offense… but to assume that they were identical, or that any differences MUST’VE resulted from something the pitcher was doing, strikes me as an extremely similar argument to… Read more »

Bob Eno (epm)
Bob Eno (epm)
4 years ago
Reply to  Dr. Doom

Doom, We’re on the same page as to the outcome: I think there’s plenty of reason to vote for Cole over Verlander and no injustice would be involved; I just came out tipped the other way. To respond to your specific points: It seems to me that the offense of teams is not constant largely because it faces different pitchers every day. This doesn’t apply to defense. The difference in defensive performance behind Verlander and Cole may be because the fielders simply played their best behind Verlander and not Cole. But rather than attribute the outcome to eight identical players… Read more »

Dr. Doom
Dr. Doom
4 years ago
Reply to  Bob Eno (epm)

As for offensive variation, a 1.66 run differential means that Houston was facing not just BETTER pitchers every day Cole pitched, but that the difference in pitchers was basically that Cole was facing All-Stars and Verlander replacement-level pitchers EVERY START. I find it utterly inconceivable for that to have been true. Second of all, it is not at all self-evident that pitchers have some control over BABIP. Well, I shouldn’t say that – “somewhat” responsible is certainly true. But the extent to which it’s relevant is where I’m somewhat dubious. Over and over again, we’ve seen that pitchers aren’t really… Read more »

Bob Eno (epm)
Bob Eno (epm)
4 years ago
Reply to  Dr. Doom

Doom, A detail first: in your first paragraph, I think you’ve reversed Cole and Verlander. (It doesn’t affect your basic argument.) Now substance: The point I’m making does not involve an All-Star/Replacement-Level contrast. The Astros scored an almost-league-average number of runs for Verlander (4.9) and an exceptionally high number of runs for Cole (6.7), including 11 runs or more seven times. Given Houston’s overall R/G of 5.7, pitching opponents against the pair certainly pitched like a set of above average and replacement level pitchers. As I understand your argument, the explanation does not lie in daily changes in opposition pitching,… Read more »

Bob Eno (epm)
Bob Eno (epm)
4 years ago
Reply to  Dr. Doom

By the way, I don’t recall anyone 40 or 50 years ago making the arguments about differential offensive support that you refer to. (I do recall something like that in the case of Nolan Ryan, whose huge number of Ks and BBs were said to leave his fielders tired and impatient.) They would not, of course, have been good arguments. I hope the arguments I’m making are not of that quality.

Richard Chester
Richard Chester
4 years ago

1. Verlander
2. Cole
3. Morton
4. Bieber
5. Minor

Paul E
Paul E
4 years ago

Jacob deGrom’s ERA+ of 188 for his age 30-31 Cy Young award winning seasons is 4th in the live ball era amongst pitchers with 300 IP. His 21 wins are 357th.

Dr. Doom
Dr. Doom
4 years ago
Reply to  Paul E

You didn’t ask this as a trivia question. I chose to interpret it as such.

Lefty Grove (1930-31), 200
Pedro Martinez (2002-303), 206
????Sandy Koufax (1966), 190????

Koufax meets the innings threshold, though it’s only one season. Was he the third? I manually searched, and I got the first two right away (first two guesses). Then I went through like 10 other pitchers before the thought crossed my mind, “Maybe Koufax made 300 innings in his last year!” Not a P-I subscriber, so I’m not sure if that’s who you’re thinking of. Lofty, lofty company, either way.

Paul E
Paul E
4 years ago
Reply to  Dr. Doom

Doom, No trivia – just an observation and, IMO, an indication of how the voters are dependent on the new metrics….yes, Koufax is the third despite retiring. I was going to use 324 IP (2 x 162), however, by just a quirk used 300 IP and Koufax, in hindsight, would have missed at a mere 323 IP in his age 30 season. I did use 22 wins as the cutoff and, yes, 356 hurlers over the last 100 seasons have managed to win 22 or more games in their age 30 and 31 seasons combined. As far as being without… Read more »

Richard Chester
Richard Chester
4 years ago
Reply to  Paul E

If you play your cards right you could go down the entire list on the PI, 10 names at a time.

Paul E
Paul E
4 years ago

Richard,
Yes…..framed within the old “greater than or equal to this” and “less than or equal to that”

Doug
Doug
4 years ago

1. Cole
2. Verlander
3. Morton
4. Bieber
5. Minor

Doug
Doug
4 years ago

With Verlander and Cole, and Minor and Lynn, the AL has two teams with a pair of 6 WAR pitchers (as measured by B-R). Doesn’t happen that often.
AL – 2019, 2007, 2002, 1993, 1929, 1920, 1913, 1903
NL – 2009 (3 teams), 2003, 1977, 1975, 1969 (3 teams), 1967, 1901

bells
bells
4 years ago

Nice to read the discussion here, I don’t post much but always catch up on all the comments, although rarely with the conflation of being timely enough to be relevant and also feeling like I have something of value to add. But I can always vote! As has been outlined nicely here in a number of ways, there’s a hairsbreadth between Cole and Verlander in terms of the statistical quality of their season. I am a stats guy, through and through, but I also tend to think that all things being so even from most statistical perspectives, narrative serves as… Read more »

Dr. Doom
Dr. Doom
4 years ago

FYI, I’m away right now. We’ll keep the polls open until 11:59:59 on TUESDAY night. Sorry for the inconvenience, and thanks for voting!

Dr. Doom
Dr. Doom
4 years ago

Here are the (very late) results! As always, presented as such: Name, Vote points (first place votes) Here are your AL Cy Young vote recipients: 1. Gerrit Cole, 47 (5) 2. Justin Verlander, 41 (3) 3. Charlie Morton, 19 4. Shane Bieber, 11 5. Lance Lynn, 8 6. Mike Minor, 5 7. Lucas Giolito, 4 8. Eduardo Rodriguez, 1 Cole and Verlander, unsurprisingly, were 1-2 on every ballot. Not much else to say here that hasn’t already been said in the commentary, so I’ll shut up about it. As always, I like to see who was closest to a “consensus”… Read more »

Paul E
Paul E
4 years ago
Reply to  Dr. Doom

Doom,
ehhhh-hemmm. I believe your’s truly named the first four in order as well. Looks like Doug and I will have to share that carton of rotten grapefruit. However, it appears that Doug wins the tiebreaker (and the carton of rotten grapefruit) with Minor finishing 6th and my pick for 5th, Eddie Rodz, finishing 8th. So much for pitching to the score……