We all know 2017 saw an all-time high in home runs hit, but here are a couple of graphs that show just how staggering the power change has been over the course of MLB history. Continue reading
Everybody hits 20 homers
10 Replies

We all know 2017 saw an all-time high in home runs hit, but here are a couple of graphs that show just how staggering the power change has been over the course of MLB history. Continue reading
That NL wild card game was a doozy.
There are just SO many stats from unusual things that happened. See below for a long list. Continue reading
In addition to keeping High Heat Stats up and running, some of us are also contributing content at Hero Habit (http://www.herohabit.com/) now. You can find articles simillar to the ones that get posted here over on that site, such as an article by Ely about Scott Boras and the Nationals or a series of posts of some of my favorite baseball cards. Please check out the site and feel free to comment!
On August 31 of this past season, the Rockies’ Stephen Cardullo homered in both ends of a doubleheader AND it was his birthday. He’s just the 4th guy to accomplish this feat since 1913, and there’s a good chance nobody else did it before then.
Players to HR in both ends of a double header on their birthday since 1913:
Stephen Cardullo 8/31/2016
Tony Perez 5/14/1972
Joe Rudi 9/7/1970
Eddie Joost 6/5/1949
Double headers are so rare right now (the Rockies/Dodgers one this year was likely because of a rainout on a Tuesday as both games were played on a Wednesday) that it seems pretty unlikely anybody will ever again achieve this–although I would have said the same before this season 🙂
Mookie Betts had a 2016 for the ages. Since 1901, here are the only guys to post 29+ fielding runs and 29+ batting runs. As with Mookie this year, most of these guys didn’t win their league MVP award.
Rk          Player Year Rbat Rfield Age  Tm     Pos
1     Mookie Betts 2016 29.8   32.0  23 BOS    *9/H
2      Chase Utley 2008 30.0   31.0  29 PHI    *4/3
3    Albert Pujols 2007 51.3   31.0  27 STL    *3/H
4      Scott Rolen 2004 40.2   30.0  29 STL      *5
5    Ichiro Suzuki 2004 35.7   30.0  30 SEA   *9/DH
6      Ken Griffey 1996 39.8   32.3  26 SEA    *8/D
7        Al Kaline 1961 39.3   29.2  26 DET *98/H75
Go ahead, post a comment here just to prove that you can!
I’ve been quite busy with my day job and unable to pay any attention to things here. Doug has done a good job of keeping me apprised and nudging me periodically to get things fixed. It appears something got corrupted in the old theme, and so switching over to a different theme has resolved the issue. I’m going to make some minimal changes to this new theme to make it prettier but do as little as possible to help ensure that it stays running smoothly and quickly.
Apologies for all the downtime.
Here’s a relatively simple plot showing the percentage of all 18,690 MLB players in history to hit “X” home runs. In other words, about 33% of all players hit at least 1 homer, about 29% hit at least 2 homers, etc. Some other key numbers: 19% hit at least 10, 4.4% hit at least 100, and 0.16% have hit at least 500.
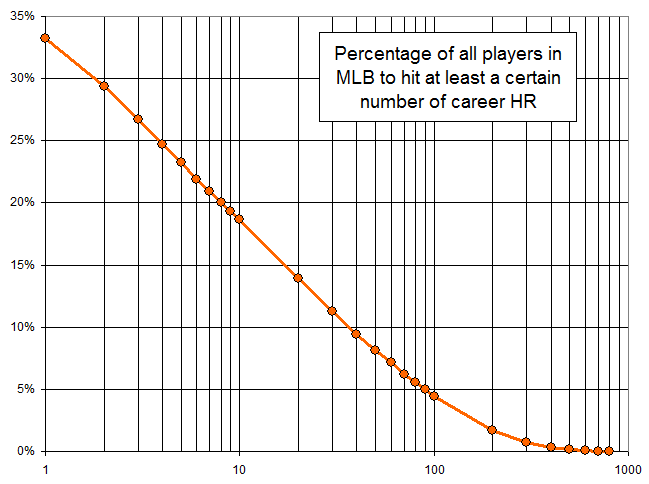
It’s unsurprising that the curve is linear for the middle section–with around 3,000 players to hit 10+ homers, we see a smooth and expected distribution with so many data points. I assume the lower end of the curve at 1 and 2 homers falls off because there is an unusually high number of players to hit very few homers. This includes lots of pitchers and other players who had only a cup of coffee and managed only a dinger or two. The high end of the curve fails to fall off linearly I assume because players who hit a fair number of homers tend to be the ones who are selected to stick around in MLB and therefore hit even more. The hitting of homers isn’t simply a random event distributed over the entire population–certain players are selected to remain in MLB, and the longer a guy sticks around, the more likely it is that he hits homers at an above-average pace.
Here are some game notes for the Opening Day STL/PIT game from yesterday. Continue reading
I just ran some numbers to see what they show. I took the 191 players to play at least 324 games (2 seasons’ worth) over the last 3 years and ranked them by their WAR total (ugh, Skip Schumaker!). Then I calculated their WAR per 162 games played. Finally, I sorted the results by ranking difference between their raw WAR total and WAR/162 value. Players at the top of this list jumped up the most places–so mainly these are guys who didn’t quite play 3 full seasons but posted high WAR totals. Players at the bottom of this list fell the most places, and they are mainly guys who played a lot and accumulated decent-but-not-great WAR totals that suffered when normalized to games played.
The full table is after the jump. Continue reading
I’m working on a USA Today Sports Weekly piece, and there sure is a lot of interesting stuff that happens in April.
We know that relievers have tossed an increasingly large fraction of innings over the years. In the 1970s, relievers tossed about 20% of all innings. In recent years, the percentage has been closer to 24%. That may not seem like a lot, but with a little over 43,000 innings last year, that extra 4% represents more than 5000 outs being recorded by relievers instead of starters.
It’s interesting to break down relief pitching even a little further, looking at what happens in all MLB games through the end of April vs the remainder of the regular season after April. Here is the percentage of innings pitched by relievers in those two conditions:
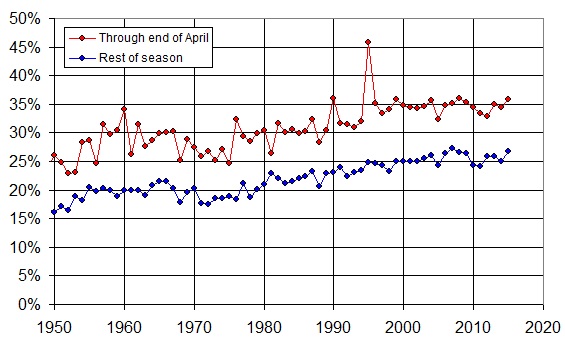
Both lines trending up over the years indicate what we already knew: relievers are throwing more and more innings, and it’s true for both April and the rest of the months. Incidentally, that spike for April in 1995 is due to the delayed start of the season from the 1995 strike–both a small sample size of games, and pitchers who had very little spring training to get ready.
Relievers have tended to be more effective than starters, especially as bullpen specialization (9th-inning closer, 8th-inning setup guy, and LOOGY) has increased. Because relievers roles are better defined, they can warm up more efficiently and not worry about leaving anything in the tank. This leads to harder pitches, more strikeouts, and less offense.
Take a look at the ratio of the two lines in the plot above. This quantifies how much more pitching relievers do in April vs the rest of the season. For example, in a given year, if they threw 30% of April innings and 20% for the rest of the season, that would register as 150% for that year, since they threw 1.5 times as many of the April innings (on a percentage basis).
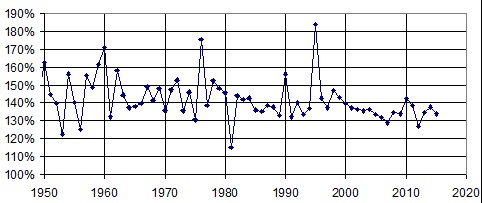
Throughout the 1970s, relievers pitched about 1.45 times as many innings than they did during the rest of the season (again, on a percentage basis). In the 1980s, it was about 1.40. In the 1990s, when offense spiked, so did the relievers’ innings (as starters were getting knocked out like crazy) but over the 2000s the value dipped as low as 1.30, a value it has hovered around in recent innings.
This makes sense for a couple of very different reasons:
Do you realize what this means? It means the notion that “pitchers are ahead of hitters early in the season” is wrong. The more likely explanation is that “relievers were used more frequently in April in years gone by, and were more effective, hence lower April offense, but now that there is much less difference in relief pitcher usage, there is little difference in April offense and that of the other months.”