
Thanks to Adam D. for this poster concept.

Thanks to Adam D. for this poster concept.
In an announcement on fangraphs.com, it’s been revealed that they and Baseball-Reference.com have unified the replacement level used for WAR calculations, meaning that bWAR and fWAR will now be the same.
I just chatted with our old friend @Neil_Paine about this and got some info:
In response to a question I was asked on Twitter, I figured out the age at death for all of MLB’s Hall of Famers. Click through for the info.
Here’s a very quick post that I still think you’ll find interesting. I found the top 100 players of all time in terms of RBI from low-leverage situations. Hank Aaron is #1, as you might expect, since he’s pretty much #1 in anything RBI-related. Then, I calculated the fraction those low-leverage RBI represented of their total career RBI. Let’s call this the “Alex Rodriguez RBI” stat, since he’s so often accused of driving in runs when they don’t really matter.
Click through for the large table of how these 100 guys stack up. Continue reading
I’m looking for a few beta testers for a new High Heat Stats feature–a stats-based game. If you want to try it out, and you’re available to spend a few minutes on it over this weekend, email me:
![]()
Who would you say is the best player in MLB history? Well, before answering, you might ask me to specify an age. If you’re looking for someone under 25, it would have to be Ted Williams, right? Somebody in their early 30’s? That must be Babe Ruth. How about the best player in their late 30s to 40s? Clearly it’s Barry Bonds.
But what if you didn’t have to choose? What if we picked the best year by any player at each age, and put them all together to build the perfect player? That’s just what we do after the jump.
Here’s a simple calculation that reveals lots of interesting stuff. Using B-R.com’s new option to limit searches to players who qualify as rookies (using the modern definition only), it’s easy to find what fraction of players each season who qualified for the batting title also qualified as rookies.
This is what the data looks like:
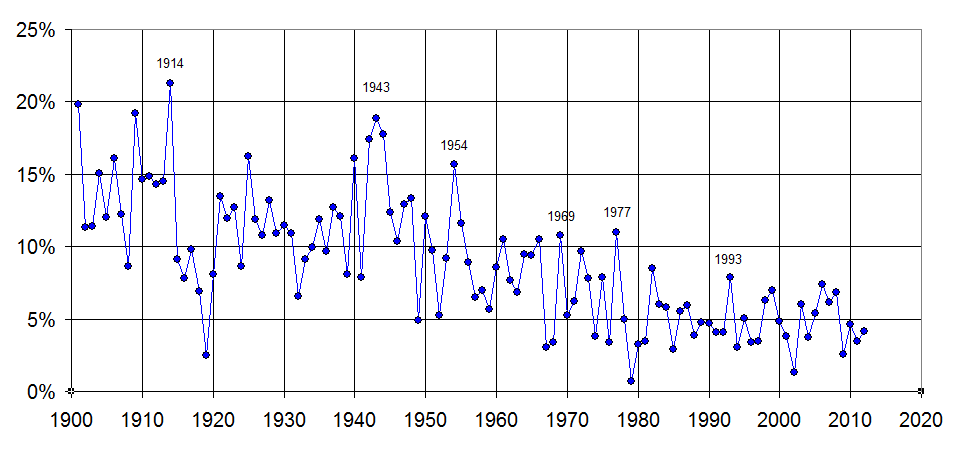
The overall trend is clear. In the early part of the 20th century, about 15% of full-time players were rookies. There is an uptick in 1914 as the Federal League was formed and lots of new players were brought in. In the late 1910s, nearly no rookies played full seasons but by the 1920s the rate was back up to about 12%. When World War II came around, the rate spiked as a lot of established players left for military service. There was a spike from 1952 into 1953, due to the Korean War. The rate spiked even further in 1954, but I’m not sure why, as that war was already over and guys like Ted Williams and Willy Mays were back.
By the 1960s, the rate of rookies dropped down to about 9%. In the 1970s, it went even lower, plummeting to an all-time low in 1979. From 1980 on, the rate has been relatively consistent around 5%. Note a few upticks in expansion years of 1969, 1977, and 1993.
I wonder why the fraction of rookies has dropped gradually over time? September call-ups probably have something to do with it–more players qualifying as rookies before playing a full qualifying season. There may just also be less playing of rookies full time–for example fewer rookies winning jobs in spring training.
What else can we surmise from this data?
After yet another playoff appearance in 2012, Derek Jeter has now played in 158 career post-season games, essentially an exact full season. Looking at his numbers, the results are staggering. Continue reading