The folks at Fangraphs have developed, and are advocating the use of, stats that seem to me to represent a major improvement, in evaluation accuracy, over the “save” and the “blown save” as methods for ranking relief pitcher performance. The Fangraphs concept of the “Shutdown”, as a replacement for the save, is very simple in concept if you understand the idea of “Win Probability Added” (WPA), which itself has been much discussed over the years at the baseball-reference blog that spun off into High Heat Stats. Continue reading
Category Archives: Uncategorized
No Longer on “Speaking” Terms – This Week in Baseball Trade History

SABR Biography Project - http://sabr.org/bioproj/
In a follow-up to my inaugural piece in this vein, I’m looking at trades occurring this week (Apr 9 to 15) in baseball history.
Comparing 2012 offense to 2011 (it’s crashing and burning, folks)
Here’s a quick look at offensive numbers in 2012 vs 2012. Both are through the first 142 games of each season.
(First number is 2011, second number is 2012, all are on a per-game basis):
             2011  2012
Runs scored: 4.56  4.02
HR:          1.06  0.99
2B:          1.65  1.61
BB:          3.20  3.13
K:           7.01  7.42
BA:           .255  .235
SLG:          .406  .385
Ummm…wow. Offense is way down so far this year compared to the same timeframe last year, and last year’s offense continued the overall trend of decline.
If run scoring remains this low for the entire season, it will be the lowest since 1981 (strike-shortened) and 1976 (full-season).
Look in particular at the strikeouts, which are ridiculously high, up nearly 6% from last year, and last year was a record year for strikeouts!!
UPDATE:
Here are numbers through the first 172 games of each season, 2011 and 2012. All numbers are per game.
      2011  2012   % change in 2012
R     4.55   4.06    -11%
HR    0.98   0.95    -3%
2B    1.75   1.64    -6%
K     6.94   7.51    +8%
BB    3.22   3.14    -2%
BA     .256   .237   -7%
SLG    .404   .383   -5%
These numbers are even more divergent than a couple of days ago!!
Here are some pitching numbers, beyond Ks and BBs as shown above:
            2011     2012      % change in 2012
ERA         4.13     3.66         -11%
IP/start    5.86     5.92         +1%
WHIP        1.334    1.237        -7%
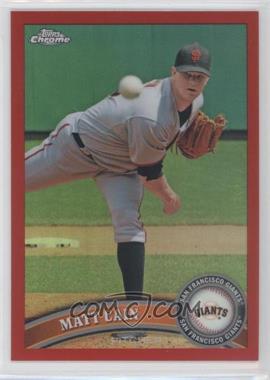
Is Matt Cain the Unluckiest Pitcher Ever?
 Of course, the answer to that question is a resounding NO. How unlucky could you be with the contract that Cain just signed? But, contract aside, I want to look at pitcher luck in terms of the results achieved for the quality of work produced. In other words, the relationship between wins and losses, and earned run average.
The traditional benchmark of W-L record for evaluating starting pitchers has now been largely eclipsed by ERA. Case in point is the 2010 AL Cy Young winner, Felix Hernandez, who took the trophy with a 13-12 W-L mark. Nevertheless, W-L is obviously still a prominent statistic. I can again cite Hernandez as a case in point – there was more than a little criticism of his Cy Young selection, based chiefly on that 13-12 record. Similar reaction attended Cain’s new deal. Even a knowledgeable blogger on this site pointed out Cain’s unremarkable career .486 W-L%, rather than his career 125 ERA+, ninth among active pitchers (min. 1000 IP), and in a tight cluster on that list with such names as CC Sabathia and Justin Verlander.
After the break, I’ll take a look at whether comparison of ERA+ and W-L% can provide clues as to whether a pitcher is lucky or unlucky.
Over the Hill At 20? Jason Heyward and Claudell Washington
In his age 20 season, 2010, Jason Heyward produced 5.2 Wins Above Replacement, according to baseball-reference’s formula (5.1 using the fangraphs formula). That’s All-Star level production for a player of any age, and extremely high production for a twenty-year-old. More on high-WAR 20-year-olds, and their future, after the jump. Continue reading
Photo caption contest
Stat Challenge #2 (for real this time!)
OK, I have posted another stat challenge, and you can join it right here. As Insert Name Here suggested I have opened it to the public so we may get some competition from folks who don’t read the blog. It is free to enter.
Speaking of the blog, we had some downtime this morning for reasons still unknown, but I am suspicious of the live chat plugin since I just installed that yesterday. I have disabled that live chat for now while we investigate. (You can still post comments on the chat thread.)
I have also entered a $1 challenge that has 1000 entrants and a lot of cash prizes. I didn’t create this league. If you feel like it, you can enter that one here.
As a reminder, if you don’t have a FanDuel account, please use this link to sign up as High Heat Stats gets a referral bonus.
The thrill of victory…
Chat is live
I have changed the Lobby page to a Chat page. You can still post comments there, but now you can also post chat to talk to anybody else in real-time who might be reading the blog.
Walks & strikeouts diverging in the past 2 years
As shown in the graph below, over the past 20 years, walk and strikeout rates (as a percentage of plate appearances) have usually gone in the same direction from year to year, and have usually been within 5 percentage points of each other. A couple of notable exceptions: Continue reading


