Category Archives: Uncategorized

More complete games than wins?! (It’s not only possible–it used to be commonplace)

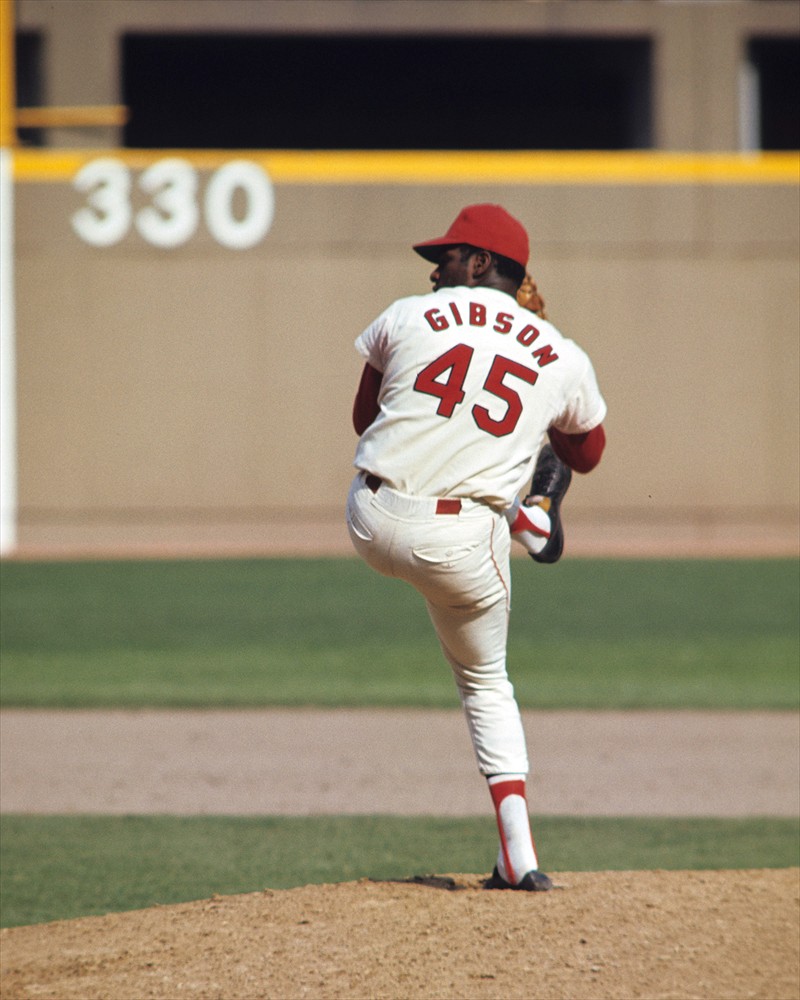
Bob Gibson finished his career with 255 complete games and 251 wins / Icon SMI

Back in the old days of baseball, pitchers complete most games that they started. In 1904, for example, 88% of games started ended up as complete games. That means that lots of pitchers registered plenty of complete game losses.

As a result, there are lost of pitchers who ended up with more career complete games than wins (thanks to all those complete games losses.) Continue reading

30 years ago today, the San Diego Padres were robbed

On February 11, 1982, the St. Louis Cardinals sent Garry Templeton to the San Diego Padres for Ozzie Smith.

Smith became a key member of the Cardinals right away,  as they went on to win the World Series that year. From 1982 on, Smith posted 39.7 oWAR and 18.6 dWAR with the Cardinals, good for a total of 58.3 Wins Above Replacement in St. Louis.

Templeton, meanwhile, played 10 seasons with the Padres and totaled 8.4 oWAR and 0.2 dWAR. San Diego then traded Templeton to the Mets for Tim Teufel, who gave them 2.5 oWAR and -0.5 dWAR in 3 seasons.

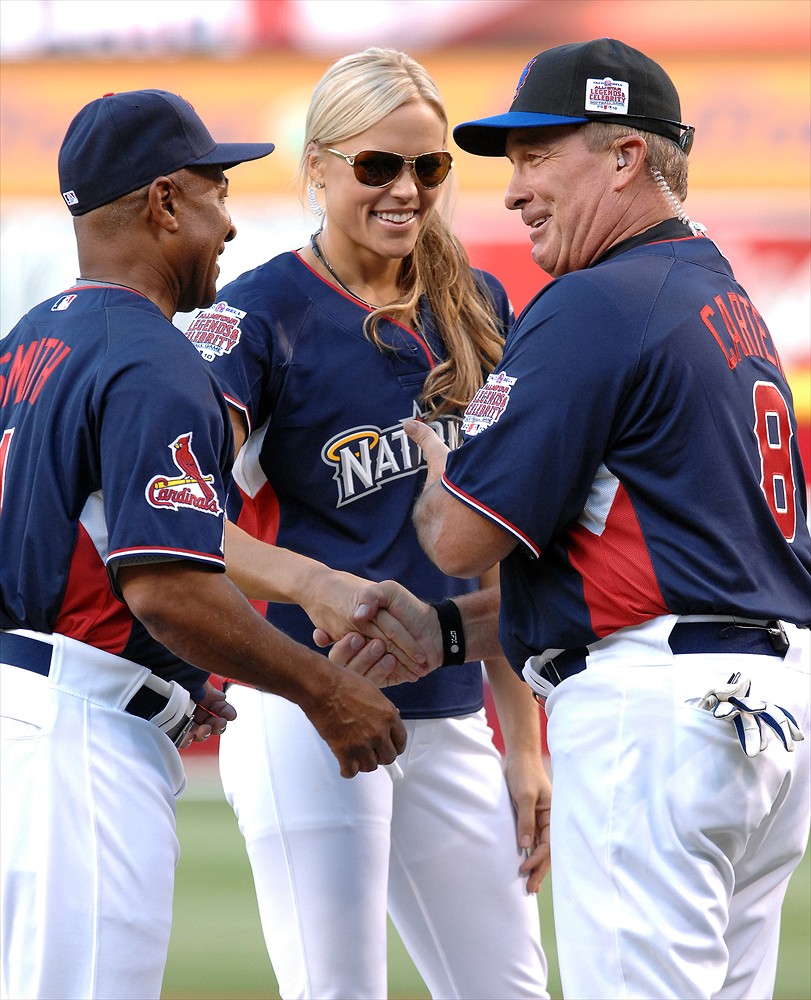
Ozzie Smith, Jennie Finch, and Gary Carter / Icon SMI

Fewest Wins by Pitchers with a Shutout Debut

Andy’s and John’s posts from earlier today made me curious about the career stats of pitchers who debuted with a shutout.  Since 1919, 44 pitchers have thrown a shutout in their pitching debut  (1 was a five inning game another a seven inning game, the rest were 9 innings). 1/4 of those pitchers never won 5 games in the majors, including 4 who never won another game. Here are the career stats for the 44:

Continue reading

Walk rates for hitters in uncertain pursuit of 3,000 hits

At Andy’s suggestion (see comment #17 here), I did a quick-and-dirty study of late-career walk rates for players who finished with around 3,000 hits.

The hypothesis to be tested is that players approaching both 3,000 hits and the end of their career tend to walk less often than they did before.

Included in the study were 30 players who wound up with 2,800 to 3,200 hits. I excluded those whose careers ended before “3,000 hits” became an iconic target (i.e., Sam Crawford and Willie Keeler).

I calculated their walk rates (BB per 700 PAs) for 4 periods:

  • Career minus their last 3 seasons;
  • Last 3 seasons;
  • Last 2 seasons; and
  • Last season.

Any period with less than 200 PAs is presented as “n/a” in the table. (Apologies for the table formatting, which I can’t seem to control.)

Walk Rates for Players Who Finished with 2,800 – 3,200 Hits

Hits

BB per 700 PAs

Player

Career
-3 yrs

Last
3 yrs

Last
2 yrs

Last
1 yr

3184

64

36

40

35

Cal Ripken

3154

69

51

41

45

George Brett

3152

70

103

n/a

n/a

Paul Waner

3142

54

62

59

60

Robin Yount

3141

54

48

53

n/a

Tony Gwynn

3110

70

60

69

n/a

Dave Winfield

3088

63

61

57

53

Derek Jeter

3060

69

39

38

29

Craig Biggio

3055

115

118

112

n/a

Rickey Henderson

3053

66

79

81

86

Rod Carew

3023

49

38

37

37

Lou Brock

3020

77

86

84

71

Rafael Palmeiro

3010

94

75

72

80

Wade Boggs

3007

78

66

67

72

Al Kaline

3000

42

46

40

49

Roberto Clemente

2987

48

56

46

53

Sam Rice

2943

83

108

123

n/a

Frank Robinson

2935

139

175

178

194

Barry Bonds

2930

77

80

81

n/a

Rogers Hornsby

2927

45

37

38

n/a

Al Simmons

2884

46

42

38

46

Zack Wheat

2880

49

63

68

n/a

Frankie Frisch

2876

106

90

n/a

n/a

Mel Ott

2873

135

146

154

n/a

Babe Ruth

2866

66

76

74

n/a

Harold Baines

2848

51

48

30

n/a

Brooks Robinson

2844

35

31

33

n/a

Ivan Rodriguez

2841

61

51

53

n/a

Omar Vizquel

2839

76

117

121

n/a

Charlie Gehringer

2812

37

35

34

34

George Sisler

Over all, I do not see a consistent pattern that would confirm the hypothesis. But the following players did have a marked decline in walk rate in their later years:

Compared to the 3 preceding years, Cal Ripken‘s walk rate fell by 54% in 1999, the year when he would have reached 3,000 hits if not for a couple of DL stints. (He got hit #2,991 in game #149, but played no more that year.) Ripken averaged 57 BB/700 PAs for the preceding 3 years, but that rate fell to 26 in 1999 (13 walks in 354 PAs). If he was pressing, though, it sure didn’t affect his hitting — his .340 BA, .584 SLG and .952 OPS were all career highs, and his SO rate was a couple of % points below his career rate.

Ripken got hit #3,000 in the 10th game of 2000. In the previous 9 games, he drew a normal 4 walks in 39 PAs.

George Brett‘s walk rate fell 46% from the prior 3-year average in 1992, the year in which he reached 3,000 hits on Sept. 30 with a 4-hit game. Brett averaged 71 BB/700 for the prior 3 years, but just 38 that year. And his BB rate was even lower in the run-up to that game — 7 walks in 229 PAs from August 1 to Sept. 30, and none at all in the 20 games immediately before the big one.

After a sterling ’92 capped by a go-ahead hit in WS game 7, Dave Winfield began 1993 needing 134 hits for 3,000, having averaged 72 BB/700 PAs for the previous 3 years. That rate fell to 53 in 1993, but coincided with a general decline in performance. There was no particular variance in his walk rate in the 20 to 50 games leading up to hit #3,000.

Craig Biggio began 2007 needing 70 hits for 3,000, having averaged just 42 BB/700 PAs for the prior 3 years (already well below his previous career average of 71). In 2007, his final year, Biggio’s walk rate dropped further, to 29 BB/700 PA. In the 30 games culminating in hit #3,000 (and a baserunning boo-boo), Biggio was hacking to the tune of 3 walks and 26 Ks in 118 PAs.

Well, I was going to write up a few more, but I ran out of time….