Fraction of balls put in play is at an all-time low

Here’s a plot showing the percentage of balls in play each year. Specifically, this refers to the fraction of plate appearances that result in a ball being handled by the defense.

BIP

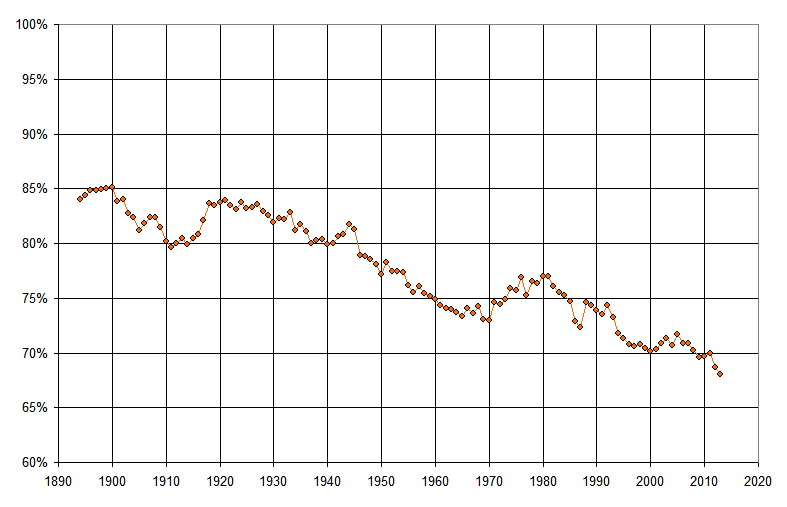
The formula uses at-bats in the numerator, subtracting out home runs and strikeouts, and adding sacrifice hits and sacrifice flies. That total is then divided by plate appearances, which of course includes walks and hit-by-pitch.

As you can see, 2013 is on pace to have the lowest percentage of balls put in play in MLB history. And even though 2013 is far from over and could change, 2012 itself set the all-time record, at just 68.7%.

The two biggest factors are, of course, home runs and strikeouts. Even in this year of very low offense, home runs are still quite high. I wrote about that in my USA Today Sports Weekly piece this week. Strikeouts continue to go higher and higher, and drive the percentage of balls in play lower and lower.

Some comments and implications about the above graph:

  • Think about 2013, at 68%, vs baseball in the 1940’s, around 80%. With teams averaging around 38 plate appearances per game, that’s a difference of nearly 5 balls in play per game. Think about that–5 batted balls fewer per game, every game! That’s astounding.
  • The fewer balls in play also means that defense matters less. In the current game, defense is the best it’s ever been. Equipment and fields are of uniformly excellent quality and players have better range than ever. However, the lack of balls being put into play means that the defense has fewer chances, so overall, there is less variability on defense from team to team.
  • We think of 1968 as the year of the pitcher, but 74.2% of balls were still put in play that year, meaning the defense played a much bigger role.
  • Take a look at fielding metrics over the years, here. Putouts have remained the same over the years, because they are basically all outs. But total chances has dropped gradually over the years, from about 41 in the 1920s to 39 in the 1940s to about 37.5 in recent years. This number has fallen a bit because errors have continually dropped, but more because assists have dropped. And why have assists dropped? Because a higher fraction of putouts are to the catcher, i.e. strikeouts, when there can be no assist.

The game is changing, for sure…


Thursday game thoughts, plus Wednesday wanderings

I’m a little punchy, but here’s what I’ve got for you:

@Indians 9, A’s 2: Take that, skeptics. Those (like me) who scoffed at the odds of Scott Kazmir‘s comeback, 4 years since his last good season and after dropping all the way to the independent Sugar Land Skeeters, now have a reason to eat their words. Coming off his first quality start in almost 3 years, Kazmir fanned 10 while holding the AL’s #2 offense to one run in 6 innings, with no walks against the club that’s far out front in that department.

Continue reading

Harvey’s heroics, and some other Monday game notes

[If you’ve had enough Harvey by now, skip down to “Other Monday action.”]

Six inches, maybe four: That’s what came between Matt Harvey and 9 perfect innings. The only blot on his line was a 2-out infield hit in the 7th by Alex Rios, gloved in the hole by Ruben Tejada with a jump-throw that was a split second late. Move that grounder a few inches to the right….

Continue reading

Quiz – Singular Seasons (solved)

The players in this quiz include a number of all-time greats, some sabermetric favorites, and a  couple of other guys.

So, what seasonal feat have only these players accomplished since 1901?

Hint: none of these players accomplished this feat more than once.

Congratulations to Phil, RJ and Richard Chester! They teamed up to identify these hitters as the only players since 1901 to have a qualifying season with more walks than hits, 25 or more HRs and 100 or fewer RBI. Despite the somewhat modest RBI totals, that is a pretty potent combination as 9 of the 10 seasons (listed in comment #30) scored 130 OPS+ or better, including two seasons over 200. Evidently, pitchers were justified in pitching around these guys frequently.

Sunday game notes & musings

And now to the games. As always, I’m sorry if your faves are neglected; no slight is intended.

Continue reading

Saturday game notes – now with full nationwide coverage!

@Marlins 2, Phillies 0: Youth shall be served. At the very least, with Miami, youth shall get playing time. Jose Fernandez (20) earned his first victory with a dazzler, allowing a hit to the 2nd batter and no more through 7 innings, while 22-year-old slugger Marcell Ozuna supplied the only run needful with his first career HR. Fernandez fanned 9, and sent 17 straight to the dugout between the hit and his only walk, both by Freddy Galvis. The other run off Cole Hamels was career HR #2 for Chris Valaika, who added a hit-saving play.

Continue reading

Whiff or Wallop – baseball’s zero-sum game

This just in – strikeouts are up again in 2013, averaging more than 7.5 per 9 innings. This is the 10th year-over-year increase in the past 14 seasons, and the 5th straight year setting a new all-time high. Not news to most readers here. Question, though, is this – is it good for the game? Does striking out a lot as the price for belting more homers really help a team score more runs? At what point, if any, does the cost outweigh the benefits?

What follows is a visual statistical analysis of strikeouts and home runs, the relationship between the two, and how that relationship contributes to or detracts from run scoring. No heavy lifting, but I hope you may come away with some new insights on this very pervasive influence on today’s game.

Continue reading