Thursday game notes – AL

Rays 7, @Blue Jays 1Matt Moore turned in Tampa’s third straight strong start (1 R, 2 H in 6 IP), and the Rays moved to 3-0 with Evan Longoria back in the lineup, even at DH — not only completing the sweep (with a total of 4 runs allowed), but resurfacing in the wide-open wild-card race. Losses by Detroit and Baltimore leave Tampa just a half-game out of a playoff spot and with a bit of momentum: They’ve won 10 of 15, including series wins over WC competitors LAA, OAK and BAL.

Pitching reliability – an honest day’s work

Quick – have you had a bad day at work this year? Pretty silly question, right. Well, if you’re among a select group of pitchers, maybe it’s not such a silly question. I’m talking about guys who deliver an honest day’s work almost every time they pitch and almost never have an “off day”.

As of this writing, there are still 5 pitchers this year who have put in a honest day’s work (HDW) every time they’ve pitched, and one (Ivan Nova) who had his streak snapped with his most recent outing earlier this week. After the jump, I’ll look more at the most reliable performers among major league pitchers.

Continue reading

Miggy, Henry & the Judge

Miguel Cabrera is in his 10th season. Just for fun, I compared his 10-year totals (projecting his 2012 rates to a full season) with those of Henry Aaron, who also debuted at age 20. Before you finish that derisive snort, let me state clearly that Aaron was without question:

  • a better hitter than Cabrera (8 points of OPS+ is significant);
  • a much better baserunner; and
  • a far more valuable player, considering defense.

That said, their hitting totals are still interesting:

Continue reading

*Wednesday* game notes – NL (corrected date)

[Originally posted as “Tuesday” game notes, doink. I was home sick for 2 days and my head got kinda fuzzy.]

@Brewers 3, Reds 2: You’re never as good as you look when you’re winning 15 of 16, says the adage, and the Reds suddenly have a 4-game losing streak, their second this year, averaging 2 runs on 5 hits. Milwaukee’s comeback was keyed by Carlos Gomez, who put them on the board with a HR in the 6th (reaching double-digits for the first time), then knocked in the tying run with 2 outs in the 8th and scored on Ryan Braun‘s double.

It’s been 5 years since Barry became king

My how time flies. It was 5 years ago today that Barry Bonds passed Hank Aaron as the all-time home run leader among MLB players.
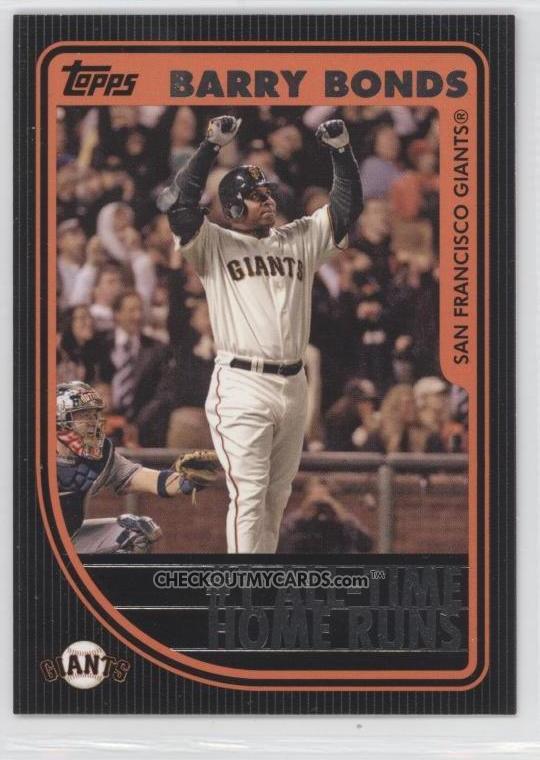
2007 Topps Update Barry Bonds 756 #HRK

I’ve got two questions–how did you feel then and how do you feel now?

Then–I didn’t care. Even more than that, I went out of my way to avoid news of it and acted like it was even happening. I hated Bonds as a person, hated Selig as commissioner, hated everything about the whole thing. I practically vomited in my mouth thinking about the spectacle that would ensue when it happened. I didn’t look at Barry Bonds as the poster child of steroids–I knew lots of people used them–but I certainly didn’t want to give him any accolades and act like it never happened.

Now–I still don’t appreciate Bonds as a person but I am a lot more comfortable accepting him as the home run king. Yes, he cheated. He deserves a major knock as a person for that. But lots of other players cheated, and the fact is that he has hit the most MLB homers. That’s a simple fact. Lots of factors have affected baseball records. Ted Williams would have given Babe Ruth a run for his money as HR king had he not lost more than 4 years to military service. Had Glenn Davis played in Fenway park and not the Astrodome, he probably would have been a superstar. Hundreds of players have used amphetamines dating back 50 years. I don’t like Bonds, but he is what he is–the all-time MLB HR leader.

What was it like for you then, and what’s it like now?

Monday game notes – expanded

Added games are above the solid line.

@Orioles 3, Mariners 1Chris Tillman won his 4th straight start, beating the team that developed him but dealt him away in the disastrous Bedard trade. Nick Markakis nipped Jason Vargas on his Achilles heel with a 2-run HR (2 out, 1-2 count in the 2nd), helping end his 5-start win streak. Baltimore has crept within a half-game of the wild card.

Game notes is back — and fatter than before!

Some more notes from Sunday games, not worth a separate post. New content is above the solid line.

— Baltimore’s 1-0, 10-inning win was the first MLB game since 1982 in which both teams pitched 10+ innings and allowed 3 hits or less. (That ’82 game is well-known to Mets fans, as super-spot-starter Terry Leach tossed a 10-IP 1-hitter in his 2nd career start — one of his 3 shutouts in 21 career starts.)

Continue reading

Cliff Lee’s not so excellent adventure

Cliff Lee of the Phillies is having one weird season. As of this writing, Lee is sporting a 2-6 W-L record after 19 starts, with rate stats comparable to his career averages.

Year Age Tm Lg W L W-L% ERA ERA+ WHIP H/9 HR/9 BB/9 SO/9 SO/BB Awards
2012 33 PHI NL 2 6 .250 3.73 108 1.181 8.9 1.1 1.7 8.5 4.96
11 Yrs 121 75 .617 3.65 116 1.220 8.9 0.9 2.1 7.3 3.47
162 Game Avg. 15 9 .617 3.65 116 1.220 8.9 0.9 2.1 7.3 3.47
Provided by Baseball-Reference.com: View Original Table
Generated 8/4/2012.

So, what’s so unusual? I’ll take a look after the jump.

Continue reading

Lots of hits, but where are the RBI?

Thanks to regular poster Richard Chester for contributing this article and analysis. Richard is a long-time Yankees follower with many stories to tell of days at the Stadium.

Derek Jeter has been piling on the hits this year and attention has been focused on his climb up the ladder of the lifetime hits leader board. Not often observed is his relatively low RBI total, even for a leadoff hitter. As of the date of this writing, 8/2/2012, he is projected to accumulate  213 hits and 50 RBIs. This would out him into a not-so-desirable club of players with 200 or more hits and no more than 50 RBIs.

After the jump, I’ll look some more at this unusual “club”.

Continue reading

Out with a bang, out with a whimper

Out with a bang

Here are retired players since 1901 with the highest OPS+ values in their final season (minimum 200 plate appearances):

Rk Player OPS+ PA Year Age Tm G AB R H 2B 3B HR RBI BA OBP SLG Pos
1 Ted Williams 190 390 1960 41 BOS 113 310 56 98 15 0 29 72 .316 .451 .645 *7
2 Shoeless Joe Jackson 172 649 1920 32 CHW 146 570 105 218 42 20 12 121 .382 .444 .589 *7/9
3 Barry Bonds 169 477 2007 42 SFG 126 340 75 94 14 0 28 66 .276 .480 .565 *7/D
4 Joe Adcock 167 265 1966 38 CAL 83 231 33 63 10 3 18 48 .273 .355 .576 *3
5 Will Clark 145 507 2000 36 TOT 130 427 78 136 30 2 21 70 .319 .418 .546 *3/D
6 Mickey Mantle 143 547 1968 36 NYY 144 435 57 103 14 1 18 54 .237 .385 .398 *3
7 Happy Felsch 143 615 1920 28 CHW 142 556 88 188 40 15 14 115 .338 .384 .540 *8
8 Dave Nilsson 141 404 1999 29 MIL 115 343 56 106 19 1 21 62 .309 .400 .554 *2/D
9 Brian Downing 138 391 1992 41 TEX 107 320 53 89 18 0 10 39 .278 .407 .428 *D/4
10 Roberto Clemente 138 413 1972 37 PIT 102 378 68 118 19 7 10 60 .312 .356 .479 *9
11 Buzz Arlett 138 469 1931 32 PHI 121 418 65 131 26 7 18 72 .313 .387 .538 *93
12 Steve Evans 138 638 1915 30 TOT 151 556 94 171 34 10 4 67 .308 .392 .426 *9/3
13 Joe Riggert 135 270 1919 32 BSN 63 240 34 68 8 5 4 17 .283 .356 .408 *8
14 Frank Huelsman 135 465 1905 31 WSH 121 421 48 114 28 8 3 62 .271 .333 .397 *7/9
15 Reggie Smith 134 398 1982 37 SFG 106 349 51 99 11 0 18 56 .284 .364 .470 *3
16 Frank Schulte 134 328 1918 35 WSH 93 267 35 77 14 3 0 44 .288 .406 .363 *97/8
17 Bill Keister 133 429 1903 31 PHI 100 400 53 128 27 7 3 63 .320 .352 .445 *9
18 Butch Nieman 132 291 1945 27 BSN 97 247 43 61 15 0 14 56 .247 .361 .478 79
19 John Titus 132 317 1913 37 BSN 87 269 33 80 14 2 5 38 .297 .392 .420 *9
20 Hank Greenberg 131 510 1947 36 PIT 125 402 71 100 13 2 25 74 .249 .408 .478 *3
Provided by Baseball-Reference.com: View Play Index Tool Used
Generated 8/4/2012.

It’s a beautiful thing that these seasons are so spread across baseball history. Check out the league leaders, too: Shoeless Joe led the league in triples, Barry Bonds led in OBP, and Steve Evans led in doubles.

Brian Downing stuck it to the Angels with a strong finish in Texas. Dave Nilsson wanted to go home to Australia and quit MLB while he was still doing really well. Ted Williams finished his career on a homer. Will Clark was an amazing late-season pickup for the Cardinals. Roberto Clemente was still playing really well before dying during the off-season.

That’s a list of (mostly) great players with (mostly) great stories about how they finished up.

Out with a whimper

Here are retired players since 1901 with the lowest OPS+ values in their final season (minimum 200 plate appearances):

Rk Player OPS+ PA Year Age Tm Lg G AB R H 2B 3B HR RBI BA OBP SLG Pos
1 Bill Bergen -3 250 1911 33 BRO NL 84 227 8 30 3 1 0 10 .132 .183 .154 *2
2 John Black 6 201 1911 21 SLB AL 54 186 13 28 4 0 0 7 .151 .202 .172 *3
3 Doug Strange 14 201 1998 34 PIT NL 90 185 9 32 8 0 0 14 .173 .217 .216 5/43
4 Hughie Critz 18 227 1935 34 NYG NL 65 219 19 41 0 3 2 14 .187 .198 .242 *4
5 Benny Zientara 24 203 1948 30 CIN NL 74 187 17 35 1 2 0 7 .187 .236 .214 *4/56
6 Jim Levey 24 567 1933 26 SLB AL 141 529 43 103 10 4 2 36 .195 .237 .240 *6
7 Harry Pearce 25 260 1919 29 PHI NL 67 244 24 44 3 3 0 9 .180 .209 .217 *46/5
8 Bob Dernier 27 205 1989 32 PHI NL 107 187 26 32 5 0 1 13 .171 .225 .214 879
9 Jim McLeod 27 251 1933 24 PHI NL 67 232 20 45 6 1 0 15 .194 .237 .228 *5/6
10 Tom Donohue 28 230 1980 27 CAL AL 84 218 18 41 4 1 2 14 .188 .216 .243 *2
11 Mike Balenti 29 227 1913 26 SLB AL 70 211 17 38 2 4 0 11 .180 .206 .227 *6/7
12 Joe Wagner 30 210 1915 26 CIN NL 75 197 17 35 5 2 0 13 .178 .210 .223 *46/5
13 Kevin Polcovich 32 238 1998 28 PIT NL 81 212 18 40 12 0 0 14 .189 .255 .245 *64/5
14 Mike Guerra 32 270 1951 38 TOT AL 82 246 21 48 2 1 1 22 .195 .261 .224 *2
15 Charlie French 32 229 1910 26 TOT AL 54 210 21 36 2 1 0 7 .171 .223 .190 *49
16 John Godwin 33 209 1906 29 BOS AL 66 193 11 36 2 1 0 15 .187 .215 .207 56/9483
17 Bill Lauterborn 33 219 1905 26 BSN NL 67 200 11 37 1 1 0 9 .185 .238 .200 54/68
18 Alan Trammell 34 207 1996 38 DET AL 66 193 16 45 2 0 1 16 .233 .267 .259 *64/57
19 Pat Putnam 34 212 1984 30 TOT AL 78 193 12 34 7 0 2 20 .176 .236 .244 *D7/3
20 Bob Uecker 34 221 1967 32 TOT NL 80 193 17 29 4 0 3 20 .150 .243 .218 *2
Provided by Baseball-Reference.com: View Play Index Tool Used
Generated 8/4/2012.

These seasons are also spread around a lot, although none are more recent than 1998. I think that teams have become extremely reluctant to give much playing time to guys who can’t do anything with the bat. This makes sense during the really high-scoring era of the 2000s, when defense mattered a little less because saving 1 run mattered a little less.

If you skimmed the second list, you may have missed one name near the end: Alan Trammell. He’s the only guy on that second list with a career OPS+ over 97 (his was 110). Fangraphs has his wRC+ in that final season as 37, meaning he created runs at 37% of league average…abysmal.