CAWS Career Gauge – Part 1

HHS contributor Michael Hoban has written a comprehensive paper on assessing career value for players of the past century (since 1920), commonly known as the live ball era. This series presents a condensed version of Michael’s work for your assessment and discussion.

Fans of any sport are usually interested in knowing who are (or were) the best players in the game. Baseball fans are particularly fortunate in that no other sport rivals baseball for the sheer number of statistics available for comparing the players. In fact, there are so many numbers available that it often leads to confusion as to what to look at in order to judge how good a player really is (or was).

For many years, a player’s batting average (BA) was used to suggest who were the best hitters.  But, careful analysis over a number of years has now convinced us that a combination of on-base-percentage (OBP) and slugging average (SLG) is a better indicator of who were the most effective batters. 

Of course, in baseball, batting alone does not tell us who is a “better player.”  Fielding must also enter into the equation.  And judging fielding has always been more difficult than judging hitting.  The skills required of a good shortstop or catcher are much different than those required of a left fielder or a first baseman.  And attempting to judge who was the best “all-around” player has always been difficult.

But not to worry.  Over the years, there have been a number of dedicated people who have devoted a considerable amount of time into researching these questions.  And I am happy to report that (in my view) the most highly respected of all of these analysts, Bill James, has developed a system that I believe is a quantum leap ahead of all such systems in this regard.

Win Shares

In 2002, Bill James published his book titled WIN SHARES, introducing a system of the same name for evaluating and comparing player performance. The key to the value of Win Shares is that it tells us how valuable a player was to his team each season.  And, of course, a player’s value to his team is what the game is really all about.

Win Shares is a very complex system (the book is 728 pages long).  First, like any valid evaluation system, it measures a player’s value relative to the era in which he played and to the playing conditions under which he performed.  But the second (and more remarkable achievement) is that it appears to be able to measure a player’s value regardless of whether he played on a winning or a losing team.  Thankfully, it is not necessary to completely understand how the Win Shares system works in order to appreciate the results that it produces.

Put as simply as possible, here is what the Win Shares system does – it tells us how good a season a player had.  It awards a team a certain number of win shares for the season – depending on the number of games that the team won during the season.  It then takes those win shares and distributes them among the players on the team depending on each player’s contribution to the team during the season.  And, as a rule of thumb, here is how the number of win shares in a season can be interpreted for an individual position player:

30-40 win shares  =  MVP-type Season
20-30 win shares = All-Star Season
10-20 win shares = solid regular player
0-10 win shares = bench player

As an example of win shares results, here are the best seasons by some of the greatest players in baseball history:

Honus Wagner…..1908…..59 win shares
Babe Ruth………….1923…..55
Walter Johnson….1913…..54
Barry Bonds……….2001…..54
Mickey Mantle……1957…..51
Ted Williams………1946…..49
Ty Cobb……………..1915…..48
Stan Musial………..1948…..46
Cy Young……………1892…..44
Willie Mays…………1965…..43
Hank Aaron………..1963…..41

Career Value

The Win Shares system does a wonderful job of telling us how good a season a player had. But how do you go from the examination of a player’s individual seasons to a conclusion about his career?  This is the essential question that I wish to answer.  And, of course, a simplistic answer might be: just add up the win shares from all his seasons and that will tell you.  That is, if you know the total of a player’s career win shares, you can judge how good he was.  But, I think it is not quite as easy as that.

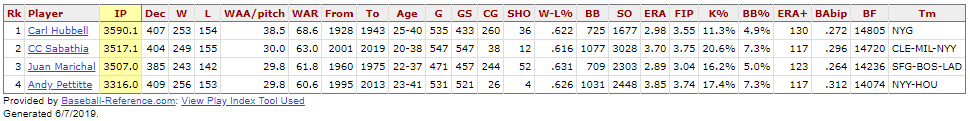
Unfortunately, the evaluation of many players’ careers is more complicated than just adding up the Win Shares of each season of a career. For example, Hall of Famer Dave Winfield had 415 career win shares while fellow Hall of Famer Joe DiMaggio had 387.  Does that mean that Winfield had a better career than DiMaggio or that Dave belongs in the Hall of Fame but Joe does not?  Of course not. Or, consider Hall of Fame pitcher Don Sutton, who had 319 career win shares, and fellow Hall of Famer Juan Marichal who had 263.  Does that mean that Sutton was a better pitcher than Marichal?  I think that very few fans would reach that conclusion.

CAWS

The point here is that total career win shares alone does not tell us enough about a player’s career.  And that is where CAWS (Career Assessment Win Shares) adds to the value of the Win Shares system.  CAWS suggests that a better (and fairer) way to judge a player’s career is to combine the win shares from a player’s ten best seasons plus an appropriate amount of credit for the player’s longevity.

Here is the CAWS formula:     CAWS  = CV  +  .25(CWS – CV) where

CAWS  =  Career Assessment Win Shares
CV  =  Core Value  =  sum of win shares for a player’s ten best seasons
CWS  =  total career win shares
.25(CWS – CV)  =  longevity factor  =  credit earned for a longer career

It is my contention that it is helpful to examine a player’s ten best seasons (what I am calling his “core value”) in order to get a better idea of how good he really is (or was).  But, at the same time, one must give some appropriate credit to a player’s career achievements.  It is this balancing of career accomplishments and core value that will tell us who had the best careers of all time.

Core Value

To demonstrate the use of Core Value, consider a player like Al Kaline, who played for twenty-two years and compiled 443 career win shares, compared to a player like Joe DiMaggio with 387 career win shares, but from a career of only thirteen seasons. During his ten best seasons, Joe DiMaggio accumulated 325 win shares – meaning that he averaged 32.5 win shares per season for those ten seasons – a spectacular achievement given, as we saw above, that MVP type seasons are those with 30 or more win shares. Al Kaline earned 268 win shares over his ten best seasons, impressive All-Star level performance, but nowhere near DiMaggio’s accomplishment.  And so we can begin to see that Joe D was a substantially better player.   

The Hall of Fame requires that a player must have at least ten years of major league service to be considered for induction into the Hall.  And, if we are going to speak of a player’s “core value” for the purpose of evaluating his career, then it seems appropriate to use this “ten year” measure – since, indeed, we wish to recognize the “best.”  That is, I will define a player’s core value (CV) as the sum of the win shares that he earned during his ten best seasons.

Note that core value is not the same as “peak value”, which other evaluation systems define as a player’s best three, five or seven seasons. The fact that peak value is judged by different benchmarks demonstrates what is fairly intuitive: that different players will have different numbers of peak years.  But I am suggesting that, regardless of how many peak years a player may have had, the player’s ten best seasons may be considered the core of his career. 

Note that Core Value already includes at least 55% of a player’s career win shares for all of the great position players – even those with the longest careers.  For example, Hank Aaron played for twenty-three seasons and accumulated 643 career win shares.  During his ten best seasons, he earned 356 win shares.  This represents 55% of his total win shares, one of the lowest CV percentages for any of the truly great position players. 

Longevity Factor

So, how should we value the remainder of a player’s career, for those seasons outside of his best 10? That is where the longevity factor is employed to credit a player with an additional 25% of the career win shares not already included in his Core Value. This factor, smaller for shorter careers and larger for longer ones, acknowledges the value of longevity without allowing the quantity of a career to overwhelm its quality.

Why did I choose 25%? In examining the numbers, I made the decision that the CAWS should represent at least two-thirds of a player’s career win shares; the 25% evolved from this decision. That is, every player’s CAWS score represents at least 67% of his career win shares.  For most players, it represents a much higher percentage than that. I did experiment with using other percentages such as 15%, 33% and 50%.   For example, if we use 33% in the formula instead of 25%, a few relatively small changes would take place – obviously benefiting those players like Hank Aaron and Pete Rose who had particularly long careers.  But, after much deliberation, I finally decided that 25% of the non-core win shares seemed to address the value of a player’s longevity in the fairest manner; but, it was strictly a judgment call.

In Part 2, I will look at CAWS and Hall of Fame standards, and present CAWS scores for the best players of the past century. If you would like to calculate CAWS for players of interest to you, Bill James is now providing, for free, season by season Win Shares totals for any player. I’ll let you do the math to calculate the corresponding CAWS scores.

0 0 votes
Article Rating
Subscribe
Notify of
guest

112 Comments
Oldest
Newest Most Voted
Inline Feedbacks
View all comments
Bob Eno (epm)
Bob Eno (epm)
4 years ago

Mike has put in an enormous amount of work on this issue. In addition to the paper on CAWS that Doug links to in his introduction to Mike’s overview here, which limits itself to players from 1920 on, Mike has applied CAWS to all players whose careers were substantially post-1901 in his book, Defining Greatness, which goes into more detail with numerous interesting case studies. Since Mike joined our conversations in the initial installments of nsb’s “Friends of Frisch” series, which has one leg left to run, I think (hope?), I’ve been exploring CAWS and using it in assessing Hallworthiness,… Read more »

Doug
Doug
4 years ago
Reply to  Bob Eno (epm)

That comparison of Rixey and Tiant is a bit of a shocker. My hunch is that Rixey does well with CAWS by dint of playing mostly on bad teams, and garnering most of his teams’ Win Shares for those seasons. For Tiant, playing mostly on good teams, the Win Shares would have been spread more evenly amongst himself and his teammates.

Bob Eno (epm)
Bob Eno (epm)
4 years ago
Reply to  Doug

I think that may be right. The projects of Win Shares and WAR are really quite different, since WS is rooted in real-world wins that get divvied up, and WAR in statistically calculated wins, based on quality, generally free of context. I guess this is the time to go back to read Win Shares and get clear on bWAR’s formula in detail (as much as is transparent). I’d been putting that off till nsb’s last item was posted, but we seem to have skipped ahead. If anyone here can simply provide a good comparison, that would be great. James himself… Read more »

Doug
Doug
4 years ago
Reply to  Doug

Actually, Rixey’s teams weren’t as bad as I thought. A couple of really bad teams with the Phillies and a couple with the Reds, but the rest were mostly decent clubs, including one pennant winner. On the whole, not too much unlike the teams Tiant played for.

Biggest difference is the 1000 more innings that Rixey pitched, which gives him 10 more WS for longevity. But, Rixey also had 20 more WS for his core value, despite being outpaced by Tiant by almost 10 WAR for their top 10 WAR seasons. Can’t explain it.

John
John
4 years ago
Reply to  Doug

I can explain. It is part of what makes baseball the greatest game ever devised. There is no earthly way to tell who is the greatest player. None. Who was better, Ernie Banks or Reggie Jackson? Babe Ruth or Ty Cobb? Sandy Kolfax or Walter Johnson? I think we can all agree that Mike Schmidt and Honus Wagner were better than Moonlight Graham and Larry Yount (although both were surely better players than me!). Who would you rather have on your team, Ty Cobb or Babe Ruth? Damn! Can I have both? Please? All the interpretations of the stats in… Read more »

no statistician but
no statistician but
4 years ago

Thanks to Mike for presenting a new view to us that is cogent and arguable. I urge other commenters to examine the full document to see with what adeptness Mike has arrived at his positions. That being said, I would like to critique not the general but a few of the specifics of his findings, criticism, in this instance, used in the broader sense of probing rather than finding fault. One of the major issues Mike addresses is qualitative value: Twice, using Joe DiMaggio as a reference, he asserts that, although DiMag’s cumulative stats fall below that of others( Dave… Read more »

Bob Eno (epm)
Bob Eno (epm)
4 years ago

nsb, Ashburn comes in just below Jimmy Wynn and just above Max Carey in CAWS, and that’s for HoF, which is larger than the CoG. I’m not sure Ashburn could be called a shoo-in. CAWS is very strong on Allen. But the Hall of Stats places him a bit behind Ashburn. I think there’s no way we can avoid using our brains.

no statistician but
no statistician but
4 years ago
Reply to  Bob Eno (epm)

I was looking strictly at the rankings by position in light of who is currently among the COG candidates. The comment was to be taken cum grano salis, as the wild wits of of the Roman empire used to say.

no statistician but
no statistician but
4 years ago

Just saw an obit for Bill Buckner. Some other time it might be worth a discussion of the actual worth of a player like Buckner, who finished with an OPS of 100, despite having over 2700 hits.

Bob Eno (epm)
Bob Eno (epm)
4 years ago

I just spotted the obit too. Very sad to read that he succumbed to Lewy Body syndrome, an awful disease. My first thought was that he’d already had his share of woes. The online WaPo homepage headline is, “Former Red Sox first baseman known for World Series error dies at 69.” It would have been nice if they’d squeezed in a reference to him as a batting champion.

Paul E
Paul E
4 years ago
Reply to  Bob Eno (epm)

Bob Eno,
It’s the Washington Post – they gotta blame the white male whenever possible 🙁
Supposedly, he was getting death threats 20 years later….people harassing him in public, etc…

Doug
Doug
4 years ago

I have updated the COG Roster spreadsheet with WS and CAWS. CAWS per WAR ratio is:
Position players (92) – Mean: 4.006, Std Dev: 0.568
Pitchers (40) – Mean: 3.292, Std Dev: 0.638

https://docs.google.com/spreadsheets/d/1gSHnQDGkKjjHdb-EIj6ZvoBcubAuvph2XcaI8zORtWQ/edit#gid=2124262951

Bob Eno (epm)
Bob Eno (epm)
4 years ago
Reply to  Doug

Doug, did you include Satchel Paige in those pitcher figures?

Doug
Doug
4 years ago
Reply to  Bob Eno (epm)

He was included. His CAWS:WAR ratio is third highest, behind Mordecai Brown and Wes Ferrell.

Mike H
Mike H
4 years ago
Reply to  Doug

Just a few comments: 1. I am pleased (and flattered) that the participants here are discussing my work. Thank you. 2. NSB is correct in pointing out that I view as an important part of my work “to supply correctives” to the raw numbers in some cases. I view my lists of position players and pitchers who had “short but great careers” (and are therefore worthy Hall of Famers) as significant. And also my work on what a true reliever needs to qualify as worthy of the Hall. 3. Over the past few months, I have begun to suspect that… Read more »

Bob Eno (epm)
Bob Eno (epm)
4 years ago
Reply to  Mike H

Mike, I’d agree with you that the principal area of disparity between Win Shares and WAR for position players is the fielding calculation. Unlike you, I don’t find it difficult to see the three players you name as more valuable to their teams than McCovey was. My intuitions are different from yours. Those intuitions have been modified over the past year or so — and this is where our difference may come from — by studying the “Fielding Bibles,” published by Baseball Information Systems and edited by Bill James’s colleague John Dewan. James has contributed to all four volumes of… Read more »

Doug
Doug
4 years ago
Reply to  Bob Eno (epm)

When you look up Win Shares totals for individual players using the database on James’s site, a fielding component is shown separately for seasons since 2002. For prior seasons, the fielding component was included in the overall calculation but apparently was not represented in units of win shares.

Bob Eno (epm)
Bob Eno (epm)
4 years ago
Reply to  Doug

I should have added a note on this before. The Baseball Gauge beaks down the numbers for all years, back to 1871.

Doug
Doug
4 years ago
Reply to  Mike H

Mike, Could you perhaps explain the difference in Win Shares between playing on a good team and a bad team. For example, Nate Colbert garnered 28 Win Shares for a 5 oWAR season playing first base for the 1972 Padres team that lost 95 games and had only two players (Leron Lee was the other) with more than 1 WAR. That same year, Willie Stargell put up very similar numbers (26 Win Shares, 4.8 oWAR) playing first base for a Pirates team that won 96 games. Is Win Shares somehow calibrated such that similar seasons will earn similar Win Shares,… Read more »

Mike H
Mike H
4 years ago
Reply to  Doug

Doug, One of the more amazing things about Win Shares is that (in theory) there is no difference between playing on a good team or a poor team – as far as a player’s credit is concerned (which your example appears to illustrate.) Here is a quote from p.16 of DEFINING GREATNESS: “Win Shares is a very complex system (the book is 728 pages long). But it is not really necessary to understand every nuance of the system in order to appreciate its value. The true genius of the approach seems to be two-fold. First, like any valid evaluation system,… Read more »

Doug
Doug
4 years ago
Reply to  Mike H

I read that, but that’s one part of Win Shares that I’ve always wondered how it does it. As you say, my illustration bears out the notion that it doesn’t matter how good or bad the team it is. Yet, even by Pythagorean estimates, a team could vary by 15 or even 20 wins from very unlucky to very lucky. So, does Win Shares distribute actual wins among players, or estimated wins? Just a bit of hesitation I’ve always had about the methodology and whether players might be unfairly (in my view) advantaged or disadvantaged depending on their team context.

Bob Eno (epm)
Bob Eno (epm)
4 years ago
Reply to  Doug

In Win Shares, James devotes two sections to arguing that the system is equally fair to players on good and bad teams. So far as I can tell, his claim does not rest on a mathematical justification, but rather on a logical and an empirical argument. The logical argument is that players on good teams share in more wins, but there are more good players claiming significant win shares, reducing the notion that a single player can earn an outsize number of win shares; on a poor team, a good player with an identical record draws on fewer wins that… Read more »

Doug
Doug
4 years ago
Reply to  Bob Eno (epm)

Thanks very much Bob for that outstanding (as usual) assessment. As you say, the evidence seems a little weak from the lens of today, but would have seemed more convincing at the time.

FWIW, here’s my example. Perhaps Colbert is slightly over-valued, and Stargell under-valued, but given that this is an extreme example (in terms of their ball clubs), it’s probably supportive of James’s viewpoint.

Bob Eno (epm)
Bob Eno (epm)
4 years ago
Reply to  Doug

Doug, I’m going to try to complete the comparison you make by noting that Colbert was playing for a .379 team, Stargell for a .619 team, and their WS are very close: 27 for Colbert and 26 for Stargell. The Baseball Gauge breaks down offense and defense in this way: Off……Def 23.9….3.3….Colbert 25.3….0.8….Stargell Total bWAR is not at all as close, giving Colbert the edge 5.4 to 3.9; fWAR is much closer: 5.0 to 4.8. WARP is very close to bWAR: 5.5 to 3.9. I’ve added the various WAR stats to see whether the WS comparability is carried over, and… Read more »

Voomo Zanzibar
Voomo Zanzibar
4 years ago

Got to wondering if anyone had ever scored four runs in a game without reaching base by means of a hit or a walk.
According to the play index, no, it hasn’t happened. I’m seeing 16 occasions of three runs, but only twice since 1975.

Whitey Ford did it in1958; while pitching a shutout:

https://www.baseball-reference.com/boxes/NYA/NYA195807202.shtml

Bob Eno (epm)
Bob Eno (epm)
4 years ago
Reply to  Voomo Zanzibar

Voomo, That 1958 Ford game is a wonderful illustration of the products of syndicate baseball. The Yankees completely dominate their fumbling farm team, the KC A’s, without even bothering to put their best player, Mantle, in the field. Over the next season or two they’ll go on to extract more talent from the farm: on the A’s line-up, Lopez, Maris, and DeMaestri were all heading for the New York big league club (Simpson was oscillating back and forth), while the Yankees would send Lumpe, Bauer, Sieburn, and Throneberry down to AAAA, that is, the A’s. On the pitching staff, Ford… Read more »

Doug
Doug
4 years ago
Reply to  Bob Eno (epm)

For the 1955-64 decade, the Yankees won 148 of 205 games against the A’s, a .722 clip that just edges out the 1954 Indians.

Doug
Doug
4 years ago

Fans in Tampa are so excited about their contending ball club, that they set a new all-time attendance record at the Trop tonight. Unfortunately, it was an all-time record LOW.

Mike L
Mike L
4 years ago
Reply to  Doug

Every market is different, but it’s fascinating that a state as populous as Florida can’t support even one team.

Bob Eno (epm)
Bob Eno (epm)
4 years ago
Reply to  Mike L

It’s supporting one team, Mike. It’s just that Team Florida has franchises in two cities and fans generally attend only one at a time. Of the two, the Tampa branch is drawing far bigger crowds than the Miami branch, despite the fact that the Miami branch is a league leading one, with more losses than any other NL club.

Voomo Zanzibar
Voomo Zanzibar
4 years ago
Reply to  Bob Eno (epm)

I’d wager that the Saint Petersburg team would do better if they played day games. And had a fleet of shuttles going to all the 55+ villages and facilities.

It’s disgustingly hot all day, and there are half a million people there just hanging out with nowhere to be.

By 7 pm everyone is either worn out or at a bar.

And the Thunderdome is a terrible place. Seriously. Hard to summon the will to there deliberately. Air conditioning at 2 pm is it’s primary feature.

Doug
Doug
4 years ago

One aspect of CAWS that I noted doing the calculations for our CoG inductees is that CAWS may, perhaps, undervalue those few players who sustained near-core level performance beyond their top ten years. Since all of those seasons beyond the top 10 are discounted 75%, that’s quite a hit for the elite performer compared to the more normal player whose top 10 seasons really are all of his best years and may even include some of his ramp-up or decline phase. I think my point is that when comparing great to near-great players, the difference in CAWS may understate how… Read more »

Mike H
Mike H
4 years ago
Reply to  Doug

Doug, You wrote: “One aspect of CAWS that I noted doing the calculations for our CoG inductees is that CAWS may, perhaps, undervalue those few players who sustained near-core level performance beyond their top ten years. Since all of those seasons beyond the top 10 are discounted 75%, that’s quite a hit for the elite performer compared to the more normal player whose top 10 seasons really are all of his best years and may even include some of his ramp-up or decline phase. I think my point is that when comparing great to near-great players, the difference in CAWS… Read more »

Bob Eno (epm)
Bob Eno (epm)
4 years ago
Reply to  Mike H

The case of Allen vs. Kaline is interesting. Comparing the components of CAWS and of the WAR equivalent (“CWAR”= Best10 + .25*(WAR-Best10)), the discrepancy in valuation seems to come from a sharp difference in assessments of Core Value/Best10, as well as from the sharp discount Kaline suffers on a substantial career outside his best ten seasons, while Allen’s extra five seasons generated almost no value. WS…….CV…….CAWS……. ……..WAR……..Best10……..CWAR 342…..304……..314……… ……..58.7………..56.0………….56.7……..Dick Allen 443…..268……..312……… ……..92.8………..66.3………….72.9……..Al Kaline Win Shares sees Allen’s best seasons as substantially better than Kaline’s, while WAR sees the reverse. I suspect the difference is mainly a matter of fielding credit.… Read more »

Paul E
Paul E
4 years ago
Reply to  Bob Eno (epm)

Bob Eno,
Allen, probably due to the cumulative effect of injuries, fell off a cliff (performance wise) at age 33. No ML team was going to put up with him for too long if he was going to perform so miserably. Basically, he was out of baseball at 35 where as, he might have hung around as a platoon 1B/PH if he wasn’t “Dick Allen”. He may have possibly finished up as a Johnny Mize-type player if healthy. These 800 or so PA’s represent only 10% of his career; hence, the high “CV” and high percentage of CWAR to WAR

Bob Eno (epm)
Bob Eno (epm)
4 years ago
Reply to  Paul E

That’s right, Paul. Except I think Allen was a little more active in pushing himself out the door: it wasn’t just that no team would put up him because he was Dick Allen as that he became more difficult to deal with under the stress of seeing his ability go away. So I’m not sure that he never had a chance for a Mize-like finish; he may have sabotaged the chance he had. But my main point was that the root of the Allen/Kaline assessment issue here isn’t so much longevity — a debate we’re familiar with — as the… Read more »

Bob Eno (epm)
Bob Eno (epm)
4 years ago
Reply to  Doug

Doug, I think the comparisons between Mays and Mantle would be best as CWS/WAR and CAWS/”CWAR”. CWS……WAR……… …..CV……Best10… ….CAWS………”CWAR” 642…….156.4…….. ….389……..100.5.. ……452………….114.5……..Mays 565…….110.3…….. ….399……….83.3.. ……441……………90.1……..Mantle So there are really two main differences. Win Shares just doesn’t see as great a difference between Mays and Mantle as WAR does in terms of quality (especially in terms of CV/Best10), and also Mays suffers more from the exclusion of non-peak seasons. WAR sees Mays as producing 6.3 WAR per 500 PA, while Mantle’s figure is much less (though still terrific): 5.6. Win Shares sees the reverse: Mays has 25.7 WS per 500 PA,… Read more »

Paul E
Paul E
4 years ago
Reply to  Bob Eno (epm)

Bob, Doug, As far as CAWS and ‘elite’ players, probably best to take it to 15 years for the sake of accurate comparison or hair-splitting discussion. The WS system just isn’t giving Mays credit for being a great fielder. But, in their primes, I could be easily convinced that Mantle’s 120 BB’s offset the difference in fielding. W MAYS 7973PA 1850G 167OPS+ 1666RC 8.755RC/27/AIR age 23-34 MANTLE 8028PA 1909G 178OPS+ 1769RC 10.49RC/27/AIR age 20-33 For their best ~ 8,000 consecutive plate appearances, Mantle is creating roughly 2 more runs for about every 7 games (30 outs) played due to his… Read more »

Bob Eno (epm)
Bob Eno (epm)
4 years ago
Reply to  Paul E

Good point, Paul. Two runs is a big number, and it’s the product of Mantle making fewer outs, 4692 vs. 5087, which correlates with his many more BB, 1420 vs. 876.

Avoidance of outs seems to be the core issue: Mantle is producing 110 RC per 500 PA to Mays’s 104 — not much of a difference. But Mantle’s producing 189 RC per 500 outs made vs. Mays’s 164 (not correcting for park/league effects, which work further in Mantle’s favor).

Over the same seasons, Mays’s Rfield was 153 to Mantle’s 5.

Paul E
Paul E
4 years ago
Reply to  Bob Eno (epm)

bOB,
“Over the same seasons, Mays’s Rfield was 153 to Mantle’s 5.”
Which, I guess, is about 12 runs/year? And offsets Mantle’s ~ 8 RC per year advantage?

Bob Eno (epm)
Bob Eno (epm)
4 years ago
Reply to  Paul E

I don’t know, Paul. I’ve been thinking since I left that message about what we learn from RC/PA and RC/Out (and how the “500PA / 500 Outs” relationship should be considered). I had initially done the Rfield comparison as a way of balancing it against Runs Created, but it makes a lot of difference what the RC unit is. I know you’re particularly fond of using adjusted RC/27 and it makes sense, but I’m not really clear in my own mind how much sense, or, better, what context may be needed to make the sense clear. Since you’ve thought about… Read more »

Paul E
Paul E
4 years ago
Reply to  Bob Eno (epm)

Bob Eno, In the above calculations, I took the 103 RC difference between the two CF’ers and divided it by about 12 seasons to come up with the ~ 8 RC per season advantage to Mantle. I’m more confident in this number (due to its simplicity and the overt nature of offensive numbers in the sport) and these data points than I am in Rfield but, Mays’ Rfield difference of 148 (153 – 5) aappears to equal ~ 12 “runs” over 12 seasons. Everyone seems to be accepting these fielding numbers so I guess I’ll acquiesce and agree that it’s… Read more »

Bob Eno (epm)
Bob Eno (epm)
4 years ago
Reply to  Paul E

Thanks for going into detail, Paul. All this makes sense, and since I read James’s abstracts for years I’m sure I’ve encountered the work that you remembered better than I. My calculation of the simple RC differences is like yours, with Mays benefiting, but Mantle has a big advantage in the RC/27 calculation, as you showed initially. I guess my stumbling block is conceptual: why do RC/PA and RC/27 produce different results? After all, the outs/walks are PA results, and the RC figures per PA should already reflect them. The one certain thing is that I’m missing something — certain… Read more »

Bob Eno (epm)
Bob Eno (epm)
4 years ago
Reply to  Paul E

Forgot one detail: What the heck is DOBA?

Paul E
Paul E
4 years ago
Reply to  Bob Eno (epm)

Bob,
Dead On B- – – s Accurate – from “My Cousin Vinny”
“Why do RC/PA and RC/27 produce different results?”
Because not every PA is an out?

Bob Eno (epm)
Bob Eno (epm)
4 years ago
Reply to  Paul E

Well, yes. And that’s a good thing or we’d tire of baseball very soon. But I didn’t mean why are the absolute numbers different, but why would the comparisons between, say, Mays and Mantle differ so much on those two bases. After all, all the outs are included in the PAs, and the RCs don’t vary. If Mantle’s fewer outs didn’t result in more RC, their value is simply the reduced number of negative PAs. Conversely, their value can be expressed in Mays’s greater number of negative PAs — but we’d expect that to be reflected in RC/PA. . .… Read more »

Paul E
Paul E
4 years ago
Reply to  Bob Eno (epm)

Bob,
“If Mantle’s fewer outs didn’t result in more RC, their value is simply the reduced number of negative PAs”
What separates Mantle and anybody else who walks frequently from their lesser-walking peers is this wonderful statistic RC/27. If you’re making fewer outs and creating more runs (or as many runs) as the next guy, you are a superior offensive player. The difference you’re not seeing is in the denominator and is so extreme in Mantle versus Mays since Mickey (17.5% of PA’s) took a walk like Frank Thomas (16.5%) and Mays (11.7%) took a walk like Frank Robinson (12.1).

Bob Eno (epm)
Bob Eno (epm)
4 years ago
Reply to  Paul E

The difference you’re not seeing is in the denominator I’m seeing it, Paul, but I have this idea in my mind that there are two denominators derived from RC/PA, and the relation between them is confusing. (RC/Outs) shows one denominator; (RC/(PA – Outs)) shows the other. My impaired logic is telling me this: Mantle and Mays are roughly equal in RC per PA (Mantle’s a bit better, but let’s say it’s equal) and in PA. Mantle has lots fewer outs, so his RC/Outs figure is lots higher. Obviously, making fewer outs is a good thing, so we’d expect more RC:… Read more »

Bob Eno (epm)
Bob Eno (epm)
4 years ago
Reply to  Bob Eno (epm)

There’s a dead horse over here, Paul, and I just can’t resist beating it. I think my reservation about RC/27, AIDed or unAIDed, is this. Within any one player’s record, say Mantle’s, RC/27 represents the number of runs a team of Mantles would score each “game,” given Mantle’s record. The “games” in question are constructs. Within Mantle’s record, there is no actual significance to clusters of 27 outs he made: they did not constitute real units, games. They are taken together and construed as games, and the magnitude of Mantle’s offense for each game is multiplied by nine. So if… Read more »

Bob Eno (epm)
Bob Eno (epm)
4 years ago
Reply to  Bob Eno (epm)

Correction: “. . . ~+2 runs per seven games.”

Bob Eno (epm)
Bob Eno (epm)
4 years ago
Reply to  Bob Eno (epm)

(Still beating) . . . no, I guess it’s actually per game, since there are all those Mantles.

Paul E
Paul E
4 years ago
Reply to  Bob Eno (epm)

…..and Team Mick’s 10.49 runs beats Team Mays’ 8.755 runs to the tune of ~ 95.53 to 66.47 every 162 games played against league neutral pitching staffs (and fielding). It’s would be roughly a 59% success rate for a team of Mantle’s (per Pythagoras) versus Team Mays. Think of it this way, Mick walks more frequently than Mays. So, theoretically, Mick is on 1B via walk and Mick is up next more frequently than Mays is batting with Willie on 1B.. He’s kind of, sort of piling on. To paraphrase Don King, “It’s exponential”!! AND, Mick keeps on coming up… Read more »

Bob Eno (epm)
Bob Eno (epm)
4 years ago
Reply to  Paul E

All true, Paul. It’s exponential. But Mick was the only exponent in this world; the other Mick’s are a thought experiment in an imaginary world. Both are equally valid answers, but to very different questions. You can pick whichever you like, but if you pick Mick, then it’s RC/PA, and Mick and Mays in their peaks are roughly comparable. That’s Mick vs. Mays. If you pick Mick*9, you get RC/27, and the Mick nonuplets ride roughshod over Willie’s Gang of Nine. That’s Mick^9 vs. Mays^9. But think of it this way: if you could play Mick and eight named players… Read more »

Paul E
Paul E
4 years ago
Reply to  Bob Eno (epm)

Bob Eno, “You can pick whichever you like, but if you pick Mick, then it’s RC/PA, and Mick and Mays in their peaks are roughly comparable.” Not necessarily so… see below “if you could play Mick and eight named players on a team against Mays and the same eight players, the difference between the two teams would be the difference in Mick & Mays’s RC/PA”. Not so, Bob. If Mantle and Mays have the same teammates, then Mantle’s teammates would get significantly more opportunities during the course of the season by virtue of him making outs less frequently. Whether it’s… Read more »

Bob Eno (epm)
Bob Eno (epm)
4 years ago
Reply to  Paul E

You make a good point, Paul. The effects of Mantle’s superiority in getting on bases and avoiding outs does have a concatenating effect. But I believe that effect is built in to RC. After all, if none of the teammates are any good at all, all Mantle and Mays will produce is solo home runs — Mantle’s walks would be useless — but the RC would be the same. (Well, that’s not quite true, since I believe RC now takes account of RE24, where the data is available.) As I understand it, RC reflects the general likelihood of runs scoring… Read more »

Paul E
Paul E
4 years ago
Reply to  Bob Eno (epm)

Bob,
“So, yes, Mantle’s teammates get more opportunities, and that’s built into the RC calculations.”
I don’t believe so. If RC can be reduced, in its most basic form, to OBA x Total Bases, then it is solely that ball player’s runs created in a vaccuum and doesn’t take into account teammates’ contributions. While RC/27 is a hypothetical team full of that player making all the outs in a game, plain old “RC” is merely a season total of that individual player’s contributions.

Bob Eno (epm)
Bob Eno (epm)
4 years ago
Reply to  Paul E

Paul, I think you’re right, although you left out of the simple formula for RC the denominator of PA, which includes the player’s outs. In thinking about this over the course of the day, I realized that although the various batting events are all weighted according to their probabilities of increasing run production, outs are not weighted, and, of course, each out has a negative probability of increasing run production (I think overall the figure is ~0.27 runs, a figure I just grabbed off FanGraphs). So there was a flaw in my thinking and your point is correct on that… Read more »

Bob Eno (epm)
Bob Eno (epm)
4 years ago
Reply to  Bob Eno (epm)

Paul, I’ve been working on the Jeter vs. Smith answer this evening, and I can see I’m not going to get it pinned down fully in a short time. But here are some thoughts. B-R obviously thinks the answer is Smith: it gives him more WAR in about 15% fewer PA. Win Shares doesn’t share that view: ..PA……WAR……WAR/500PA……WS…….WS/500PA 12602…..72.4………..2.87………..414…………16.4………Jeter 10778…..76.9………..3.57………..325…………15.1………Smith As you’d expect, the biggest difference is in fielding. When it comes to offense, B-R gives Jeter 2.4 times the oWAR of Smith (after Rpos – which is not identical for the two – is removed), while WS makes that… Read more »

Paul E
Paul E
4 years ago
Reply to  Bob Eno (epm)

Bob,
“The answer points to Smith, in my view”
Agreed. Yes, that’s basically where we’re at in the SABRmetric universe where WS and WAR collide and, I believe, Jeter vs. Smith is a prime example of the conundrum of how much weight to assign fielding. IIRC, Bill James ripped Hornsby as mediocre with the glove and thought Collins and Morgan fielded well enough to be at least his equal overall at 2B.

Paul E
Paul E
4 years ago
Reply to  Bob Eno (epm)

Bob,
Over the period discussed, Mantle created 151 runs per 162 games; Mays 147. Mantle expended 399 outs to do this; Mays 448 outs. For every 448 outs Mantle made, he created 170 runs !! Those 23 runs probably represent a minimum of 4 wins – a large advantage. As far as the esoteric, Mantle totaled 711 Rbat for the period; Mays 625. So, about 7 more Rbat per 162 G.

Bob Eno (epm)
Bob Eno (epm)
4 years ago
Reply to  Paul E

Paul, First, I’ve now been through Bill James’s formulas for RC in Win Shares and, indeed, outs are not weighted in the formulas for RC, so that confirms that my earlier supposition was not valid, as you suspected. What I had recalled was that James did take outs made into account in calculating Win Shares from RC. Second, I believe the runs-to-wins conversion is on the scale of 10-1, not 5-1 or 6-1. In Win Shares, the examples I’ve picked out all tend to be greater than 10-1. So I think it would be more accurate to say that through… Read more »

Paul E
Paul E
4 years ago
Reply to  Bob Eno (epm)

Bob,
You’re probably correct about the “10-1” ratio issue on WS since James is probably using TOTAL number of runs scored in the average game versus, say, an average score of 5.5 – 4.5 and then using 5.5 runs as enough to win and, therefore, 5.5 runs = one “WS”.
Yes, Mays’ fielding advantage probably puts him over Mantle – even for the period discussed, let alone even later in Mantle’s career when he was even more limited and less of a hitter.

Voomo Zanzibar
Voomo Zanzibar
4 years ago

Carlos Santana last night had the 9th recorded instance of
1 double
1 triple
1 HR
2 walks

Missed the cycle by a single.
I’m unable to see if any of the other 8 missed the cycle, because I’ve convinced myself that if I pay for a b-r subscription, I will spend too much time thinking about baseball.

Voomo Zanzibar
Voomo Zanzibar
4 years ago
Reply to  Voomo Zanzibar

Figured out how to game the system (which means I spent more time thinking about baseball than if I just had a subscription).

6 of the other 8 also missed the cycle.

The last one being Jose Bautista in this game:

https://www.baseball-reference.com/boxes/TOR/TOR201104220.shtml

The first one being Jimmy Johnston, here:

https://www.baseball-reference.com/boxes/PHI/PHI192306270.shtml

mosc
mosc
4 years ago
Reply to  Voomo Zanzibar

Made me grin. Thanks for satisfying our curiosity!

Bob Eno (epm)
Bob Eno (epm)
4 years ago

One feature of Win Shares that I think is also worthy of discussion is the absence of negative numbers, or negative Win Shares, or “Loss Shares,” in the system. I know that James has defended this decision against suggestions that they should be an element, but I haven’t come across the specific argument in his book so far as I return to poke through it (perhaps I’ve seen his rebuttal elsewhere). WAR and WAA have negative numbers because they measure players against a benchmark set by norms of play in their leagues and seasons. Win Shares is doing something different:… Read more »

mosc
mosc
4 years ago
Reply to  Bob Eno (epm)

Good post Bob. I’ve tried to write replies to this thread several times and I’ve deleted them for being too critical and emotional. I wholeheartedly agree with what you’re saying and am impressed by your… restraint?… in phrasing it so well.

Bob Eno (epm)
Bob Eno (epm)
4 years ago
Reply to  mosc

Thanks for the kind words, mosc. In return, I’ll confide to you my nightmare: that someone tells Bill James there’s a guy on HHS badmouthing WS, and James posts here to demonstrate what a complete idiot I am. If Doom can do it (and he has) imagine what James could do.

Doug
Doug
4 years ago
Reply to  Bob Eno (epm)

I suppose, in theory, once could calculate Loss Shares following the same philosophical approach that all of the players share responsibility for a team’s losses, and then distribute these loss shares among the players accordingly (presumably on a different basis than the Win Shares were distributed). Then, you could have something like “Result Shares” where RS = WS – LS, which would total to a team’s Win minus Loss total.

Bob Eno (epm)
Bob Eno (epm)
4 years ago
Reply to  Doug

There actually is such a metric: it’s called “Win Shares Above Bench.” The Baseball Gauge has it as a player stat options, so the calculations are there. I think I’ll try using it out in comparison with CAWS, adapting the CAWS formula (though anyone is welcome to beat me to it).

no statistician but
no statistician but
4 years ago
Reply to  Doug

Doug: I suspect that loss shares, if they could be configured, which I doubt, would fall much more heavily on the pitching staff, at least in today’s game. One thing that I think is getting a little overlooked in the heat of the fray above is that the Win Share theory has to do with how valuable a player is to his own team over a season. I’ve tried—and failed—to work out how win shares are decided for a particular team, but I don’t know that that matters. What I’m going by is the NBJHBA, since that’s easy to deal… Read more »

Bob Eno (epm)
Bob Eno (epm)
4 years ago

nsb, I think using WS to measure players’ dominance of their teams is a very good use of the system, though it might be best, for position players, to focus on the offensive component, which WS seems to be better equipped to deal with. But your invocation of Frank Thomas the First caught my eye and is prompting this sidetrack: Thomas, unlike most ’62 Mets, had a fully professional season that year: not outstanding, but solid, with an OPS+ of 117. Given the Mets’ marvelously low victory total, I thought this might be a good test to see whether Thomas… Read more »

no statistician but
no statistician but
4 years ago
Reply to  Bob Eno (epm)

It seems kind of crazy. Davis has 26 total WS for 1962 on a team that won 102 games, so his slice of the Dodgers’ pie is 8.4 %. And you’re right, I think. There are rewards for being on a good team and penalties for being on a bad one commensurate with the team’s total performance. But is that always the case? With Ruth on the 1919 Bosox and Carlton on the 1972 it doesn’t seem so, or not so much. Davis, for what it’s worth, was playing in Dodger Stadium at home and Thomas in the Polo Grounds,… Read more »

Bob Eno (epm)
Bob Eno (epm)
4 years ago
Reply to  Doug

Good research, Doug. The strength of schedule is an important feature of bWAR. But Milwaukee was the class of the league, and Friend actually looks to me to have an advantage over Kline here, especially since he has twice the innings in Braves games that Kline has against the Giants, a pretty good team in ’58 (though, really, only Milwaukee stood out in the compressed league records of 1958). Having said that, Friend’s record on strength of schedule was precisely league average, while Kline’s was 0.30 runs allowed per nine innings below. So the figures you post here must work… Read more »

Doug
Doug
4 years ago
Reply to  Bob Eno (epm)

My sense is the 79 innings that Friend underperformed against the Phillies and Giants trumped his 49 good innings against the Braves. That’s probably the most significant factor.

Bob Eno (epm)
Bob Eno (epm)
4 years ago
Reply to  Doug

Well, the urge to argue by adding the Cardinals to Friend’s Braves innings is a mighty urge indeed, but since the RA9avg totals given on B-R already confirm your general conclusion, I think everyone will be happier if I stifle that urge.

Bob Eno (epm)
Bob Eno (epm)
4 years ago
Reply to  Doug

So I thought as a test run, I’d compare A-Rod and Jeter using “Win Shares Above Bench” — WSAB — which attempts to incorporate “Loss Shares.” The developer of WSAB, Dave Studerman, notes that there really are no Loss Shares in the system: it’s just a shortcut to a similar result by introducing a replacement level benchmark (so to speak): playing quality at a .350-team level (which is significantly higher than B-R or FanGraphs’ WAR replacement level). Play below that level earns negative Win Shares, which are a proxy for Loss Shares. Jeter’s fielding falls into negative territory for six… Read more »

Bob Eno (epm)
Bob Eno (epm)
4 years ago
Reply to  Bob Eno (epm)

After finishing this latest post, it occurred to me that the heart of the distinction between WS and WAR may be this: WAR measures qualities: its numbers are basically adjectives, meaning “this good.” WS measures quantities — noun-like things: wins. It tells us not “this good” but “this many.”

You can have negative adjectives (good / bad), but when you negate a noun it just zeroes out. (You can’t eat -2 apples.) I think this is really the underlying conceptual distinction between WAR and WS.

mosc
mosc
4 years ago
Reply to  Bob Eno (epm)

I followed the defensive post perfectly. Your analogy had me totally lost though LOL

Bob Eno (epm)
Bob Eno (epm)
4 years ago
Reply to  mosc

Yet another failed analogy added my body of work!

Doug
Doug
4 years ago

Rays’ right-fielder Austin Meadows has been on fire this week, going 13 for 22 (.591) since Sunday and slugging 1.091. Most impressively, he’s struck out just once in 5 games, the third different time this season that he’s recorded just one strikeout in a 5 game stretch.

no statistician but
no statistician but
4 years ago
Reply to  Doug

And yet he’s on tract to top the century mark. In the previous seven games he whiffed eleven times. Could be he’s just streaky in terms of his ‘seeing’ the ball.

Bob Eno (epm)
Bob Eno (epm)
4 years ago

Thinking again about the issue of Win Shares penalizing players on losing teams: In 1935, Wally Berger had a terrific year, winning the NL HR and RBI titles and posting figures that translate to a 148 OPS+. He finished sixth in the MVP vote. His team, The Boston Braves, finished eighth, with a 38-115 record. Not many wins to share. Here’s a comparison from that year, both players being centerfielders: PA……..H……HR…..BB……SO…….BA……OBP……SLG…..OPS+….OffWS…oWAR (minus Rpos, est.) 643…174…..34……50…….80…… .295… .355….. .548…..148………20.5…….5.7……….Wally Berger 680…203…..22……48…….29…… .331… .356….. .462…..141………23.7…….5.9……….Hank Leiber Nothing in the peripherals (GIDP, HBP, SB, etc.) alters this overall picture, and Braves Field was… Read more »

Bob Eno (epm)
Bob Eno (epm)
4 years ago
Reply to  Bob Eno (epm)

I was poking around for further examples by examining comps for the better players on the 1916 Athletics (36-117; worse than the Mets). I was going to note how Amos Strunk, the left fielder (151 OPS+) had a couple fewer WS than Bobby Veach in the Tiger outfield (140 OPS+), but then I spotted this comparison between pitchers, and it’s so extreme I think it seals the point: …IP……ERA…..ERA+…..RA…….pWAR…..WS 287…..2.57…..110……3.43……..5.4………7.6……Bullet Joe Bush (A’s: 36-117) 226…..2.63…..105……3.31……..2.6…….15.2……Ernie Shore (BoSox: 91-63) (I added the links so it would be easy to look at the traditional stats. I’ve added Run Allowed for balance, since… Read more »

Doug
Doug
4 years ago
Reply to  Bob Eno (epm)

I think you’ve nailed it Bob.

The “trust me, it works” argument is bound to fail in some cases, and it seems you’ve found one. A deterministic, logic-based proof will always be preferable, and Win Shares not having one is definitely a weakness, even if only at the extreme margins.

Doug
Doug
4 years ago

Watching the Mariners on ESPN tonight, I checked to see if any team as hot as Seattle in the first two weeks of the season had turned so cold in the month following. What I can tell you is they’re the first team since at least 1908 to win 12 or more of their first 15 games (the Mariners won 13), and then win fewer than 10 (Seattle won 9) of their next 30.

Doug
Doug
4 years ago
Reply to  Doug

Turned out to be a notable game. Mariner manager Scott Servais had named Wade Leblanc the starter for tonight’s game, then changed his mind and instead went with Cory Gearrin as an opener. Not the right move, as Gearrin took the loss, allowing 3 runs in his one inning of work, before giving way to Leblanc who finished the game, allowing just one run the rest of the way. It was the longest game-finishing relief appearance in a 9-inning game since Neil Allen for the Yankees in 1988. Something I just noticed about Leblanc is that he recorded his first… Read more »

Mike L
Mike L
4 years ago
Reply to  Doug

For a moment, I thought it could be Jamie Moyer. But I was wrong–he had qualifying seasons at age 24 and 25, and then not another one until his age 34 year.

Doug
Doug
4 years ago
Reply to  Mike L

Actually, only three Mariner lefties have recorded a qualified season at age 33. One is in the HoF; Leblanc and our mystery man are the other two.

Mike L
Mike L
4 years ago
Reply to  Doug

Bill Krueger. Sometimes starter, sometimes reliever, sometimes both. That’s the Hall of Famer, right?

Doug
Doug
4 years ago
Reply to  Mike L

Krueger’s the one, but I’ll give the tie-breaker to LeBlanc, who was more than 8 months Krueger’s senior in their age 33 seasons.

Mike L
Mike L
4 years ago
Reply to  Doug

It takes an unusual kind of pitcher to meet the criteria–an early starter who then converted mostly to relief, and then back into a (mostly) full-time starter. Or an oft-injured pitcher (James Paxton has 110 starts, no relief appearances, has not had a qualified season, and won’t have one this year.

Doug
Doug
4 years ago
Reply to  Mike L

Or just be a modern 5 or 6 inning starter. Prior to this season, Chase Anderson had 5 straight years with 20 starts and nary a qualified season. Or Tyler Chatwood, with the same 5 seasons, but with some shorter seasons mixed in.

Mike L
Mike L
4 years ago
Reply to  Doug

I suppose you are correct, if a starter manages 30 starts and 5.1 per, he doesn’t get there.

Bob Eno (epm)
Bob Eno (epm)
4 years ago
Reply to  Doug

I don’t know the answer, Doug. But I have to say that I’m amazed how you and Voomo are able to look at today’s games and spot how some game or individual performance that my eye passed over lands in historical territory. John Autin used to do that here too, and I always find it impressive.

Richard Chester
Richard Chester
4 years ago
Reply to  Doug

Bill Krueger?

mosc
mosc
4 years ago

Sometimes it bothers me how good at that you are RC

Richard Chester
Richard Chester
4 years ago
Reply to  mosc

mosc: Do you remember that, several years ago, I told you that I put your WAR averaging system into a spreadsheet?

Doug
Doug
4 years ago

CC’s pending retirement invites the question of his Hall credentials. Here are some similar pitchers by WAR, IP, W-L% and ERA+.

But, their WS and CAWS are not so similar.
Hubbell – 305/262
Marichal – 263/238
Sabathia – 241/189
Pettitte – 224/169

So, is the Hall borderline between Pettitte and Sabathia, or between Sabathia and Marichal, or is it south of Pettitte?

Bob Eno (epm)
Bob Eno (epm)
4 years ago
Reply to  Doug

I think the way to approach this question may not be through WAR or WS directly, but by thinking about how these four differ in ways that could pull the apart a little more. The columns that stand out are obviously CG/ShO. We all know why. But to me this introduces a real disparity in all the numbers. If you eliminate relief innings (Hubbell: 231; Marichal: 30; Pettitte: 16; CC: 0), the breakdown in IP/GS is: Hubbell: 7.8 Marichal: 7.6 Sabathia: 6.4 Pettitte: 6.3 The numbers of 8th and 9th innings pitched by the four (as starters and relievers) are:… Read more »

Doug
Doug
4 years ago
Reply to  Bob Eno (epm)

It’s notable that, by the end of the year, CC will have 100+ more starts than Marichal, and 125+ more than Hubbell. So, not having to pitch all those 8th and 9th innings added 3 or 4 years to CC’s (and Pettitte’s) careers. So, are those extra years as valuable as the many more CGs that Marichal or Hubbell pitched? WAR would say yes, but not WS.

Bob Eno (epm)
Bob Eno (epm)
4 years ago
Reply to  Doug

Terrific point, Doug. I haven’t done the math to figure out how and why WS differs from WAR on this, but I think a key difference is that WAR measures quality of play, while WS measures value to teams. Stretched out careers like CC’s provide a lot of value to franchises that hold his contract for multiple years — they can cash in his high-quality pitching over a stretch of contending seasons, if they are, in fact, contending. But the value of CC’s high-quality pitching is limited each season by his lower IP, so each team benefits less than, say,… Read more »

Paul E
Paul E
4 years ago
Reply to  Doug

seems to me that if one was asked to rate the four in order of excellence, WS/CAWS has it right. …. as does ERA+ ?

Bob Eno (epm)
Bob Eno (epm)
4 years ago
Reply to  Paul E

That’s how I read it, Paul. I’ve been trying to think of why WAR has Marichal calculated so low. One reason may be that WAR calculates a strength-of-schedule component, comparing a pitcher’s runs allowed against the runs the specific teams he faced scored on a season basis, and the average rate of RA expected for those team when adjusted for park factors. Marichal allowed 0.68 fewer runs than the predicted average over his career, but CC’s figure is -0.77 (on a somewhat higher base). (I tend to think of Marichal and Koufax as roughly comparable pitchers, Koufax having the higher… Read more »

Paul E
Paul E
4 years ago
Reply to  Bob Eno (epm)

I guess Marichal was fortunate not to have to face McCovey, Mays, Cepeda, Bonds, etc… versus Wes Parker, Maury Wills, Willie Davis, and Roseboro. But, I imagine WAR gets further into Koufax facing the Braves six times on the road in Atlanta in 1966 versus Marichal facing the Mets at Shea half a dozen times….makes sense. And I doubt it very much that WS has such a component

Bob Eno (epm)
Bob Eno (epm)
4 years ago
Reply to  Paul E

I’ve looked through the formulas for pitching in Win Shares and there is no calculation of strength of opposition or expected average pitcher performances against specific teams in specific parks. The strength of schedule component in WAR is, in my mind, an impressive feature. However, it shares a defect with RA9def: it assumes that every time a pitcher faces a team the strength of that team is its season average (just as a pitcher’s team’s defense is assumed to be identical behind every pitcher and in every game). That’s certainly not the way the world works, and Doom has been… Read more »

trackback

[…] career value for players of the past century (since 1920), commonly known as the live ball era. In Part 1. Michael introduced his CAWS metric, which stands for Career Assessment Win Shares, based on the […]

trackback

[…] Fame-worthy careers as measured by the CAWS Career Gauge. For an introduction to CAWS, please see Part 1. For an explanation of Hall of Fame standards as measured by CAWS, please see Part […]

Joe Garrison
Joe Garrison
3 years ago

Now that The Baseball Gauge has been shut down, is there another website I can use to continue my study of Win Shares?