Proceed with caution: the toughest pitchers to run against

Kenny RogersWhich pitchers are the toughest to run against? Well, Kenny Rogers on the left there is certainly among them (what do you think: is that Kenny’s no-look pickoff move to 1st base; or is he staring down the runner on 3rd as he delivers the pitch?)

There are a lot of ways to look at this question. After the jump, I’ll consider a few of them.

Continue reading

Quiz – “Great baffling box scores, Batman!” (solved)

In the game-searchable era (since 1916), there is something that has happened during a major league game only 4 times, specifically in the games below.

What is it?

1923-06-06 – White Sox 4, Yankees 1, Red Faber homered off of Herb Pennock

1929-06-24 – Tigers 13, White Sox 4, Red Faber homered off of Emil Yde

1948-09-20 – Phillies 5, Pirates 2, Bob Chesnes homered off of Robin Roberts

1962-05-05 – Athletics 18, Indians 6, Jerry Walker homered off of Pedro Ramos

Happy sleuthing!

Congratulations to Stuart! He correctly identified the above games as the only contests since 1916 to feature a home run hit by a switch-hitting pitcher off of another switch-hitting pitcher who also homered in his career. Thanks to Baseball-Reference.com for the home runs logs.

Continue reading

Percentage of full seasons played by rookies

Here’s a simple calculation that reveals lots of interesting stuff. Using B-R.com’s new option to limit searches to players who qualify as rookies (using the modern definition only), it’s easy to find what fraction of players each season who qualified for the batting title also qualified as rookies.

This is what the data looks like:

percentage rookies

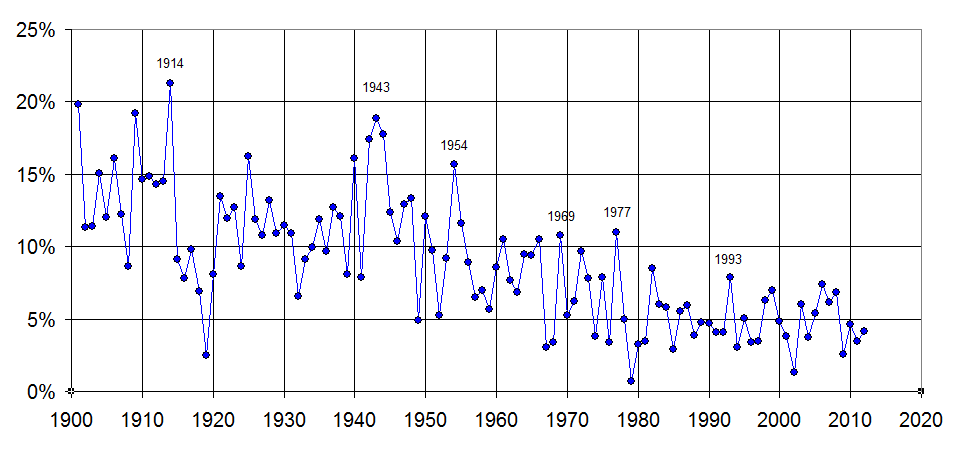
The overall trend is clear. In the early part of the 20th century, about 15% of full-time players were rookies. There is an uptick in 1914 as the Federal League was formed and lots of new players were brought in. In the late 1910s, nearly no rookies played full seasons but by the 1920s the rate was back up to about 12%. When World War II came around, the rate spiked as a lot of established players left for military service. There was a spike from 1952 into 1953, due to the Korean War. The rate spiked even further in 1954, but I’m not sure why, as that war was already over and guys like Ted Williams and Willy Mays were back.

By the 1960s, the rate of rookies dropped down to about 9%. In the 1970s, it went even lower, plummeting to an all-time low in 1979. From 1980 on, the rate has been relatively consistent around 5%. Note a few upticks in expansion years of 1969, 1977, and 1993.

I wonder why the fraction of rookies has dropped gradually over time? September call-ups probably have something to do with it–more players qualifying as rookies before playing a full qualifying season. There may just also be less playing of rookies full time–for example fewer rookies winning jobs in spring training.

What else can we surmise from this data?
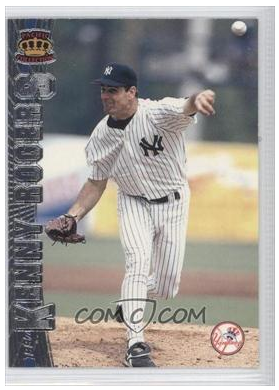
Stan Musial’s Cardinals faced a LOT of lefties

“Well … yes, and here we go again.”

Previously, I discussed the platooning of Stan Musial in his rookie year, noting that the 1942 Cards faced a lot of lefty starting pitchers.

I didn’t know the half of it.

In the course of Musial’s career, the Cardinals faced a lefty starter in 40% of their games — a rate 38% above the rest of the National League.

Continue reading

The Hall of Peak Value

Soon after I posted my piece about the Hall of Could’ve Been, commenters started naming players who fit the title of the Hall better than most of the players I included.  Herb Score, Tony Conigliaro, Dickie Thon, J.R. Richard, Pete Reiser, and many other players had practically unlimited potential, only to see their careers derailed, usually by injury.  The two sets of criteria I established put the spotlight on a few players who could have been much more than they were and a few who actually did achieve greatness, but who just happened to have the right mix of single-season and career WAR to make the cut.

The players I listed may fit better in the Hall of Peak Value than in the Hall of Could’ve Been.

Continue reading

Jeremy Sowers – last of a breed?

“Who?”, you say. If somehow you have never heard of Jeremy Sowers (or don’t remember him), he was a bottom-of-the-rotation guy for the Indians in the last decade. Got off to a real nice start in a half-year rookie campaign in 2006. In 14 starts, Sowers went 7-4 with 126 ERA+ and a couple of shutouts. He wasn’t striking out many (3.6 SO/9) but made up for it with unusually good control for a young pitcher (2.0 BB/9).

Unfortunately, the promise of that first season was not fulfilled, as Sowers’ control started to fail him. Not horrendously, but it’s a fine line between success and failure when you’re not striking out many. The result was ERA+ scores for his next three seasons all on the wrong side of the century mark (actually, not even close to that mark). Sowers hasn’t pitched in the majors since losing to Dice-K and the Red Sox in the season-ending series of the 2009 season.

No doubt, there will always be pitchers who start impressively and then fizzle. So, what breed might Sowers be the last of? I’ll tell you more after the jump.

Continue reading

Best Rookie Seasons, By Franchise

The newest toy (or tool, depending on seriously you take these things) at the baseball-reference .com Play Index is a Rookie button that allows one to search for rookie seasons only. The tool will not line up perfectly with players who have been considered “rookies” historically because (1) b-ref uses the current MLB rookie definition and applies that uniformly to all seasons going back in time, and (2) b-ref is fudging a bit on the service time part of the rookie definition, so it can be applied within the scope of the data b-ref has. But the results are still very useful and interesting, and with b-ref’s prominent position in the world of historical baseball data these days, I wouldn’t be surprised if b-ref’s approach to defining a “rookie” becomes the standard definition for historical purposes.

Using b-ref’s new Play Index tool, here are (after the jump) the top rookie seasons by non-pitchers (1901-2012) for each current franchise, by season Wins Above Replacement (using the b-ref version of WAR of course): Continue reading

Quiz – Who is this man? (solved)

Recognize the player below? He is the subject of today’s quiz.

Your job is to identify him and explain why he belongs in the same group of live-ball era players listed below.

www.baseball-reference.com

www.baseball-reference.com

Hint: this group is defined by a season accomplishment involving statistics displayed on B-R main player pages.

Congratulations to Richard Chester and Josh, who solved this two part quiz (with some help from their friends, including Hartvig who identified an alternative solution). The pictured player is Len Koenecke. He and the others in the list are the only players since 1920 with a first qualifying season (among their first two seasons) with a .300/.400/.500 slash, a 145 OPS+ or better (or 4 WAR or more) and 25 or fewer home runs.

Continue reading